

Abstract
Rationale:
Inflammatory stress induced by exposure to bacterial lipopolysaccharide (LPS) causes hematopoietic stem cell (HSC) expansion in the bone marrow niche, generating a cellular immune response. As an integral component of the hematopoietic stem cell niche, the bone marrow vasculature regulates the production and release of blood leukocytes, which protect the host against infection but also fuel inflammatory diseases.
Objective:
We aimed to develop imaging tools to explore vascular changes in the bone marrow niche during acute inflammation.
Methods and Results:
Using the Toll-like receptor ligand LPS as a prototypical danger signal, we applied multi-parametric, -modality and -scale imaging to characterize how the bone marrow vasculature adapts when hematopoiesis boosts leukocyte supply. In response to LPS, ex vivo flow cytometry and histology showed vascular changes to the bone marrow niche. Specifically, proliferating endothelial cells gave rise to new vasculature in the bone marrow during hypoxic conditions. We studied these vascular changes with complementary intravital microscopy and PET/MR imaging. Fluorescence and PET integrin αVβ3 imaging signal increased during LPS-induced vascular remodeling. Vascular leakiness, quantified by albumin-based in vivo microcopy and MRI, rose when neutrophils departed and hematopoietic stem and progenitor cells (HSPC) proliferated more vigorously.
Conclusions:
Introducing a tool set to image bone marrow either with cellular resolution or non-invasively within the entire skeleton, this work sheds light on angiogenic responses that accompany emergency hematopoiesis. Understanding and monitoring bone marrow vasculature may provide a key to unlock therapeutic targets regulating systemic inflammation.
Keywords: Angiogenesis, bone marrow, lipopolysaccharides, inflammation, imaging
Subject Terms: Angiogenesis, Inflammation, Imaging, Nuclear Cardiology and PET, Magnetic Resonance Imaging (MRI)
INTRODUCTION
Bone marrow endothelium is located in close proximity to hematopoietic stem and progenitor cells (HSPC), which produce most blood cells1–4. The bone marrow is highly vascularized; its vessels act as gates for hematopoietic niches and the blood to exchange information, cells, nutrients and waste products3. In addition, endothelial cells participate in niche cell functions by instructing HSPC and their progeny. Reacting to systemic signals, endothelial cells relay incoming information to hematopoietic cells via surface-bound and secreted signals, thus supporting either quiescence or proliferation depending on peripheral blood cell demand3, 5.
While we conceptually understand endothelial cells’ strategic importance for steady state hematopoiesis, concrete information on how the vascular niche adapts to disease remains relatively sparse. To a large degree, our insight is hindered by technical hurdles related to the tissue’s location within calcified bone. The dense bone cortex scatters photons, hence impeding optical imaging. Modalities relying on longer wavelengths, such as nuclear imaging, or precessing dipole moments, such as magnetic resonance imaging, image bone more easily but are seldom applied to study hematopoiesis. Our primary objective was to test and validate PET/MR imaging of the bone marrow vasculature, integrating PET/MR with near infrared intravital microscopy via multimodal imaging agents that are fluorescent and radioactive or paramagnetic. The notion that imaging can be transformative is illustrated by the recently developed intravital microscopy of the calvarium4, 6, 7 and ex vivo imaging of long bones8. Imaging revealed that angiogenesis plays an active role in bone formation during development9, that bone remodeling is driven by oxygen tension and the production of vascular endothelial growth factor (VEGF)10, 11, that endothelial permeability changes in leukemia4, 12 and that radiation preceding bone marrow transplantation affects the niche vasculature13. However, how bone marrow vasculature anatomy and function respond to inflammatory stimuli is incompletely understood, which gave rise to the secondary objective of our study.
We employed multi-scale and multi-parametric imaging to characterize the bone marrow vasculature response to LPS, a prototypical inflammatory component of the bacterial wall. This well-characterized Toll-like receptor (TLR) ligand binds TLR4, increasing cell proliferation and differentiation as well as output of mature myeloid cells, including neutrophils14, 15, which serve as a first line of defense against infection. We use imaging to report that LPS triggers profound bone marrow vasculature remodeling, including a surprising angiogenic response. Angiogenesis was accompanied by functional changes, like increased vascular leakiness and neutrophil release, and coincided with enhanced HSPC proliferation. To address the inherent technical limitations of microscopy, i.e. lack of clinical translatability and confinement to data derived from a small fraction of the hematopoietic skull marrow close to the microscope’s objective, we deployed clinically viable PET and MR imaging agents that correspond to the targets observed with fluorescence microscopy. Whole mouse PET/MRI complemented invasively obtained cellular resolution data, thereby indicating that such imaging may be used to characterize the entire marrow host response, possibly also in humans.
METHODS
A detailed method section is available in the Online supplement. The data that support the findings of this study are available from the corresponding author upon reasonable request.
Mice.
Female wild-type C57BL/6 mice (26±1 weeks old) were purchased from Jackson Laboratories. Older mice were chosen to reduce the impact of growth plate angiogenesis during longitudinal bone growth10. We chose older female mice as co-housed females have a lower propensity to fight than older male mice. Inflammatory stress was induced by intraperitoneally injecting 0.8 mg/kg lipolysaccharide (LPS; Lipopolysaccharides from Escherichia coli O55:B5, Sigma-Aldrich). Mice received isoflurane (3–4% induction; 1–2% maintenance) unless stated otherwise. All mouse procedures were approved by the Institutional Animal Care and Use Committee (IACUC) Subcommittee on Research Animal Care (SRAC), Massachusetts General Hospital, Charlestown, MA.
Confocal microscopy.
Intravital microscopic imaging:
Intravital microscopy was performed in vivo on calvaria and ex vivo on femurs with a confocal microscope (IV100 Olympus) as outlined in Online Figure I. A field of view at 4X magnification covered a 2290μm*2290μm, and 20X a 458μm*458μm dataset of 512 × 512 pixels. Z-stack images were acquired at 2μm steps. For in vivo imaging, mice were shaved at the skull and held in a stereotaxic skull holder. A skin incision revealed the calvaria, and glycerin (Sigma-Aldrich) was applied to prevent the tissue drying. The calvarian bone marrow was exposed as described before7. To delineate bone marrow cavities in the calvaria, OsteoSense® 750EX, a fluorescent bisphosphonate imaging agent, was administered intravenously 24 hours prior to imaging (4 nmol/mouse, NEV10053EX, PerkinElmer). IntegriSense™ 680, as an angiogenic marker for integrin αvβ3 activation, was administered intravenously 24 hours prior to imaging (2 nmol/mouse, NEV10645, PerkinElmer).
To outline the vasculature, we used FITC anti-CD31 (50μl, MEC13.3, 102514, Biolegend). To assess VEGFR2 activation, APC anti-VEGFR2 (Avas 12, 136406, Biolegend) was used in combination with IntegriSense 750™ (2 nmol/mouse, PerkinElmer, NEV10873). To analyze vascular leak, we followed a single plane through the center of the marrow cavities over 6min at a frame rate of 0.2083 frames/sec before and after bolus injection through an indwelling tail vein catheter of bovine serum albumin (BSA) labeled with rhodamine B and gadopentetic acid (GdDTPA) (RhoB-albumin-GdDTPA; excitation/emission: 555nm / 581nm, 82kDa, 2.5mg/mouse, Symochem, The Netherlands). For serial permeability imaging, FITC-albumin (495nm; 66kDa; 2.5mg/mouse; Sigma) was employed with the same temporal settings. To follow the cells serially by intravital microscopy of the calvarium, LSK (Lin-Sca-1+c-Kit+) were labeled ex vivo with the Vybrant® DiD Cell-Labeling Solution (1,1′-dioctadecyl-3,3,3′,3′- tetramethylindodicarbocyanine perchlorate, Molecular Probes®) according to manufacturer’s protocol. C57BL/6 mice were then intravenously injected with 75,000 labeled LSKs. In vivo imaging was performed using a confocal microscope (IV100 Olympus) on days 1 (day 0) and 2 (day 1) after adoptive cell transfer. Separately, 30min after intravenous injection of APC anti-Ly6G (1A8; Biolegend), Ly6G+ neutrophils were imaged on day 0 and day 1. For LSK and Ly6+ neutrophil serial imaging, LPS was injected intraperitoneally directly after the imaging session at day 0. After intravital microscopy, animals were sacrificed and femurs were dissected in 4% PFA and embedded in OCT. Femurs were shaved 300μm with a cryostat at −25°C to expose the bone marrow. These long bones were then thawed and imaged by confocal microscopy (IV100 Olympus) or by an epifluorescence imaging system (OV110 Olympus).
Image processing.
Maximal intensity projections (MIPs) of z-stack were reconstructed and processed using Image J version 1.51r software (NIH). The signal intensity derived from IntegriSense MIPs of 16 slices was used to generate a thresholded image of the bone marrow vasculature and quantify, using the tracer, the percent area occupied in the FOV. To quantify the number of junctions from an MIP with 16 slices, thresholded images were analyzed with AngioTool16. Regions of interest for junction analysis were within the bone marrow niche 100μm × 100μm. To quantify the number of buds from an MIP with 16 slices, buds > 10μm protruding from a vessel were manually counted in ImageJ. Regions of interest for bud analysis were located within the bone marrow niche. For analysis of fractional blood volume, the first frame after albumin injection represented the amount of functional blood vessels, or (micro)vascular density, in the bone marrow niche. The extravasated RhoB-albumin-GdDTPA at t=2min post injection showed vessel permeability in control and LPS-treated animals. To assess vascular leakiness, we used the strategy detailed in Online Figure II. The signal intensity derived from the first image after RhoB-albumin-GdDTPA injection was used to generate a thresholded image of the bone marrow vasculature. Background subtraction was performed with a manual threshold. The thresholded area was used to segment the signal intensity derived from the albumin inside and outside of the vasculature. The ratio between these two intensities (outside/inside) per time denotes vasculature leakiness at the given location. Target-to-background ratios of IntegriSense signal in whole mount femur images from the ov110 Olympus were calculated using image analysis of mean intensity at ROI of the whole femoral bone marrow divided by mean intensity of a background ROI.
PET/MRI acquisition.
Magnetic resonance imaging (MRI) combined with positron emission tomography (PET)/ computed tomography (CT) was performed sequentially as described in Online Figure I. In short, mice were placed in a custom-designed mouse bed compatible with both MRI and PET/CT. Mice were imaged in a 4.7 Tesla Pharmascan (Bruker) with a mouse volume coil (Rapid Biomedical) and monitored with respiratory gating (SA instruments). Each mouse underwent T2-weighted MRI and albumin-based dynamic contrast enhanced (DCE) MRI which lasted about 40min total. A Rapid Acquisition with Refocused Echoes (RARE) sequence was first acquired with the following parameters for T2-weighted imaging: TE 40 ms; TR 4000ms; echo spacing 10ms; RARE factor 10; averages 8; FOV 40×40mm; matrix 256×256; slice thickness 1mm; 20 axial slices; spatial resolution 0.156 × 0.156 × 1 mm3/voxel; acquisition time 13min20s. For macromolecular dynamic contrast enhanced (DCE)-MRI, a bolus of RhoB-albumin-GdDTPA (10mg/mouse; Relaxivity = 145mM/s; Symo-Chem, The Netherlands) was injected intravenously through an indwelling tail vein as previously described17, 18. After a series of variable flip angle precontrast T1-weighted Fast Low Angle Shot (FLASH), the imaging agent was injected and images were sequentially acquired to determine the endogenous precontrast R1. Dynamics of the labeled albumin were followed every 25sec, for 4min after contrast administration, using 2D FLASH images longitudinally over the entire femur. Imaging parameters were as follows: precontrast flip angles 2°, 6°, 9°, 15°, 25°, 50°, 70°; postcontrast flip angle = 50°; TR=25ms; TE=2.748ms; number of averages=2; FOV 20×20mm; 1 slice; 1.2mm slice thickness; spatial resolution 0.078 × 0.078 × 1.2 mm3/voxel; temporal resolution of 10s 200ms; no zerofilling.
Small animal positron emission tomography (PET)-computed tomography (CT) imaging was done 120min after 68Ga-NODAGA-RGD was injected via tail vein. This imaging time point was chosen based on published biodistribution data to avoid background19. Mice were imaged three-dimensionally (3D) with an Inveon small-animal PET-CT scanner (Siemens Medical Solutions, Inc., Malvern, PA). PET acquisition time was 30 min. CT was performed prior to PET, acquiring 360 cone beam projections with a source power 80 keV and a current of 500 μA. CT was performed prior to PET, acquiring 360 cone beam projections (source power 80 keV and current 500 μA).
PET/MRI data analysis.
For albumin-based DCE-MRI, femur data were analyzed on a pixel-by-pixel basis with Matlab R2015b software (MathWorks Inc., Natick, MA) to derive concentrations of RhoB-albumin-GdDTPA for the selected slice in the dynamic datasets based on the relaxivity of RhoB-albumin-GdDTPA as described17, 18. Entire femurs were drawn as ROIs. The RhoB-albumin-GdDTPA concentrations in the ROIs were normalized to the concentration in blood calculated from a ROI placed in the vena cava. Blood curves for the first 4min are shown in Online Figure III and details of contrast agent distribution have been described previously17. From the temporal changes in these normalized concentrations, the rate of contrast accumulation or permeability * surface area product (permeability; min−1) was derived from a linear regression of the normalized concentrations over time. The permeability measured with rhodamine-albumin-GdDTPA reflects the extravasation of albumin from blood vessels and its accumulation in the tissue. Femur parametric permeability maps were projected to show the mean value in each pixel.
A 3D ordered subset expectation maximization was used with maximum a posteriori (3D OSEM/MAP) algorithm with 2 OSEM iterations and 18 MAP iterations for the PET reconstruction. CT reconstruction relied on a modified Feldkamp cone beam reconstruction algorithm (COBRA, Exxim Inc.). For PET quantitative analysis, ROIs were drawn manually, guided by CT images, in the femur of each animal. Standardized uptake values (SUV) were defined as the ratio of the tissue radioactivity concentration c(t) (Bq/g) at the time point of imaging t and the injected activity (in Bq, decay corrected for the time point of imaging t) divided by the body weight (g). Amira software (FEI) was used for 3D image reconstruction and registration of PET and MRI.
RESULTS
Inflammatory stress alters the bone marrow vasculature.
To characterize the bone marrow vasculature in response to prototypical inflammatory stress, we first studied the vascular niche in the femurs of mice after intraperitoneal LPS injection (Figure 1a). In LPS-treated mice, histomorphometric analysis revealed substantial blood vessel alterations. One day after LPS, the bone marrow contained an increased number of sinusoids with dilated lumina. Three days after LPS injection, the number of sinusoids remained elevated, yet their lumens were no longer significantly dilated (Figure 1A–D). Flow cytometric analysis revealed more endothelial cells per femur on day 3 after LPS injection (Figure 1E and F). We observed a rise in proliferating Ki67+ endothelial cells on day 1 after LPS (Figure 1G and 1H). In line with this angiogenic response, vascular endothelial growth factor (VEGF) abundance in the marrow of LPS-treated mice rose (Figure 1I). We further detected hypoxic conditions by elevated pimonidazole signals, which may have contributed to angiogenesis, in the femur marrow of LPS-treated mice (Figure 1J and 1K).
Figure 1. TLR ligand-induced alterations of the bone marrow vasculature.
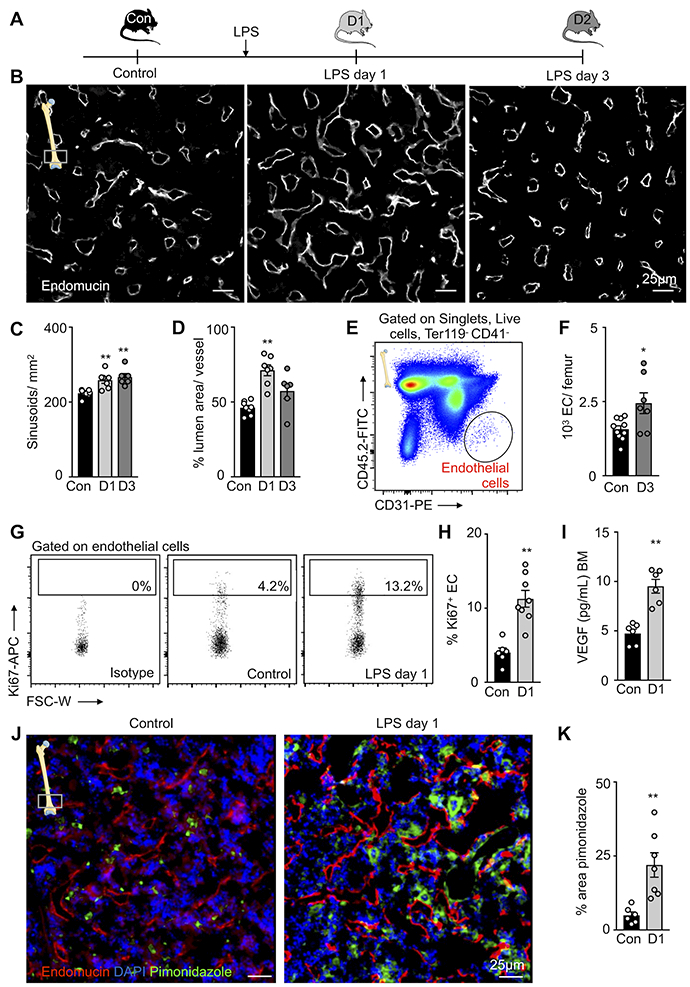
(A) Experimental set-up. (B) Representative histological images of the distal femur metaphysis stained for endomucin. (C,D) Quantification of blood vessel features on histological images of the distal femur metaphysis. Controls (con, n=8 mice), day 1 after LPS (D1, n=7), day 3 after LPS (D3, n=6 mice), 3–5 sections per animal; one-way ANOVA followed by nonparametric Kruskal-Wallis test. (E) Gating for CD41- Ter119- CD45- CD31high bone marrow endothelial cells (EC). (F) Number of endothelial cells per femur in control (n=10) and LPS-treated (n=8) mice. (G) Ki67+ staining for proliferation rates of bone marrow endothelial cells. (H) Percentage of Ki67+ BM endothelial cells in controls (n=6) and treated mice 1 day after LPS treatment (n=8). (I) Concentration of VEGF in the bone marrow (n=6 mice per group). (J) Representative histological section of the femoral distal metaphysis stained for pimonidazole/hypoxia. (K) Quantification of hypoxic regions by percent area pimonidazole per high power field in control (n=6) and LPS-treated (n=7) mice (3–5 sections per animal). Each dot represents an individual mouse; all data from three independent experiments, displayed as mean ± sem; Mann-Whitney test unless stated differently; *P<0.05, ** P<0.01, ***P<0.001.
TLR signaling induces integrin αVβ3 expression and activation in bone marrow endothelial cells.
Based on the observation that TLR signaling triggers bone marrow angiogenesis, we imaged this response with molecularly targeted agents that have translational potential. Angiogenesis-related integrins, in particular integrin αVβ3, were chosen based on prior reports of fluorescence and PET imaging19, 20. Integrins promote endothelial cell migration into hypo-vascularized regions during angiogenesis21, 22. Although many integrins are ubiquitous, integrin αVβ3 is most generously expressed on angiogenic endothelial cells22. We therefore characterized integrin αVβ3 in the bone marrow of control and LPS-treated mice (Figure 2A). Itgav RNA expression, encoding the αV subunit of αVβ3, was assessed in FACS-purified bone marrow endothelial cells and Ter119- CD41- CD45+ leukocytes. In contrast to leukocytes, endothelial Itgav expression was elevated 3 hours after LPS treatment (Figure 2B). While we observed low heterogeneous staining of integrin αVβ3 in steady state marrow, integrin αVβ3 staining increased and localized at the outer surfaces of endomucin-positive blood vessels in the marrow of LPS-treated mice (Figure 2C). We detected integrin αVβ3+ Ki67+ endomucin+ endothelial cells, indicating that proliferating bone marrow endothelial cells stain for αVβ3 integrins (Figure 2C), which has previously been observed in other vascular territories23, 24. Fluorescent and nuclear integrin-binding imaging agents are well-studied for angiogenesis in cancer24, 25 and organ ischemia26. We therefore argued that IntegriSense, a near infrared fluorescent agent26, might be useful to follow bone marrow integrin αVβ3 activation by microscopy. After intravenously injecting IntegriSense, flow cytometry reported a higher fluorescence intensity on endothelial cells in LPS-treated mice while fluorescence intensity of leukocytes remained unchanged (Figure 2D-F; Online Figure IV). Ex vivo whole mount fluorescence images displayed increased IntegriSense signal in the femur metaphysis (Figure 2G). Whereas intravenously injected, fluorescently labeled antibody for CD31 stained the inner surfaces of blood vessels, IntegriSense appeared to stain the external surfaces of endothelial cells and the surrounding stroma, a typical location of integrin upregulation during angiogenesis23. Higher IntegriSense binding after LPS treatment was confirmed by an elevated target-to-background ratio in epifluorescence imaging of femurs (Figure 2H and 2I). Recapitulating the ex vivo data, in vivo intravital microscopy documented increased IntegriSense signal in calvaria of LPS-treated mice (Figure 2J and 2K; Online Movie I, II). Of note, we also considered vascular endothelial growth factor 2 receptor (VEGFR2) as an imaging biomarker. The increased Kdr mRNA expression, encoding for VEGFR2, in FACS-purified leukocytes after LPS treatment (Online Figure VA) implies that this strategy is less specific for endothelial cells proliferating into blood vessel-poor areas. Accordingly, VEGFR2 signal, which stained the vasculature in control bone marrow niches, only increased mildly in non-vascular marrow after LPS treatment (Online Figure VB and VC). We therefore decided to pursue integrin αVβ3 rather than VEGFR2 as an imaging target.
Figure 2. Bone marrow endothelial integrin αVβ3 in response to inflammatory stress.
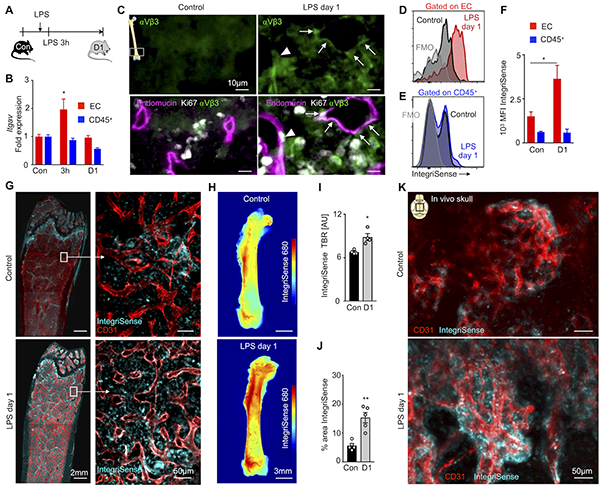
(A) Experimental outline. (B) Itgav (encoding integrin αV) expression measured by qPCR from sorted bone marrow endothelial cells and CD45+ leukocytes in control mice (con, n=5), 3 hours (3h, n=5) and 1 day (D1, n=5) after LPS injection; two-way ANOVA followed by Holm–Sidak test for multiple comparisons. (C) Histology of the distal femoral metaphysis: arrows point to colocalization of endomucin+ blood vessels and integrin αVβ3; arrowhead shows an integrin αVβ3+ endomucin+ Ki67+ cell from an LPS-treated mouse. (D,E) Flow cytometry histograms, after intravenous injection of IntegriSense, on (D) endothelial cells (EC) and (E) CD45+ leukocytes. (F) Mean fluorescent intensity (MFI) in control (n=8) and LPS-treated (n=6) mice (two independent experiments). (G) Representative whole mount metaphysis fluorescence microscopy of the femur. (H) Ex vivo epifluorescence imaging of femurs, after intravenous IntegriSense injection, with (I) quantified target-to-background (TBR) in control (n=4) mice and LPS-treated (n=4) mice. (J,K) Intravital images of CD31+ vessels and IntegriSense in control (n=5) and LPS-treated (n=5) mice. Each dot represents an individual mouse; mean ± sem; Mann-Whitney test unless noted otherwise; *P<0.05, ** P<0.01.
Bone marrow vasculature remodeling correlates with integrin αVβ3 activation.
To visualize integrin αVβ3 in conjunction with the marrow vasculature’s response to TLR ligation, we serially imaged the skull bone marrow after LPS challenge. Specifically, we used microscopy stage coordinates and anatomic landmarks7 to revisit the same hematopoietic niches on consecutive days (Figure 3A). Comparing day 0 and 1 after LPS injection, we found that the skull marrow vasculature pattern became increasingly branched (Figure 3B), a finding that correlates well with a higher number of sinusoids in the femur (Figure 1C). We quantified the number of vessel junctions using AngioTool, an automated protocol to measure changes in vascular networks16, and found an increased branching index on day 1 after LPS (Figure 3C and 3D). The same mice were injected with IntegriSense to monitor integrin abundance parallel to modified vascular anatomy. Integrin αVβ3-related fluorescence, quantified as target to background ratio in hematopoietic niches, correlated with the enlarged vascular branching index (Figure 3B and 3E). This relationship between integrin activation and angiogenesis in the bone marrow matches prior reports on other vascular territories23. Interestingly, serial intravital imaging on consecutive days after LPS challenge revealed new sprout-like vessel structures (Figure 3F and 3H). Such structures exhibited high local IntegriSense signal (Figure 3F), suggesting crosstalk between expanding endothelial cells and the extracellular matrix after LPS treatment. The αV integrins are particularly important during tissue remodeling associated with angiogenesis, as they allow endothelial cells to reach out and expand their vascular beds22.
Figure 3. Angiogenesis imaging of blood vessels after TLR ligand stress.
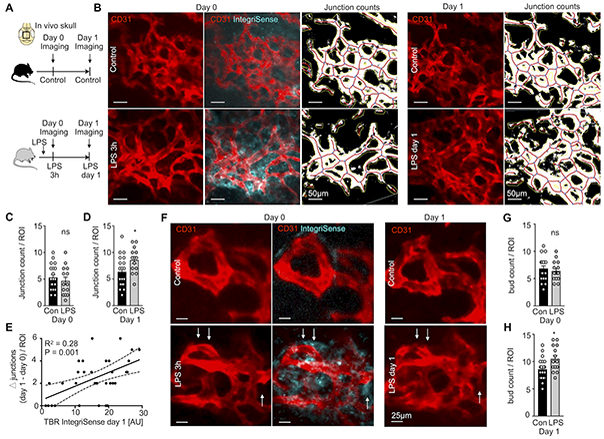
(A) Experimental outline. (B) Intravital images of IntegriSense signal at day 0 in control, 3h after LPS injection and remodeling of CD31+ vessels between day 0 and day 1. (C,D) Junction count per region of interest (ROI) at (C) day 0 and (D) day 1 after LPS injection. (E) Correlation of integrin αVβ3 activation imaging signal obtained with IntegriSense on day 0 with the change (Δ) in number of CD31+ vessel junctions between day 0 and day 1. (F) Intravital images showing IntegriSense signal at day 0 and CD31+ vessels on days 0 and 1. Note CD31+ buds on day 1 after LPS (arrows). (G,H) Bud count per ROI at (G) day 0 and (H) day 1 after LPS injection. Control mice (con; n=4) and LPS-treated mice (LPS; n=4), 2–3 z-stacks per mouse; mean ± sem; Mann-Whitney test; ns = not significant; * P<0.05.
Inflammatory stress increases vascular permeability in the bone marrow.
To investigate endothelial barrier function in the bone marrow after inflammatory stress, we pursued dynamic intravital imaging with dual modality fluorescence/MRI-detectable albumin (RhoB-albumin-GdDTPA). This large molecular blood pool agent circulates in the vasculature and extravasates if vessels are leaky. Early after injection, albumin also serves to quantify tissues’ vascular volume fraction. Quantifying the fluorescent area 5 seconds after albumin injection, we observed increased vascular density within osteoblast-surrounded hematopoietic niches in the skull (Figure 4A, Online Figure III). Afterwards, time lapse imaging over the next 2 minutes reported on vascular leakage. In LPS-treated mice, the skull vasculature displayed higher albumin signal at early and late time points (Fig 4A). Concomitantly, ex vivo epifluorescence imaging of femurs showed a similar signal increase in mice after LPS injection (Figure 4B and 4C), indicating that the observed changes are not limited to the skull marrow. In calvaria, vascular density (Figure 4D) and leakiness (Figure 4E and 4F) increased in LPS-treated mice. To correlate these imaging data to molecular signals that regulate vascular permeability, we quantified VEGF and angiopoetin-1 (ANGPT1)27 in blood and femur bone marrow. The serum and bone marrow VEGF/ANGPT1 ratios indeed increased in LPS-treated mice (Figure 4G and 4H) and, according to prior studies27, 28, likely caused the rise in vessel permeability. Each bone marrow niche has a unique vascular network. To verify that permeability before and after LPS treatment changes occur even in the same niche, we employed serial intravital imaging to revisit niches in the calvarium on 2 consecutive days. Serially imaging before and after LPS treatment confirmed that vessels become leaky 1 day after LPS treatment (Online Figure VI).
Figure 4. In vivo skull imaging of bone marrow vascular density and permeability after TLR ligand stress.
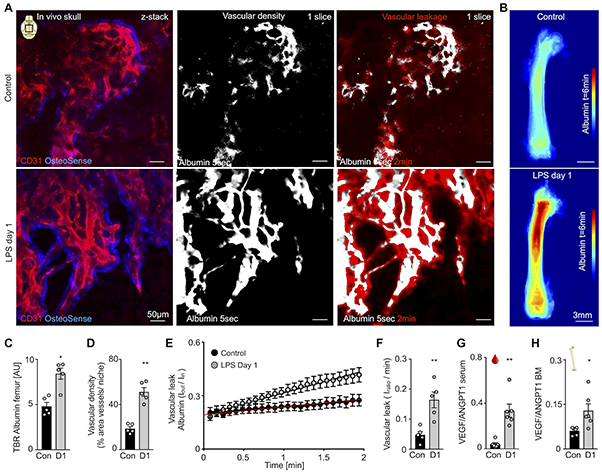
(A) CD31+ vessels in OsteoSense+ bone marrow niches of the calvarium, with images at t=5s after injection of fluorescently labeled albumin showing microvascular density and t=2min displaying vessel permeability in control and LPS-treated mice. (B) Ex vivo epifluorescent imaging of femurs 6 min after albumin injection. (C) Target-to-background (TBR) of albumin from ex vivo epifluorescence imaging. (D) Bone marrow vascular density in the calvaria. (E) Quantification of albumin leaking for time each frame. (F) Vascular leakage quantification. (G,H) VEGF/ ANGPT1 ratio of (G) blood and (H) femur bone marrow (BM). For imaging: n=5 mice per group; for VEGF/ ANGPT1 ratios: n=6 mice per group; each dot represents an individual mouse; mean ± sem; Mann-Whitney test; *P<0.05, ** P<0.01.
Bone marrow endothelial tight junctions open in response to LPS.
To assess the impaired endothelial cell barrier function after inflammatory stress with higher magnification, we studied the ultrastructure of bone marrow endothelial cells and their junctions. We began by H&E staining the femoral metaphysis, which showed more porous sinusoidal endothelium after LPS treatment (Figure 5A). We next investigated these sinusoids by electron microscopy. Normal sinusoidal endothelial cells were surrounded by a discontinuous basement membrane without an additional collagenous basement layer. These cells also contain ‘bristle-coated pits’, areas where endocytosis of macromolecules occurs29 (Figure 5B–E). After LPS treatment, sinusoidal endothelial cells exhibited cytoplasmatic vacuoles (Figure 5C and 5D), indicating an adaptive stress response, presumably to limit LPS-induced damage30. Electron-dense intercellular tight junctions connected endothelial processes in steady state (Figure 5F). After LPS injection, ultrastructural analysis revealed open junctions between endothelial processes (Figure 5F). Such open junctions explain the observed vascular leakiness (Figure 4E) and may enable exchange of cells and molecular signals between hematopoietic niches and the systemic circulation.
Figure 5. Microscopic evidence of impaired endothelial barrier function after TLR ligand stress.
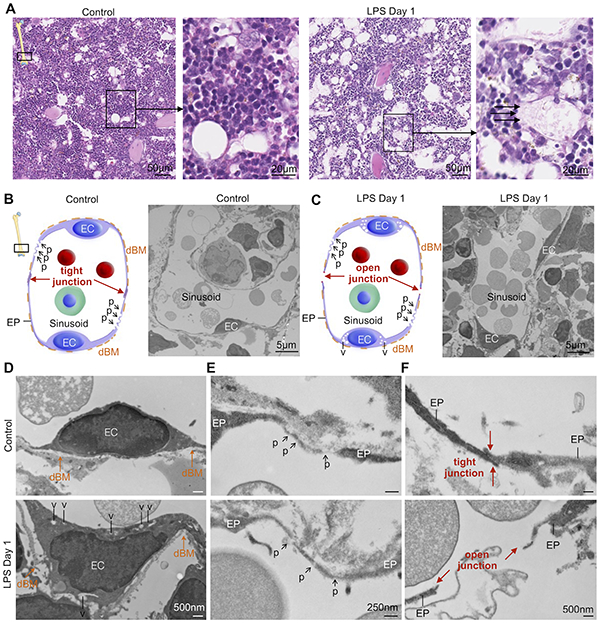
(A) H&E staining of distal metaphysis of the femur. Arrows highlight loss of endothelial barrier in LPS-treated mice. (B,C) Illustration and electron microscopy images of bone marrow sinusoids with endothelial cells (EC) surrounded by a discontinuous basement membrane (dBM) without additional collagenous basement layer in control and LPS-treated mice. (D) LPS-treated mice show sinusoid endothelial cells containing cytoplasmatic vacuoles (v). (E) So-called ‘bristle-coated pits’ (p) of sinusoids involved in endocytosis of macromolecules in control and LPS-treated mice. (F) Electron-dense intercellular tight junctions between endothelial processes (EP) in control bone marrow sinusoids, whereas after LPS sinusoidal endothelial intercellular tight junctions (red arrows) are open.
Vascular remodeling coincides with massive neutrophil egress and HSPC proliferation.
To evaluate the cellular events that occur during LPS-induced vascular remodeling, we employed serial intravital imaging to visualize neutrophils and HSPC in the calvarium (Figure 6A–D). A significant increase in circulating neutrophils occurs as early as two hours after onset of acute inflammation31. In accordance with prior reports31, we observed Ly6G+ neutrophil egress from hematopoietic niches (Figure 6B). Specifically, the area occupied by Ly6G+ neutrophils decreased after LPS challenge (Figure 6C and 6D). At the same time, adoptively transferred Lin- Sca1+ Kit+ (LSK) progenitor cells accelerated dilution of DiD membrane dye after LPS treatment, an increase that indicates faster HSPC proliferation (Figure 6E–H; Online Figure IV). This occurred in close proximity to permeable blood vessels (Figure 6H). Taken together, these data, which align with previous research15, highlight imaging’s ability to locate hematopoietic cell activity within the vascular context.
Figure 6. Imaging events in the hematopoietic niche that coincide with vascular changes after TLR ligand stress.
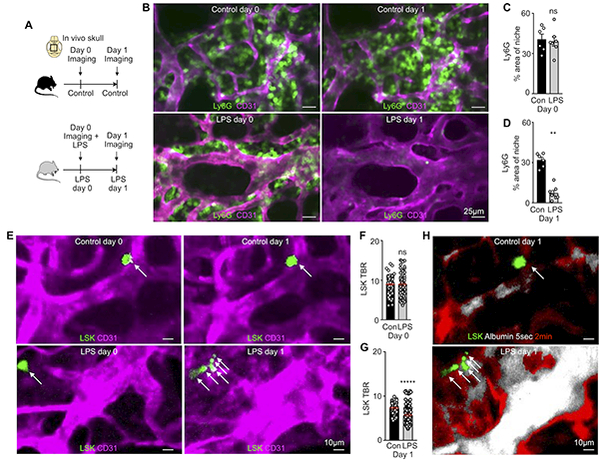
(A) Experimental outline. (B) Imaging neutrophil egress after LPS. (C,D) Percent area of Ly6G+ neutrophils in the bone marrow niche (C) before and (D) after LPS (n=3 mice and 2 z-stacks per group). (E) Serial in vivo skull imaging of Lin-Sca1+Kit- cell (LSK) proliferation (arrows) on two consecutive days. (F,G) Target-to-background ratio (TBR) of DiD+ cells (F) before and (G) after inflammatory stress. (H) Permeability imaging combined with LSK proliferation tracking, same niche as E. (n=3 mice, 3 z-stacks and 65–195 individually validated cells per group). Mean ± sem; Mann-Whitney test; ns = not significant; *P<0.05, ** P<0.01, ****P<0.0001.
PET/MRI enables noninvasive imaging of the bone marrow’s vascular response to LPS.
The microscopic imaging of angiogenic integrin αVβ3 activity and vascular permeability indicates that these are useful biomarkers; however, fluorescence imaging is less suitable for non-invasive assessment of bone marrow, which is a deep tissue. Because PET/MRI can be done in patients, and noninvasive whole mouse imaging may report on multiple sites of hematopoiesis, we explored gadolinium sensing by MRI and 68Ga isotope detection with PET. Integrin αVβ3 binds arginine-glycine-aspartic acid (RGD) sequences present on certain matrix proteins32. Therefore, synthetic RGD-containing imaging peptides are widely used to image angiogenesis, including in humans25. Adopting this strategy, which parallels IntegriSense microscopy described above, for the bone marrow, we employed 68Ga-NODAGA-RGD, an imaging agent based on the affinity peptide RGD derivatized with a chelator for efficient labeling with the radioisotope gallium-68 (Online Figure VII). The PET data were merged with MRI reporting on vascular leakage, which relied on the same imaging agent, RhoB-albumin-GdDTPA, that we used for intravital microscopy (Figure 4). This multimodal data set was acquired in one session, with 4.7 Tesla MRI following PET/CT acquisition in two separate small animal scanners33. Both data sets were co-registered offline using rigid CT and MRI bone landmarks33.
On PET/CT, we noticed increased 68Ga-NODAGA-RGD uptake within the bones of LPS-treated mice (Figure 7A and 7B). Standard T2-weighted MR images were acquired in the femoral bone marrow prior to albumin injection (Figure 7C). After LPS injection, we detected increased T2-weighted signal intensities, which indicate edema34, particularly near the distal metaphysis of the femur (Figure 7C). Intravenous injection of labeled albumin was followed by dynamic contrast enhanced MRI. In agreement with our microscopy data, MRI-derived parametric maps confirmed elevated fractional blood volume and enhanced permeability-surface area product, i.e. vascular permeability, in mice injected with LPS (Figure 7D and 7E). The increased MR permeability colocalized with areas of high 68Ga-NODAGA-RGD PET uptake on hybrid PET/MR images (Figure 7F). Analyzing in vivo PET data revealed significantly higher 68Ga-NODAGA-RGD uptake in femurs of LPS-treated mice (Figure 7G), which was corroborated by ex vivo scintillation counting (Figure 7H) and autoradiography exposure of the femur (Figure 7I). MRI provided albumin’s spatial and temporal distribution (Figure 7J). The intercept of the fit with the y-axis in Figure 7J estimates the vascular density, plotted in Figure 7K, which increased in response to LPS. The slope of the linear regression in Figure 7J indicates vascular permeability, which was higher for LPS-treated mice (Figure 7L). Taken together, noninvasive hybrid PET/MRI corroborated our microscopy data; both report a robust vascular marrow response to TLR ligand challenge.
Figure 7. Noninvasive imaging of vascular bone marrow response to TLR ligand stress.

(A,B) In vivo 3D PET/CT images of 68Ga-NODAGA-RGD uptake in control and LPS-treated mice. (C) In vivo pre-contrast T2-weighted RARE MRI. (D,E) Post-contrast parametric maps of (D) fractional blood volume (fBV) and (E) permeability*surface area product (vascular permeability) calculated from albumin-based dynamic contrast enhanced MRI in control and LPS-treated mice. (F) PET/MRI of 68Ga-NODAGA-RGD uptake combined with permeability parametric maps. (G) In vivo standardized uptake values (SUV) and (H) ex vivo percent injection dose per gram tissue (% IDGT) of 68Ga-NODAGA-RGD in control (n=10) and LPS-treated (n=13) mice. (I) Ex vivo autoradiography of 68Ga-NODAGA-RGD in control (n=4) and LPS-treated (n=4) mice. (J) Mean contrast agent accumulation in the consecutive MR images for (K) fBV (intercept at time zero) and (l) permeability (= slope) in control and LPS-treated mice. Each dot represents an individual mouse; n=5 mice per group for in vivo imaging; mean ± sem; Mann-Whitney test; *P<0.05, ** P<0.01.
DISCUSSION
In this study, we describe two advances: i) multiparametric PET/MRI is a useful tool to quantitate vascular remodeling in the hematopoietic stem cell niche; ii) applying PET/MRI, in conjunction with fluorescence microscopy, reports a previously unknown angiogenic response that accompanies emergency hematopoiesis (Figure 8). Both claims are supported by gold standard ex vivo data, including flow cytometry and histology.
Figure 8. Summary cartoon.
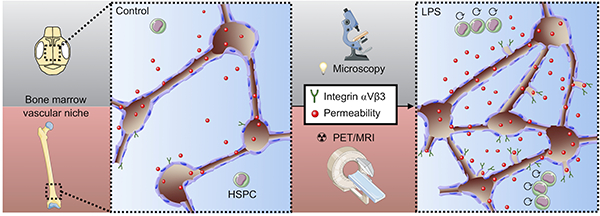
Multi-scale and multi-parametric imaging reports increased permeability and elevated integrin αVβ3 in the bone marrow vascular niches concomitant with hematopoietic stem and progenitor cell (HSPC) proliferation in response to LPS.
The vasculature is an integral component of the hematopoietic stem cell niche. Imaging has been instrumental to understanding the vasculature’s role in organizing the environment in which HSPC reside. For instance, imaging reported where HSPC replicate. Proliferating HSPC locate proximal to sinusoids, while quiescent cells reside further away4. Microscopy’s time lapse capability allowed it to describe leukocyte motion such as crawling and swarming. Despite its obvious advantages, microscopy, which is currently the only modality widely applied to image the marrow, also has inherent limitations. Since light waves scatter in bone, microscopy’s depth capacity limits current in vivo application to the mouse skull marrow and precludes clinical imaging. Thus, despite propelling fundamental hematopoiesis research, microscopy will not translate insights to humans, where we are mostly limited to bone marrow biopsies. While optical tissue clearing addresses this limitation ex vivo, in vivo microscopy is currently unable to sample hematopoiesis beyond small areas in the skull marrow. PET/MRI can overcome these hurdles, with certain trade offs that include lower spatial resolution and a limitation to fewer, in our study two, concurrent imaging targets.
Given that PET and MRI have evolved into leading molecular imaging modalities35, a multitude of imaging agents are available. In our study, we chose two imaging strategies that have been extensively studied for vascular processes outside the bone marrow17–20. Our choice was guided by vascular remodeling that may influence hematopoiesis and by these or similar agent’s detectability via fluorescence microscopy. Such multi-scale experimentation combines the advantages and overcomes the limitations of individual modalities. While microscopy provides high magnification and cellular resolution, PET and MRI provide clinical translatability and the opportunity to sample in vivo molecular processes in the entire hematopoietic marrow. Previous reports also indicate the shortcomings of both imaging agents we used. For instance, αVβ3 integrin is expressed by leukocytes and fibroblasts21, and the kinetics of blood pool agents may depend on altered hemodynamics. As imaging agent development continues, more specific options may become available in the future.
Previous data, some of which were acquired in the bone marrow, describe a cascade of events after TLR activation: first, macrophages release VEGF36, thereby stimulating angiogenesis. This process, which is regulated by integrins such as our imaging target22, gives rise to new vessels that typically appear leaky37. In the marrow, such leakiness associates with regions in which HSPC proliferate4. Activated HSPC also reside in hypoxic niches6. The increased oxygen demand of an expanding HSPC population, which proliferates at higher rates during acute inflammatory stress, may cause this hypoxia. Hypoxia is a strong stimulant of angiogenesis, and many cells, including HSPC and endothelial cells38–41, express TLR. Indicating that these processes occur in the marrow after LPS-induced emergency hematopoiesis, we observed an increased VEGF/ANGPT1 ratio, integrin activation, new vessels, elevated blood volume fraction, opening of inter-endothelial cell junctions and more vascular leakage. In the setting of TLR signaling-induced emergency hematopoiesis, these events’ directionality and causal relation remains unclear. In this study we imaged HSPC and neutrophils; however, also more differentiated progenitors and other offspring, including monocytes, macrophages and lymphocytes could be monitored in a similar fashion. The described imaging toolbox provides a template for future study of the bone marrow vasculature in chronic inflammatory and cardiovascular diseases. There are a number of important open questions, among them whether angiogenesis is a bystander event or carries consequences for leukocyte production and release. If it is functionally relevant to blood cell supply, we should explore the consequences of anti-angiogenic cancer therapy for hematopoiesis and whether targeting the bone marrow endothelium alters systemic leukocyte levels in chronic inflammatory diseases. Answering these questions and translating preclinical data to patients will rely, at least partially, on an expanded imaging tool set.
Supplementary Material
NOVELTY AND SIGNIFICANCE
What Is Known?
Lipopolysaccharides are part of the bacterial cell wall and induce acute inflammation throughout the body.
During acute inflammation, the elevated demand for leukocytes is sustained by enhanced hematopoietic stem cell proliferation and differentiation in the bone marrow.
Bone marrow endothelial cells are an important component of the hematopoietic niche, where they regulate stem cell and leukocyte activity.
What New Information Does This Article Contribute?
Bone marrow endothelial cells proliferate during acute inflammation.
Intravital microscopy follows blood vessel changes in the skull bone marrow after LPS injection, reporting on the angiogenic marker integrin αVβ3 and blood vessel permeability.
In conjunction with these vascular changes, intravital microscopy also follows neutrophil migration and hematopoietic stem cell proliferation in acute inflammation.
Translatable PET/MRI, relying on radioisotope- and gadolinium-labeled versions of the optical imaging agents used for microscopy, reports on the entire skeleton non-invasively.
The immune response initiated by lipopolysaccharides transforms the bone marrow vasculature. Multi-scale imaging revealed angiogenesis that occurs during emergency hematopoiesis. Bone marrow vasculature was imaged on a cellular level by intravital microscopy and the same targets were also followed non-invasively by translatable PET/MRI. These diagnostic tools will facilitate our understanding of vascular functions during systemic inflammation.
ACKNOWLEDGEMENTS
The authors thank the MGH Mouse Imaging Program for assistance with imaging, the Center for Skeletal Research Core (NIH P30 AR066261) for histological processing, the HSCI-CRM Flow Cytometry Core for help with flow cytometry and Kaley Joyes for editing the manuscript. Electron microscopy was performed in the Microscopy Core of the Center for Systems Biology/Program in Membrane Biology, which is partially supported by an Inflammatory Bowel Disease Grant DK043351 and a Boston Area Diabetes and Endocrinology Research Center (BADERC) Award DK057521.
SOURCES OF FUNDING
This work was funded in part by federal funds from the National Institutes of Health NS084863, HL139598, HL128264 and HL131495; the European Union’s Horizon 2020 research and innovation program under grant agreement No 667837; the Global Research Lab (GRL) program (NRF-2015K1A1A2028228) of the National Research Foundation by the Korean government; the MGH Research Scholar Program and the Deutsche Forschungsgemeinschaft (RO5071/1–1).
Nonstandard Abbreviations and Acronyms:
- 3D
three-dimensional
- ANGPT1
angiopoetin-1
- CT
X-ray computed tomography
- DiD
1,1′-dioctadecyl-3,3,3′,3′- tetramethylindodicarbocyanine perchlorate
- fBV
fractional blood volume
- HSPC
hematopoietic stem and progenitor cell
- PET
positron emission tomography
- RGD
arginine-glycine-aspartic acid
- VEGF
vascular endothelial growth factor
- VEGFR2
vascular endothelial growth factor receptor 2
Footnotes
DISCLOSURES
None.
REFERENCES
- 1.Greenbaum A, Hsu YM, Day RB, Schuettpelz LG, Christopher MJ, Borgerding JN, Nagasawa T, Link DC. CXCL12 in early mesenchymal progenitors is required for haematopoietic stem-cell maintenance. Nature. 2013;495:227–230. [DOI] [PMC free article] [PubMed] [Google Scholar]
- 2.Ding L, Saunders TL, Enikolopov G, Morrison SJ. Endothelial and perivascular cells maintain haematopoietic stem cells. Nature. 2012;481:457–462. [DOI] [PMC free article] [PubMed] [Google Scholar]
- 3.Boulais PE, Frenette PS. Making sense of hematopoietic stem cell niches. Blood. 2015;125:2621–2629. [DOI] [PMC free article] [PubMed] [Google Scholar]
- 4.Itkin T, Gur-Cohen S, Spencer JA, Schajnovitz A, Ramasamy SK, Kusumbe AP, Ledergor G, Jung Y, Milo I, Poulos MG, Kalinkovich A, Ludin A, Kollet O, Shakhar G, Butler JM, Rafii S, Adams RH, Scadden DT, Lin CP, Lapidot T. Distinct bone marrow blood vessels differentially regulate haematopoiesis. Nature. 2016;532:323–328. [DOI] [PMC free article] [PubMed] [Google Scholar]
- 5.Morrison SJ, Scadden DT. The bone marrow niche for haematopoietic stem cells. Nature. 2014;505:327–334. [DOI] [PMC free article] [PubMed] [Google Scholar]
- 6.Nombela-Arrieta C, Pivarnik G, Winkel B, Canty KJ, Harley B, Mahoney JE, Park SY, Lu J, Protopopov A, Silberstein LE. Quantitative imaging of haematopoietic stem and progenitor cell localization and hypoxic status in the bone marrow microenvironment. Nat Cell Biol. 2013;15:533–543. [DOI] [PMC free article] [PubMed] [Google Scholar]
- 7.Lo Celso C, Fleming HE, Wu JW, Zhao CX, Miake-Lye S, Fujisaki J, Côté D, Rowe DW, Lin CP, Scadden DT. Live-animal tracking of individual haematopoietic stem/progenitor cells in their niche. Nature. 2009;457:92–96. [DOI] [PMC free article] [PubMed] [Google Scholar]
- 8.Kusumbe AP, Ramasamy SK, Starsichova A, Adams RH. Sample preparation for high-resolution 3D confocal imaging of mouse skeletal tissue. Nat Protoc. 2015;10:1904–1914. [DOI] [PubMed] [Google Scholar]
- 9.Kusumbe AP, Adams RH. Osteoclast progenitors promote bone vascularization and osteogenesis. Nat Med. 2014;20:1238–1240. [DOI] [PubMed] [Google Scholar]
- 10.Gerber HP, Ferrara N. Angiogenesis and bone growth. Trends Cardiovasc Med. 2000;10:223–228. [DOI] [PubMed] [Google Scholar]
- 11.Grosso A, Burger MG, Lunger A, Schaefer DJ, Banfi A, Di Maggio N. It Takes Two to Tango: Coupling of Angiogenesis and Osteogenesis for Bone Regeneration. Front Bioeng Biotechnol. 2017;5:68. [DOI] [PMC free article] [PubMed] [Google Scholar]
- 12.Passaro D, Di Tullio A, Abarrategi A, Rouault-Pierre K, Foster K, Ariza-McNaughton L, Montaner B, Chakravarty P, Bhaw L, Diana G, Lassailly F, Gribben J, Bonnet D. Increased Vascular Permeability in the Bone Marrow Microenvironment Contributes to Disease Progression and Drug Response in Acute Myeloid Leukemia. Cancer Cell. 2017;32:324–341. e6. [DOI] [PMC free article] [PubMed] [Google Scholar]
- 13.Zhou BO, Yu H, Yue R, Zhao Z, Rios JJ, Naveiras O, Morrison SJ. Bone marrow adipocytes promote the regeneration of stem cells and haematopoiesis by secreting SCF. Nat Cell Biol. 2017;19:891–903. [DOI] [PMC free article] [PubMed] [Google Scholar]
- 14.Nagai Y, Garrett KP, Ohta S, Bahrun U, Kouro T, Akira S, Takatsu K, Kincade PW. Toll-like receptors on hematopoietic progenitor cells stimulate innate immune system replenishment. Immunity. 2006;24:801–812. [DOI] [PMC free article] [PubMed] [Google Scholar]
- 15.Yu VWC, Yusuf RZ, Oki T, Wu J, Saez B, Wang X, Cook C, Baryawno N, Ziller MJ, Lee E, Gu H, Meissner A, Lin CP, Kharchenko PV, Scadden DT. Epigenetic Memory Underlies Cell-Autonomous Heterogeneous Behavior of Hematopoietic Stem Cells. Cell. 2017;168:944–945. [DOI] [PMC free article] [PubMed] [Google Scholar]
- 16.Zudaire E, Gambardella L, Kurcz C, Vermeren S. A computational tool for quantitative analysis of vascular networks. PLoS One. 2011;6:e27385. [DOI] [PMC free article] [PubMed] [Google Scholar]
- 17.Vandoorne K, Vandsburger MH, Jacobs I, Han Y, Dafni H, Nicolay K, Strijkers GJ. Noninvasive mapping of endothelial dysfunction in myocardial ischemia by magnetic resonance imaging using an albumin-based contrast agent. NMR Biomed. 2016;29:1500–1510. [DOI] [PubMed] [Google Scholar]
- 18.Aychek T, Vandoorne K, Brenner O, Jung S, Neeman M. Quantitative analysis of intravenously administered contrast media reveals changes in vascular barrier functions in a murine colitis model. Magn Reson Med. 2011;66:235–243. [DOI] [PubMed] [Google Scholar]
- 19.Knetsch PA, Petrik M, Griessinger CM, Rangger C, Fani M, Kesenheimer C, von Guggenberg E, Pichler BJ, Virgolini I, Decristoforo C, Haubner R. [68Ga]NODAGA-RGD for imaging αvβ3 integrin expression. Eur J Nucl Med Mol Imaging. 2011;38:1303–1312. [DOI] [PubMed] [Google Scholar]
- 20.Haubner R, Finkenstedt A, Stegmayr A, Rangger C, Decristoforo C, Zoller H, Virgolini IJ. [(68)Ga]NODAGA-RGD - Metabolic stability, biodistribution, and dosimetry data from patients with hepatocellular carcinoma and liver cirrhosis. Eur J Nucl Med Mol Imaging. 2016;43:2005–2013. [DOI] [PMC free article] [PubMed] [Google Scholar]
- 21.Avraamides CJ, Garmy-Susini B, Varner JA. Integrins in angiogenesis and lymphangiogenesis. Nat Rev Cancer. 2008;8:604–617. [DOI] [PMC free article] [PubMed] [Google Scholar]
- 22.Brooks PC, Clark RA, Cheresh DA. Requirement of vascular integrin alpha v beta 3 for angiogenesis. Science. 1994;264:569–571. [DOI] [PubMed] [Google Scholar]
- 23.Weis SM, Cheresh DA. αV integrins in angiogenesis and cancer. Cold Spring Harb Perspect Med. 2011;1:a006478. [DOI] [PMC free article] [PubMed] [Google Scholar]
- 24.Felding-Habermann B, O’Toole TE, Smith JW, Fransvea E, Ruggeri ZM, Ginsberg MH, Hughes PE, Pampori N, Shattil SJ, Saven A, Mueller BM. Integrin activation controls metastasis in human breast cancer. Proc Natl Acad Sci U S A. 2001;98:1853–1858. [DOI] [PMC free article] [PubMed] [Google Scholar]
- 25.Beer AJ, Haubner R, Wolf I, Goebel M, Luderschmidt S, Niemeyer M, Grosu AL, Martinez MJ, Wester HJ, Weber WA, Schwaiger M. PET-based human dosimetry of 18F-galacto-RGD, a new radiotracer for imaging alpha v beta3 expression. J Nucl Med. 2006;47:763–769. [PubMed] [Google Scholar]
- 26.Leuschner F, Rauch PJ, Ueno T, Gorbatov R, Marinelli B, Lee WW, Dutta P, Wei Y, Robbins C, Iwamoto Y, Sena B, Chudnovskiy A, Panizzi P, Keliher E, Higgins JM, Libby P, Moskowitz MA, Pittet MJ, Swirski FK, Weissleder R, Nahrendorf M. Rapid monocyte kinetics in acute myocardial infarction are sustained by extramedullary monocytopoiesis. J Exp Med. 2012;209:123–137. [DOI] [PMC free article] [PubMed] [Google Scholar]
- 27.Thurston G, Suri C, Smith K, McClain J, Sato TN, Yancopoulos GD, McDonald DM. Leakage-resistant blood vessels in mice transgenically overexpressing angiopoietin-1. Science. 1999;286:2511–2514. [DOI] [PubMed] [Google Scholar]
- 28.Leenders GJ, Smeets MB, van den Boomen M, Berben M, Nabben M, van Strijp D, Strijkers GJ, Prompers JJ, Arslan F, Nicolay K, Vandoorne K. Statins Promote Cardiac Infarct Healing by Modulating Endothelial Barrier Function Revealed by Contrast-Enhanced Magnetic Resonance Imaging. Arterioscler Thromb Vasc Biol. 2018;38:186–194. [DOI] [PubMed] [Google Scholar]
- 29.Sarin H Physiologic upper limits of pore size of different blood capillary types and another perspective on the dual pore theory of microvascular permeability. J Angiogenes Res. 2010;2:14. [DOI] [PMC free article] [PubMed] [Google Scholar]
- 30.Henics T, Wheatley DN. Cytoplasmic vacuolation, adaptation and cell death: a view on new perspectives and features. Biol Cell. 1999;91:485–498. [DOI] [PubMed] [Google Scholar]
- 31.O’Dea KP, Wilson MR, Dokpesi JO, Wakabayashi K, Tatton L, van Rooijen N, Takata M. Mobilization and margination of bone marrow Gr-1high monocytes during subclinical endotoxemia predisposes the lungs toward acute injury. J Immunol. 2009;182:1155–1166. [DOI] [PMC free article] [PubMed] [Google Scholar]
- 32.Pytela R, Pierschbacher MD, Ruoslahti E. A 125/115-kDa cell surface receptor specific for vitronectin interacts with the arginine-glycine-aspartic acid adhesion sequence derived from fibronectin. Proc Natl Acad Sci U S A. 1985;82:5766–5770. [DOI] [PMC free article] [PubMed] [Google Scholar]
- 33.Lee WW, Marinelli B, van der Laan AM, Sena BF, Gorbatov R, Leuschner F, Dutta P, Iwamoto Y, Ueno T, Begieneman MP, Niessen HW, Piek JJ, Vinegoni C, Pittet MJ, Swirski FK, Tawakol A, Di Carli M, Weissleder R, Nahrendorf M. PET/MRI of inflammation in myocardial infarction. J Am Coll Cardiol. 2012;59:153–163. [DOI] [PMC free article] [PubMed] [Google Scholar]
- 34.Moulopoulos LA, Dimopoulos MA. Magnetic resonance imaging of the bone marrow in hematologic malignancies. Blood. 1997;90:2127–2147. [PubMed] [Google Scholar]
- 35.Nahrendorf M, Keliher E, Marinelli B, Waterman P, Feruglio PF, Fexon L, Pivovarov M, Swirski FK, Pittet MJ, Vinegoni C, Weissleder R. Hybrid PET-optical imaging using targeted probes. Proc Natl Acad Sci U S A. 2010;107:7910–7915. [DOI] [PMC free article] [PubMed] [Google Scholar]
- 36.Pinhal-Enfield G, Ramanathan M, Hasko G, Vogel SN, Salzman AL, Boons GJ, Leibovich SJ. An angiogenic switch in macrophages involving synergy between Toll-like receptors 2, 4, 7, and 9 and adenosine A(2A) receptors. Am J Pathol. 2003;163:711–721. [DOI] [PMC free article] [PubMed] [Google Scholar]
- 37.Carmeliet P, Jain RK. Angiogenesis in cancer and other diseases. Nature. 2000;407:249–257. [DOI] [PubMed] [Google Scholar]
- 38.Fan J, Frey RS, Malik AB. TLR4 signaling induces TLR2 expression in endothelial cells via neutrophil NADPH oxidase. J Clin Invest. 2003;112:1234–1243. [DOI] [PMC free article] [PubMed] [Google Scholar]
- 39.Li X, Tupper JC, Bannerman DD, Winn RK, Rhodes CJ, Harlan JM. Phosphoinositide 3 kinase mediates Toll-like receptor 4-induced activation of NF-kappa B in endothelial cells. Infect Immun. 2003;71:4414–4420. [DOI] [PMC free article] [PubMed] [Google Scholar]
- 40.Faure E, Equils O, Sieling PA, Thomas L, Zhang FX, Kirschning CJ, Polentarutti N, Muzio M, Arditi M. Bacterial lipopolysaccharide activates NF-kappaB through toll-like receptor 4 (TLR-4) in cultured human dermal endothelial cells. Differential expression of TLR-4 and TLR-2 in endothelial cells. J Biol Chem. 2000;275:11058–11063. [DOI] [PubMed] [Google Scholar]
- 41.Kang S, Lee SP, Kim KE, Kim HZ, Mémet S, Koh GY. Toll-like receptor 4 in lymphatic endothelial cells contributes to LPS-induced lymphangiogenesis by chemotactic recruitment of macrophages. Blood. 2009;113:2605–2613. [DOI] [PubMed] [Google Scholar]
Associated Data
This section collects any data citations, data availability statements, or supplementary materials included in this article.