

Abstract
Objective:
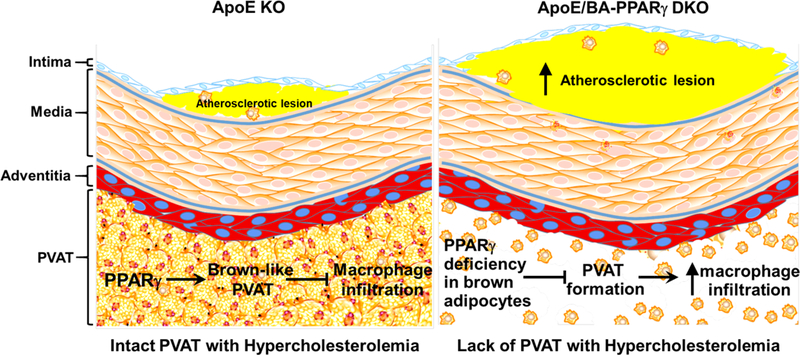
Perivascular adipose tissue (PVAT) contributes to vascular homeostasis by producing paracrine factors. Previously, we reported that selective deletion of peroxisome proliferator-activated receptor gamma (PPARγ) in vascular smooth muscle cells (VSMCs) resulted in concurrent loss of PVAT and enhanced atherosclerosis in mice. To address the causal relationship between loss of PVAT and atherosclerosis, we used brown adipocyte-specific PPARγ knockout (BA-PPARγ-KO) mice.
Approach and Results:
Deletion of PPARγ in brown adipocytes did not affect PPARγ in white adipocytes or VSMCs or PPARα and PPARδ expression in brown adipocytes. However, development of PVAT and interscapular BAT were remarkably impaired, associated with reduced expression of genes encoding lipogenic enzymes in the BA-PPARγ-KO mice. Thermogenesis in BAT was significantly impaired with reduced expression of thermogenesis genes in BAT and compensatory increase in expression of thermogenesis genes in subcutaneous and gonadal white adipose tissues. Remarkably,basal expression of inflammatory genes and macrophage infiltration in PVAT and BAT were significantly increased in the BA-PPARγ-KO mice. BA-PPARγ-KO mice were cross-bred with ApoE KO mice to investigate the development of atherosclerosis. FACS analysis confirmed increased systemic and PVAT inflammation. Consequently, atherosclerotic lesions were significantly increased in mice with impaired PVAT development, thus indicating that the lack of normal PVAT is sufficient to drive increased atherosclerosis.
Conclusion:
PPARγ is required for functional PVAT development. PPARγ deficiency in PVAT, while still expressed in VSMC, enhances atherosclerosis and results in vascular and systemic inflammation, providing new insights on the specific roles of PVAT in atherosclerosis and cardiovascular disease at large.
Keywords: PPARγ, perivascular adipose tissue, brown adipose tissue, atherosclerosis
Graphical Abstract
Introduction
Perivascular adipose tissue (PVAT) is defined as adipose tissue surrounding the blood vessels. PVAT in rodents is similar to classical brown adipose tissue (BAT)1 while human PVAT might be beige adipose tissue (BeAT)2. BeAT, presenting characteristics of both white adipose tissue (WAT) and BAT, contains uncoupling protein-1 (UCP-1) positive adipocytes. The intrinsic common characteristic of energy expenditure of both BAT and BeAT highlights their potential as targets in prevention of obesity and related cardiovascular diseases (CVDs). The roles of PVAT on atherosclerosis remain unclear. We previously reported that thermogenesis is one major physiological function of PVAT in response to cold stimuli1 and that enhanced PVAT-dependent thermogenesis protects against atherosclerosis in mice3. Conversely, proinflammatory cytokines such as IL-6, IL-8 and MCP-1 are significantly increased in PVAT of human coronary arteries of obese individuals when compared to other adipose depots4. A recent image-based study revealed a paracrine crosstalk between PVAT and the rest of the underlying blood vessel layers in humans5. Recent clinical studies further support that PVAT is a source of various inflammatory mediators in cardiovascular diseases, including coronary artery spasm6, metabolic syndrome7 and atherosclerosis8, 9. For example, in coronary heart disease patients the coronary PVAT showed higher expression of IL-1β, IL-6 and leptin compared to the PVAT of the internal thoracic artery devoid of atherosclerotic lesions10. Those changes were associated with reduced endothelial function11, suggesting that PVAT promotes atherosclerosis development through local production of inflammatory cytokines. Those data from clinical studies suggest that PVAT inflammation might contribute to atherosclerosis development.
We previously demonstrated enhanced atherosclerosis in a unique mouse model lacking PVAT as a result of deletion of the peroxisome proliferator-activated receptor γ (PPARγ) in vascular smooth muscle cells (VSMCs) driven by SM22α-knockin-Cre1. However, that model did not allow to distinguish whether the increased susceptibility to atherosclerosis was due to deletion of PPARγ in vascular smooth muscle cells (VSMCs) or the ensuing lack of functional PVAT. More selective UCP1-cre driven “Brown (and Beige) adipocyte”-specific knockout models were developed to overcome those hurdles and allowed us to dissect the roles in PVAT of specific genes relevant to CVD12. In this study, we used newly generated brown adipocyte-specific PPARγ knockout (BA-PPARγ-KO) mice to address the specific contribution of PVAT to atherosclerosis development. PPARγ ablation in brown adipocytes dramatically inhibited development of PVAT and interscapular BAT (iBAT) without affecting WAT development or PPARγ expression in VSMCs. Using this new model, we demonstrated that loss of functional PVAT promotes macrophage infiltration to the periphery of the blood vessels and increases atherosclerosis development, suggesting a causative role for PVAT in atherosclerosis.
Materials and Methods
The data and materials have been made publicly available from the corresponding author upon reasonable request. The authors declare that all supporting data are available within the article and its online supplementary files. Details for major experimental resources can be found in the Major Resources Table in the online-only Data Supplement.
Animal procedures
Mice carrying Brown adipocyte-specific deletion of PPARγ (BA-PPARγ-KO) were generated by crossbreeding PPARγ flox/flox with UCP-1-driven Cre mice13 (all in the C57BL/6 background). Mice were housed at the University of Michigan animal facility (22°C and 12/12-hour light/dark cycle) and supplied with rodent diet no. 2918 (18% protein, 6% fat and moderate phytoestrogen; Harlan Laboratories) ad libitum. The Animal Research Ethics Committee of the University of Michigan approved the study protocol. iBAT temperature was monitored by a T-type thermocouple probe inserted into the interscapular BAT in mice under anesthesia (isoflurane inhalation) in response to immersion of the tail and hind paws in a 4°C water bath, as described before1. For surgical removal of the iBAT, mice were anesthetized by isoflurane inhalation and the procedure was performed as described previously1. Briefly, after removal of the subscapular hair, a 1 cm long incision along the midline skin was made to expose the iBAT, which was completely removed from the interscapular trigonal pyramidal region using an electric cauterizer. This procedure permanently destroys the remaining brown adipocytes and prevents BAT from growing back (Supplemental Figure II). Subcutaneous injection of 0.1mg/kg buprenorphine for 3 consecutive days was used as analgesic. To study atherosclerosis, BA-PPARγ-KO mice were crossed with apolipoprotein E knockout mice (ApoE KO) to generate the double KO (ApoE/BA-PPARγ DKO). The offspring were genotyped by PCR analysis of DNA obtained from tail-snip biopsies using specific primers. We selected two groups of mice for this study: 1) ApoE KO mice and 2) ApoE/BA-PPARγ DKO. All experiments were conducted using 8-week-old male or female mice and the numbers used are indicated in the corresponding figure legends. We present data from male mice in the main figures. When female mice were use in the supplemental figures, that is specified in the legend. For the atherosclerosis study, the mice were fed a high cholesterol diet (Harlan, TD.88137) for 2 or 3 months. At the endpoint, the mice were sacrificed by CO2 inhalation. The plasma was preserved at −80oC for cytokine analysis and plasma lipid and lipoprotein profiling1. Oil Red O staining was used for en face analysis of atherosclerotic plaques in the aortic trees1. After removal of the perivascular tissue, the aortas were opened longitudinally and pinned flat onto a wax plate. The percentage of the plaque area in the thoracic (including aortic arch) and abdominal aorta relative to the thoracic or abdominal luminal surface areas were calculated by an image software (Meta Imaging Series 7.0, Molecular Devices, LLC). The extent of atherosclerotic lesions in the aortic sinus region was determined following the guidelines for experimental atherosclerosis studies described in the American Heart Association Statement14. The atherosclerotic lesion area at the 3 valve leaflets was quantified by using NIH ImageJ analysis software. All morphometric analyses were performed in a double-blinded manner.
Isolation of leukocytes from PVAT and flow cytometry analysis
Dissection of PVAT and subsequent recovery of leukocytes was achieved by collagenase digestion following a well-established protocol15. Factors such as the duration of collagenase exposure were determined empirically and restricted to 45 minutes or less. Isolated cells were additionally incubated with ACK lysing buffer (154.4mM ammonium chloride, 10mM potassium bicarbonate and 97.3μM EDTA) for 15 min to lyse the remaining red blood cells in PVAT. Leukocyte numbers and differential counts were performed using flow cytometry analysis as previously described16. Isolated PVAT leukocytes were incubated with anti-mouse CD16/32 antibody (clone 2.4G2, Tonbo Bioscience, San Diego, CA, USA) (0.5 μg per 106 cells) for 5 min to block FcγRII/III receptors and then incubated (30 min, 4°C) with PE anti-CD11b antibody (0.5 μg per 106 cells, clone: M1/70, Tonbo Bioscience), PE-Cy7 anti-Ly-6C antibody (0.5 μg per 106 cells, clone: AL-21, BD Biosciences), PerCP-Cy5.5 Anti-Mouse F4/80 antibody (0.5 μg per 106 cells, clone BM8.1, Tonbo Bioscience), APC anti-mouse CD4 antibody (0.5 μg per 106 cells, Biolegend) and Anti-CD19 Antibody (1 μg per 106 cells, FITC Conjugated, Clone 1D3, BD Bioscience), to determine leukocyte sub-types. After washing, cells were incubated with 2.5 μg/mL DAPI to exclude dead or dying cells. Compensation was performed using single color controls prepared from UltraComp eBeads (eBioscience, San Diego, CA, USA). Gating strategy, including live/death cell discrimination and sizing analysis, is depicted in Supplemental Figure III. Flow cytometry data were collected on a Cyan 5 flow cytometer (Beckman Coulter) and analyzed with FloJo software (Tree Star). Immune cell subsets were characterized as follows: T cells (CD11b-, CD4+), B cells (CD19+) and myeloid cells (CD11b+, CD4-, CD19-), including monocytes (F4/80int, Ly-6C+) and macrophages (F4/80high).
Lipoprotein and lipid analysis
Plasma lipoprotein profiles were determined by fast-performance liquid chromatography (FPLC) as previously described17. Briefly, 80 μl of plasma were loaded and eluted at a constant flow rate of 0.5 ml/minute. Thirty fractions per sample were collected. Sample elution was monitored by optical density at 280 nm. The cholesterol contents in each fraction was measured with a cholesterol fluorometric assay kit (Catalog No. 10007640, Cayman Chemical). For liver lipid analysis, the livers were rapidly removed from the euthanized mice and kept at −80°C. The frozen liver samples (approximately 100 mg) were homogenized in PBS and the homogenates were then centrifuged (14,000 RPM, 20 min). The supernatants were collected and analyzed for protein levels using the Bio-Rad Bradford assay (Hercules, CA, USA). To assess the liver lipid composition, lipids were extracted from the supernatants with hexane:isopropanol (Sigma Aldrich, St. Louis, MO,USA, 3:2, v:v), and the hexane phase was allowed to evaporate for 48 h. Spectrophotometric determination of the amounts of liver cholesterol or triglycerides was performed using commercially available kits (Wako Chemicals, Japan). Data were normalized to protein levels and are presented as μg cholesterol or triglycerides / mg protein18. Plasma total cholesterol and triglycerides were determined using the same kits (Wako Chemicals, Japan).
qRT-PCR and Western blot analysis
Total RNA was isolated from the adipose tissues using TRIzol reagents (Invitrogen). The mRNA levels were measured by QRT-PCR using a Bio-Rad thermocycler and a SYBR green kit (Bio-Rad)3. Western blot analyses were performed as previously described3. Rabbit anti UCP-1 (0.5μg/ml, Sigma Cat#U6382), rabbit anti PRDM16 (0.2μg/ml, R&D Cat#AF6295) and anti-PPARγ (0.8μg/ml, Santa Cruz Cat# sc-7196) were used in this study. Mouse primers and antibodies used in this study are listed in the Major Resources Table in the on line Supplement.
Histological analysis
Adipose tissues were fixed overnight with 4% paraformaldehyde (pH 8.0). After dehydration, the samples were embedded in paraffin wax according to standard laboratory procedures. Sections of 5 μm were stained with H&E or the macrophage marker F4/80 (2.5μg/ml, clone CI:A3–1, BIO-RAD).
Statistical Analysis
GraphPad Prism software version 7.0 was used to analyze the data. Data are shown as mean ± SD or Column Box & whiskers Plot. The data were first analyzed for normal distribution and then evaluated with a 2-tailed, unpaired Student’s t-test between two groups, or one-way ANOVA followed by a Newman-Keuls test or two-way ANOVA and multiple comparisons for repeated measures. A value of p<0.05 was considered statistically significant.
Results
Brown adipocyte-specific PPARγ deletion results in impaired development of PVAT and iBAT
Prior studies indicated that the thoracic PVAT in mice is almost identical to iBAT1, 19. Therefore, we used brown adipocyte specific UCP-1-Cre to delete PPARγ in brown adipocytes. As shown in Figure 1A, PPARγ protein is detectable in PVAT, WAT and iBAT of wild-type mice. In the BA-PPARγ KO mice, PPARγ is undetectable in PVAT and iBAT without changes in expression in subcutaneous WAT or in the aorta stripped from PVAT, where the levels are intrinsically lower. Deletion of PPARγ in brown adipocytes did not affect PPARα and PPARδ expression (Figure 1B). Since Ucp-1 is not expressed in white adipocytes, PPARγ mRNA levels in subcutaneous WAT (sWAT) and gonadal WAT (gWAT) were comparable between wild-type and BA-PPARγ KO mice (Supplemental Figure I A), in spite of sWAT being recognized as a beige adipose tissue with a small fraction of UCP1-positive cells upon cold stimuli2. Since PPARγ is a key transcription factor controlling adipocyte differentiation, brown adipocyte differentiation in thoracic PVAT and iBAT in the BA-PPARγ KO mice was significantly inhibited. Compared to the wild-type mice, only remnants of PVAT or iBAT were found in the thoracic aorta and interscapular regions, respectively (Figure 1C). Specifically, only a thin layer of tissue comprised of cells morphologically distinct from adipocytes remains surrounding the artery. Indeed, H&E staining of sections of thoracic PVAT or iBAT uncovered absence of normal classical brown adipocytes -characterized by small and multilocular lipid droplets. Instead fibrous-like tissues with large numbers of non-adipocytes are observed in PVAT and iBAT (Figure 1D). Consistently, the mRNA levels of the adipocyte marker genes fatty acid binding protein 4 (Fabp4) and adiponectin were significantly reduced, whereas the lipolysis genes lipoprotein lipase (LPL) and adipose triglyceride lipase (ATGL) were not significantly altered in PVAT and iBAT of BA-PPARγ-KO mice (Figure 2), probably reflecting preservation of the white adipocyte fraction normally present in BAT. Additionally, since PPARγ expression is preserved in WAT of BA-PPARγ-KO mice, the WAT appears normal (Supplemental Figure I B), and consequently, the expression of adipocyte marker genes and lipolysis genes were comparable in subcutaneous and gonadal WAT between wild-type and BA-PPARγ-KO mice (Figure 2).
Figure 1. Characterization of BA-PPARγ-KO mice.
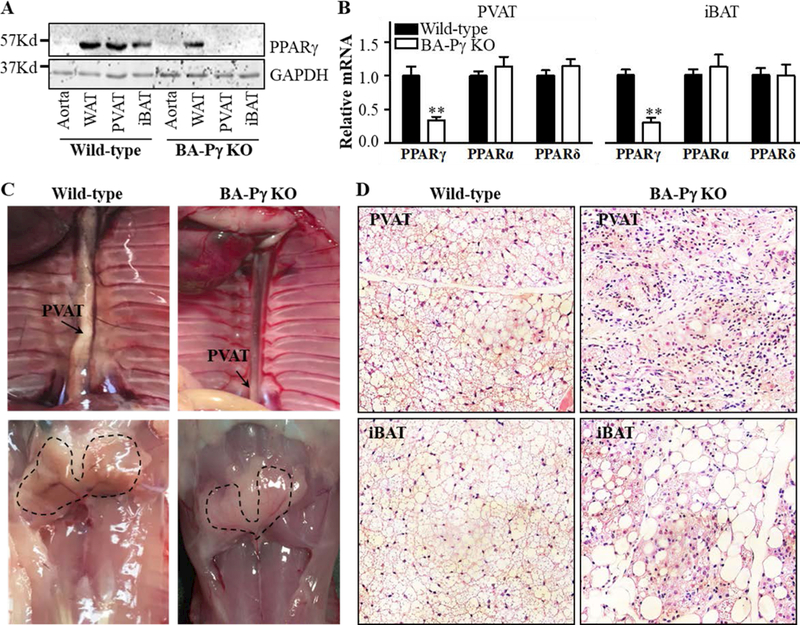
(A)Western blot analysis of PPARγ protein levels in the aorta -devoid of PVAT-, subcutaneous WAT, PVAT and interscapular BAT (iBAT) of wild-type and brown adipocyte specific PPARγ knockout (BA-PPARγ-KO) mice. (B). PPARγ, PPARα, and PPARδ mRNA expression levels in iBAT and PVAT of wild-type and BA-PPARγ KO mice. The mRNA levels are normalized relative to 18S. Data are shown as mean ± SD. n=5 mice/group. Student t-test, **p<0.01 vs wild-type. (C) Representative images of the dorsal thoracic cavity and the interscapular region showing lack of PVAT development around the thoracic blood vessels (upper panel) and lack of iBAT in the interscapular region (lower panel, dashed outline indicates the expected anatomical location of iBAT) in the BA-PPARγ-KO mice. (D) Histological H&E staining showing abnormal adipocyte structures in the ‘remnants’ of thoracic PVAT (upper panel) and iBAT (lower panel) isolated from BA-PPARγ-KO mice. 40x magnification.
Figure 2. Impaired expression of adipogenic genes in iBAT upon PPARγ deletion in brown adipocytes.
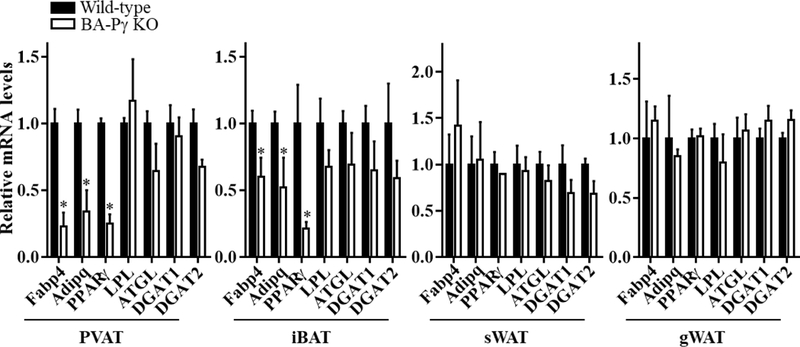
mRNA levels of the adipogenic genes fatty acid binding protein 4 (Fabp4), adiponectin (AdipoQ), peroxisome proliferator-activated receptor gamma (PPARγ) and lipolysis genes lipoprotein lipase (LPL), adipocyte triglyceride lipase (ATGL), diglyceride acyltransferase 1 (DGAT1), and diglyceride acyltransferase 2 (DGAT2) in PVAT, interscapular BAT (iBAT), subcutaneous WAT (sWAT) and gonadal WAT (gWAT) The mRNA levels were normalized relative to 18S and the level in wild-type mice is set as 1. Data are shown as mean ± SD. n=5 mice/group. Student t-test between two groups for each gene, *p<0.05 vs wild-type.
Brown adipocyte-specific PPARγ deletion results in impaired thermogenesis in BAT
Next, we determined the mRNA levels of thermogenic genes in PVAT and iBAT of BA-PPARγ-KO mice. When compared to wild-type mice, thermogenic genes such as uncoupling protein-1 (Ucp-1), cell death activator CIDE-A (Cidea), cytochrome c oxidase subunit 8B (Cox8b), elongation of very long chain fatty acids protein 3 (Elovl3) and otopetrin 1 (Otop1) were significantly downregulated in PVAT and iBAT in the BA-PPARγ-KO mice (Figure 3A). However, those genes are increased in subcutaneous and gonadal WAT, likely as a compensatory mechanism. PR/SET domain 16 (Prdm16), a brown adipocyte determinant, was downregulated in PVAT, iBAT and sWAT, but was not changed in gWAT. Dio2 is traditionally thought to be a thermogenic gene. However, Dio2 mRNA level is increased only in the iBAT, but not in the PVAT, sWAT and gWAT of the BA-PPARγ-KO mice. Other beige adipocyte markers such as early B cell factor 2 (Ebf2), Cbp/P300 interacting transactivator with Glu/Asp rich carboxyl-terminal domain (Cited) and TATA-Box binding protein (Tbp) remained unchanged in all adipose tissues (Figure 3A). Consistent with reduced expression of thermogenic genes in iBAT, the UCP1 and PRDM16 proteins were significantly reduced in iBAT of BA-PPARγ-KO mice as well (Figure 3B). We determined the temperature changes in the BAT region by cold stimulation of the hind paws and tail1, 3. In response to acute cold stimuli, the temperature in iBAT of wild-type mice was immediately increased, an indication of heat production in BAT1. The temperature in the iBAT region of BA-PPARγ-KO mice was increased by less than 29.76%± 12.2% of the wild-type levels at the end point, being significantly lower that wild-type throughout the 90 seconds of the acute cold stimuli, indicating impaired thermogenesis in the mice lacking functional BAT (Figure 3C). These data demonstrate that deletion of PPARγ in brown adipocytes leads to lack of functional PVAT and BAT development.
Figure 3. Reduced expression of thermogenic genes in PVAT and iBAT upon PPARγ deletion in brown adipocytes.
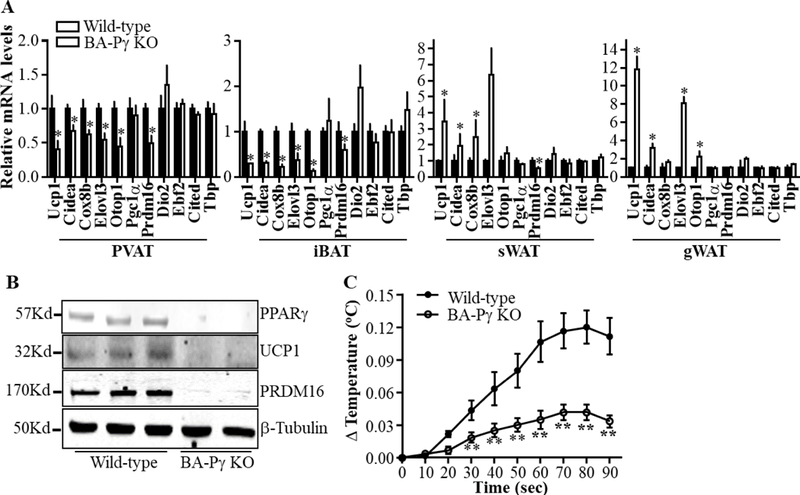
(A). mRNA profile of genes related to thermogenesis in PVAT, interscapular BAT (iBAT), subcutaneous WAT (sWAT) and gonadal WAT (gWAT). The mRNA level was normalized by 18S, with the level in wild-type mice set at 1. Data are shown as mean ± SD. n=5 mice/group. Student t-test between two groups for each gene, *p<0.05 vs wild-type. (B). Protein levels of uncoupling protein 1 (UCP1) and PR/SET Domain 16 (PRDM16) in iBAT of wild-type and BA-PPARγ-KO mice. (C). Temperature change (ΔTemperature) in iBAT in response to acute cold stimuli to the hind paws and tail of wild-type and BA-PPARγ-KO mice. Data are shown as mean ± SD. n=6 mice/group. Statistical analysis was performed by multiple comparisons with repeated measures after two-way ANOVA,**p<0.01 vs wild-type.
Brown adipocyte-specific PPARγ deletion results in increased local inflammation
We further addressed inflammation in PVAT and iBAT of BA-PPARγ-KO mice. As shown in Figure 4A, the mRNA levels of IL-1β, MCP-1 and TNFα were significantly increased in PVAT and iBAT of BA-PPARγ-KO mice when compared to those of wild-type mice, while remaining unaltered in subcutaneous and gonadal WAT. Immunohistochemical staining for the macrophage marker F4/80 indicated that macrophage infiltration was significantly increased in both thoracic PVAT and iBAT of BA-PPARγ-KO mice, with no significant differences in subcutaneous and gonadal WAT between wild-type and BA-PPARγ-KO mice (Figure 4B). These results indicate that deletion of PPARγ in brown adipocytes, which efficiently blocked brown adipocyte differentiation, results in infiltration of macrophage and higher basal inflammation in the PVAT and iBAT regions while showing no effects in WAT.
Figure 4. Increased inflammation in PVAT and iBAT upon PPARγ deletion in brown adipocytes.
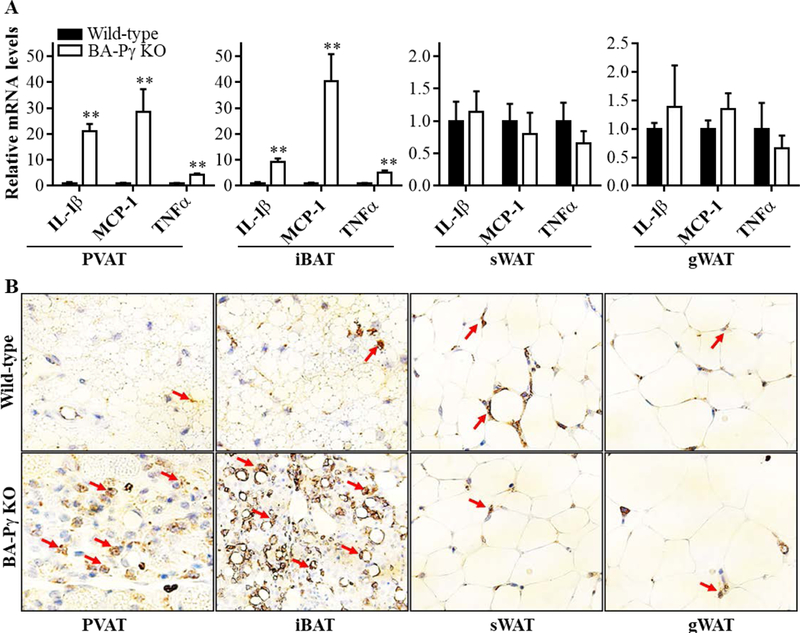
(A). mRNA levels of the inflammatory genes IL-1β, MCP-1and TNFα in PVAT, interscapular BAT (iBAT), subcutaneous WAT (sWAT) and gonadal WAT (gWAT). The mRNA levels were normalized by 18S, and are presented relative to the levels in the wild-type control mice set as 1. Data shown as mean ± SD. n=5 mice/group. Student t-test between two groups for each gene, **p<0.01 vs wild-type. (B). Immunohistological staining for the macrophage marker F4/80 in PVAT, iBAT, sWAT, and gWAT of wild-type and BA-PPARγ-KO mice. Red arrows indicate examples of positive staining for F4/80. 40x magnification.
Brown adipocyte-specific PPARγ deletion results in increased atherosclerosis development
To investigate the pathophysiological consequences of lack of PVAT on atherosclerosis, the BA-PPARγ-KO mice were crossbred with ApoE KO mice to generate the double KO mice (ApoE/BA-PPARγ DKO). To exclude any potential effects of iBAT on atherosclerosis development, the iBAT in ApoE KO mice and its remnants in the ApoE/BA-PPARγ DKO mice were surgically removed from 7-week old mice. After 1-week of recovery, the mice were fed a high cholesterol diet for 3 months. As shown in Figure 5A and supplemental Figure III, the atherosclerotic lesions were significantly greater in both male and female ApoE/BA-PPARγ DKO than that in the corresponding ApoE KO control mice (male: 29.3% ± 5.9% vs 19.8% ± 4.2% in thoracic aorta, and 6.7% ± 2.1% vs 2.2% ± 1.6% in abdominal aorta; female: 25.8% ± 7.6% vs 16.4% ± 4.2% in thoracic aorta, and 10.1% ± 3.5% vs 2.3% ± 1.7% in abdominal aorta). The area of atherosclerotic lesions in the aortic root region in ApoE/BA-PPARγ DKO mice was about 70% higher than that of ApoE KO mice (Figure 5B). The increase in body weight was comparable between the 2 groups, independent of sex (data not shown). Analysis of plasma lipoprotein profiles indicated that the VLDL and LDL fractions, but not HDL, were elevated in the ApoE/BA-PPARγ DKO (Figure 5C), likely as a result of increased production of cholesterol and triglycerides in the liver (Supplemental Figure IV A and B). Unlike WAT, mostly involved in lipid storage, BAT contributes to the clearance of plasma lipids and protects against atherosclerosis development20. Surgical removal of iBAT in ApoE KO mice significantly increased plasma TC and TG levels. However, TC levels were still relatively higher in the plasma in ApoE/BA-PPARγ DKO without iBAT (Supplemental Figure V A). Additionally, it is possible that BAT removal in ApoE KO mice could promote WAT “browning”. However, expression of thermogenesis genes such as Ucp1, Cox8b and Pgc1α in WAT were comparable between the ApoE KO (with iBAT removal) and ApoE/BA-PPARγ DKO mice when the mice were housed in a 22oC environment for 2 months. Also, the body temperature of these mice were comparable (Supplemental Figure V B and C).
Figure 5. Enhanced atherosclerosis in ApoE/BA-PPARγ DKO mice.
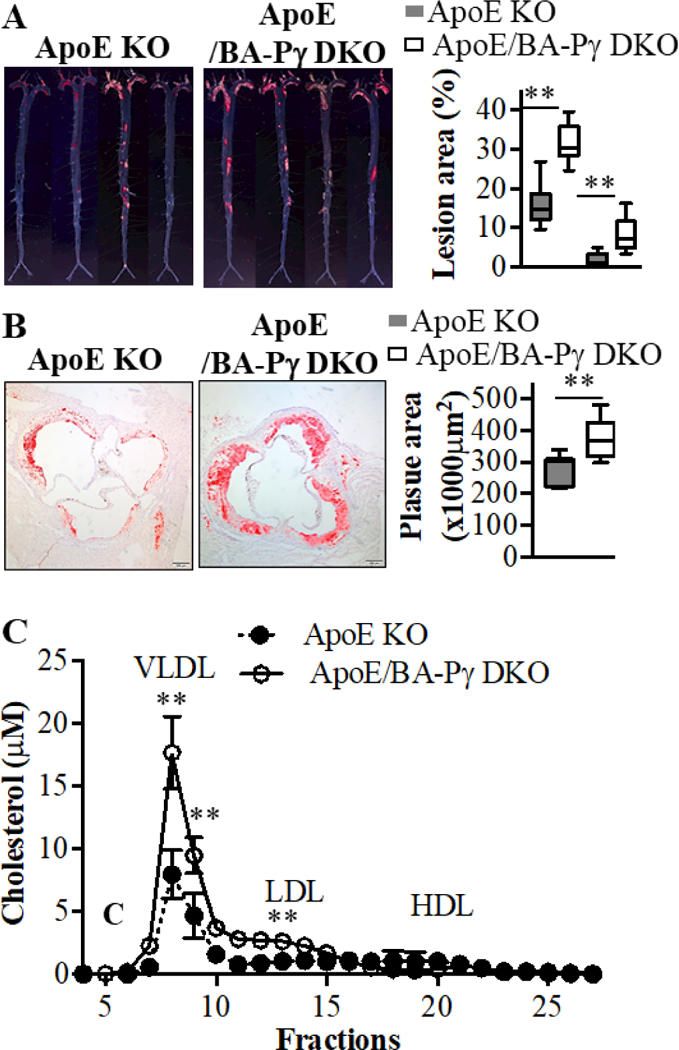
Eight-weeks-old male ApoE KO and ApoE/BA-PPARγ DKO mice were fed a high cholesterol diet for 3 months. (A). Representative en face Oil Red O staining showing atherosclerotic lesions in the whole aortic trees (left) in ApoE and ApoE/BA-PPARγ DKO mice. Quantitative analysis of the ratio of en face atherosclerotic lesion area in the thoracic aorta (TA) and abdominal aorta (AA). n=12 in the ApoE KO group, n=10 in the ApoE/BA-PPARγ DKO group. Student t-test for TA and AA, respectively, **p<0.01 vs ApoE KO. (B). Representative Oil Red O staining showing atherosclerotic lesions in the aortic root (left) and corresponding quantitative analysis (right). n=12 in ApoE KO group, n=10 in ApoE/BA-PPARγ DKO group. Student t-test, **p<0.01 vs ApoE KO. (C). Plasma lipid profile from ApoE KO or ApoE/BA-PPARγ DKO mice was analyzed by FPLC (fractions 1 to 30) and the cholesterol levels in each fraction were measured with a cholesterol fluorometric assay kit. Plasma from 12 ApoE KO and 10 ApoE/BA-PPARγ DKO mice were pooled into 3 samples, respectively. Data shown as mean ± SD. Student t-test, *p<0.05 vs ApoE KO, **p<0.01 vs ApoE KO.
Notably, when considering the suprarenal abdominal aortic area, almost all of the ApoE/BA-PPARγ DKO mice showed atherosclerotic lesions. However, there were only sporadic atherosclerotic lesions observed in ApoE KO mice in that region. According to the guidelines for experimental atherosclerosis studies described in the American Heart Association Statement, measurement of the surface area of atherosclerotic lesions only provides a 2-dimensional surface area without taking into account the thickness of lesions14. As shown in Figure 6A, the cross-sections confirmed the existence of more advanced atherosclerotic lesions in thoracic and suprarenal abdominal aorta from the ApoE/BA-PPARγ DKO mice compared to the ApoE KO mice. Consistent with the increased macrophage infiltration observed in PVAT of the BA-PPARγ KO mice (Figure 4), we found increased F4/80 positive macrophages in PVAT of plaque areas –both thoracic and abdominal- in the ApoE/BA-PPARγ DKO mice compared with the ApoE KO mice (Figure 6A). To investigate whether the PVAT of ApoE/BA-PPARγ DKO were inflammatory, the immune cells present in PVAT were characterized by FACS (Supplemental Figure VI). The percentages of B cells and T cells were comparable in PVAT between ApoE KO and ApoE/BA-PPARγ DKO mice. However, the percentage of myeloid cells (CD11b+, CD4-, CD19-), especially macrophages (F4/80high), were significantly higher in PVAT of ApoE/BA-PPARγ DKO mice (Figure 6B). The mRNA levels (Figure 6C) of IL-6, TNFα and MCP-1 in the remnants of PVAT of ApoE/BA-PPARγ DKO mice compared with PVAT of ApoE KO mice were increased as were the corresponding cytokines in the conditioned medium of the same cells in vitro (Figure 6D). Abdominal PVAT is beige fat which is a mixture of WAT and BAT. However, similarly to the thoracic PVAT, the brown adipocyte markers were reduced, whereas the inflammatory markers MCP-1 and TNFα were increased in abdominal PVAT of ApoE/BA-PPARγ DKO mice (Figure 6E), suggesting that loss of brown adipocytes in abdominal PVAT was also associated with PVAT inflammation. Thus, these data clearly demonstrate that lack of PVAT development resulted in perivascular inflammation and enhanced the atherosclerosis development.
Figure 6. PVAT inflammation in ApoE/BA-PPARγ DKO mice.
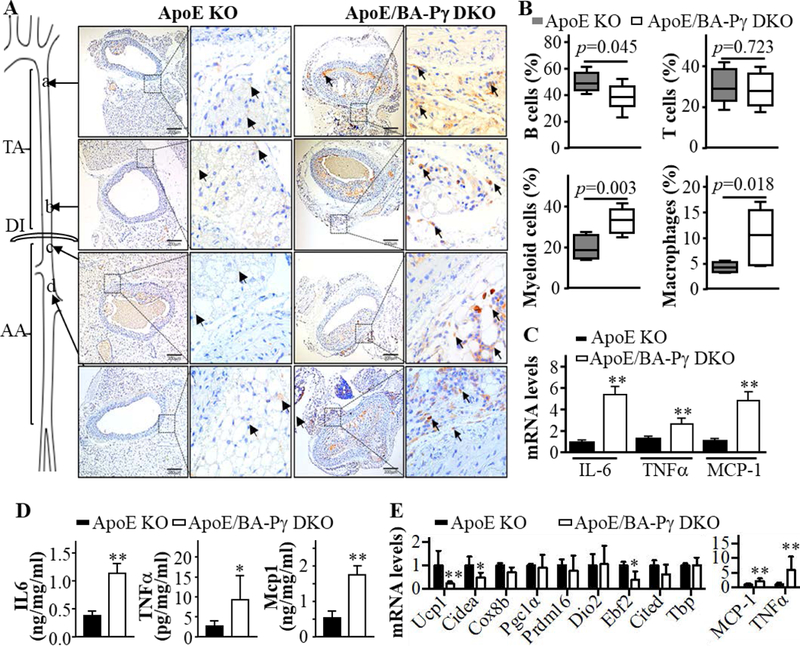
(A) Representative macrophage marker F4/80 immunohistochemistry (indicated by arrows) showing macrophage infiltration in the PVAT region of atheroprone areas of the upper thoracic aorta (a), lower thoracic aorta (b) and suprarenal abdominal aorta (c and d). Bars indicate 200 μm. (B) Flow cytometry analysis of inflammatory cells in the PVAT of ApoE KO (ApoE KO) and ApoE/BA-PPARγ DKO mice fed a high cholesterol diet for 2 months. (C) mRNA levels of IL-6, TNFα and Mcp-1in thoracic PVAT, normalized by 18S, with the ApoE KO levels set as 1. Data are shown as mean ± SD. n=5 mice/group. Student t-test between two groups for each gene, **p<0.01 vs ApoE KO. (D). Levels of the inflammatory cytokines IL-6, TNFα and Mcp-1 in the conditioned medium of PVAT collected from ApoE KO and ApoE/BA-PPARγ DKO. Data are shown as mean ± SD. n=6 mice/group. Student t-test between two groups, *p<0.05 vs ApoE KO **p<0.01 vs ApoE KO. (E). mRNA levels of thermogenesis- and inflammatory-related genes in abdominal PVAT, normalized by 18S and expressed relative to the ApoE KO levels set as 1. Data are shown as mean ± SD. n=3 mice/group. Student t-test between two groups for each gene, *p<0.05 vs ApoE KO, **p<0.01 vs ApoE KO.
Discussion
The appearance and physiologic role of adipose tissue may vary depending upon anatomic and metabolic context. The most popular classification of adipose tissues refers to their coloration, i.e. white adipose tissue (WAT) and brown adipose tissue (BAT). The principal function of WAT is to store energy as triglycerides. In contrast, BAT uses triglycerides as fuel for heat production. Adipose tissues are also classified for their specific locations, for example, pericardial adipose tissue (around the heart), perirenal adipose tissue (around the kidneys) and perivascular adipose tissue (around the blood vessels), etc. The color of these specific depots is either WAT or BAT. Rodents have BAT surrounding thoracic blood vessels (referred to as PVAT) throughout their whole life, whereas humans are born with BAT surrounding large blood vessels of the thorax that is subsequently replaced by WAT in adults21. Recent studies that uncovered a “browning” phenotype in WAT2 suggest the the BAT surrounding the large blood vessels is not replaced by WAT, but undergoes “whitening” in the adult human, which might thus represent beige adipose tissue (BeAT)2. The BeAT is defined as clusters of brown-like adipocytes in WAT. Indeed, a subpopulation of the stromal vascular population (Sca1+ CD45- Mac1-) resident in WAT can differentiate into UCP-1 expressing beige adipocytes22. It is well-established that visceral fat is toxic and secrets inflammatory cytokines/adipokines which might promote the development of CVDs. Because beige adipocytes can burn lipids like classical brown adipocytes, therapeutic strategies aimed at WAT browning are intensely pursued for the treatment of diabetes and CVDs23.
PPARγ is a central regulator of adipocyte gene expression and differentiation24. PPARγ global deficiency in mice leads to embryo lethality, which upon rescue results in lipodistrophy25,26. Adipocyte-specific deletion of PPARγ results in marked adipocyte hypoplasia and hypertrophy27 with abnormalities in the formation and function of both BAT and WAT28. The present study further demonstrates that PPARγ deletion in brown adipocytes results in abnormalities in BAT development and function of both interscapular BAT (iBAT) and aortic PVAT. In spite of the relatively “long” distance from visceral fat depots to cardiovascular target organs, the endocrine cytokines/adipokines from visceral fat were considered the major contributors to the development of CVDs. Recent studies suggest that paracrine factors from local adipose tissues, i.e., PVAT and pericardial adipose tissues, may be more directly associated with the development of CVDs1, 9, 12, 30. It was reported that BAT contributes to clearance of plasma lipids and protects against atherosclerosis development20. However, it is unclear whether the lipotoxicity in the aorta during atherosclerosis development is caused by the adjacent PVAT. Our previous study documented that lack of PVAT, concomitant to deletion of PPARγ in VSMCs, might be associated with enhancement of atherosclerosis1. However, because of the concurrent PPARγ deficiency in VSMCs, that model did not allow to distinguish between the individual roles of PVAT and VSMCs on atherosclerosis even though the PVAT was completely missing1. In this study, the BA-PPARγ-KO mice show depletion of PVAT without affecting PPARγ expression in VSMCs. Even though this model is still not optimal to study the roles of PVAT due to the concurrent disruption of iBAT, up to date, this is the best mouse model to study PVAT function when combined with surgical removal of iBAT. We acknowledge that there are some remaining limitations in our ability to define PVAT roles. First, there are multiple BAT depots, apart from iBAT and PVAT, including deep neck and perirenal areas. However, interscapular BAT is the major depot of BAT and the only BAT amenable to surgical removal. Removal of the BAT in other depots is currently unfeasible and impractical. Second, cold-induced thermogenesis in BAT promotes plasma lipid clearance. In such situation, loss of BAT leads to compensatory thermogenesis in WAT, likely underlying the observed changes in gene expression of WAT from BA-PPARγ KO mice (Figure 3A), even when the mice were housed at 22oC. Therefore, loss of thermogenesis in BAT due to the surgical removal of BAT in the ApoE KO mice might affect the compensatory thermogenesis in WAT as well, which could have a significant impact on WAT biology and thermogenic function. Nonetheless, the levels of expression of thermogenesis genes in WAT (v.g., the mRNA level of Ucp1, Cox8b and Pgc1α, in Supplemental Figure V B) were comparable between the ApoE KO and ApoE/BA-PPARγ DKO mice, indicating that the iBAT removal in the ApoE KO mice functionally mimics the iBAT-hypoplastic effects resulting from the genetic ablation of BA-PPARγ in the double knockout mice. Thus, using this new BA-PPARγ-KO model in the ApoE KO background, we demonstrated that atrophy of PVAT results in significant increase in atherosclerotic lesion in aortas, thus suggesting that lack of functional PVAT drives increased atherosclerosis. This phenotype is reminiscent of that in the ApoE KO mice with insulin receptor deficiency in brown adipocytes which also showed severe brown fat lipoatrophy and aggravated atherosclerosis31.
Inflammatory changes in the arterial wall play crucial roles in promoting atherosclerosis development. PVAT-resident and -recruited inflammatory cells have been hypothesized to be responsible for vascular diseases32. Additionally, accumulation of inflammatory cells in the PVAT of human atherosclerotic aortas indicates that PVAT recruits pro-inflammatory cells during atherogenesis and is primed for inflammatory responses33. A post-mortem study showed that atherosclerotic plaque-to-media ratio increased with increasing PVAT area and PVAT macrophage infiltration. Furthermore, PVAT macrophage infiltration positively correlates with adventitia and plaque macrophages30. Recent data from animal studies indicate that augmenting PVAT-specific inflammation exaggerates atherosclerosis. For example, delivery of miR19b to carotid PVAT promoted secretion of inflammatory cytokines and infiltration of macrophages in PVAT and enhanced atherosclerosis. However, loss of PVAT attenuated miR19b mediated atherosclerosis development and inflammatory cytokines in the plaque8. Conversely, transplant of TLR4-deficient bone marrow resulted in fewer atherosclerotic lesions in LDLR deficient mice which was associated with increased browning of PVAT and decrease TNFα expression in PVAT34, arguing that PVAT inflammation directly correlates with the severity of atherosclerosis. Brown adipocyte specific deletion of PPARγ here not only resulted in inhibition of BAT development, but also increased basal macrophage infiltration in iBAT and PVAT. Furthermore, the inflammatory cytokines such as TNFα, MCP-1 and IL-6 were increased in PVAT of ApoE/BA-PPARγ DKO mice. Additionally, our studies indicated that total cholesterol and triglyceride levels in the liver and plasma were higher in mice with malformation of PVAT, suggesting an abnormal lipid metabolism in this model.
A major function of BAT is to produce heat and it was hypothesized that enhanced thermogenesis in PVAT would protect against obesity-associated atherosclerosis development. Indeed, increased BAT thermogenic activity drastically accelerates clearance of plasma triglycerides as a result of increased uptake into BATs, and BAT activity controls vascular lipoprotein homeostasis by inducing a metabolic program that boosts triglyceride-rich lipoproteins turnover and channels lipids into BAT35. Our study indicated that basal thermogenesis is impaired in the BA-PPARγ-KO mice. Additionally, plasma total cholesterol and triglycerides were increased in the double knock out mice (with iBAT removal), suggesting that the PVAT may contribute to enhance TC and TG clearance from circulation. This phenomenon might also be caused by generation of more cholesterol and triglycerides in the liver of the double knock-out mice as evidenced by increased cholesterol and triglyceride levels in liver of ApoE/BA-PPARγ DKO mice fed a chow diet. This novel model of PPARγ deletion in brown adipocytes will allow us to extend these studies in order to address the specific contributions of PVAT to lipid clearance and any potential metabolic signaling to the liver.
In summary, the results of this study demonstrate that deletion of PPARγ in brown adipocytes impairs PVAT development, without affecting PPARγ expression in smooth muscle cells. Of significance, we show that lack of PVAT development leads to increased local inflammation which further promotes atherosclerosis development. These findings reinforce the notion of a beneficial impact of a functional PVAT in the protection against atherosclerosis, and indicate that preserving PVAT function may therefore represent a new therapeutic target for atherosclerosis and other CVDs.
Supplementary Material
Highlights.
Brown adipocyte-specific deletion of PPARγ results in impaired development of perivascular and interscapular brown adipose tissue.
Brown adipocyte-specific PPARγ deletion results in impaired thermogenesis, and increased inflammation in brown adipose tissue.
Lack of functional PVAT results in increased atherosclerosis development.
Acknowledgments
b) Sources of Funding: The studies were supported by NIH grants HL122664 (to L. Chang), HL123333 (to L. Villacorta), 1HL068878 (to Y.E. Chen), and the National Natural Science Foundation of China 81670429 (to Z. Jiang).
Abbreviations
- PVAT
perivascular adipose tissue
- iBAT
interscapular brown adipose tissue
- BeAT
beige adipose tissue
- sWAT
subcutaneous white adipose tissue
- gWAT
gonadal white adipose tissue
- UCP-1
uncoupling protein-1
- CVDs
cardiovascular diseases
- IL-6
interleukin-6
- IL-8
interleukin-8
- IL-1β
interleukin-1 beta
- MCP-1
monocyte chemoattractant protein-1
- PPARγ
peroxisome proliferator-activated receptor gamma
- VSMCs
vascular smooth muscle cells
- ApoE
apolipoprotein E
- TNFα
tumor necrosis factor alpha
- F4/80
also known as EMR1: EGF-like module-containing mucin-like hormone receptor-like 1
Footnotes
a) Author contributions: WX, XZ, OR and LV performed the experiments and analyzed the data; YF, YG, QZ, JZ, RZ, YEC and ZJ contributed to discussion of the project and manuscript. MGB analyzed the data and wrote the manuscript. LC designed, coordinated and performed experiments, analyzed data and wrote the manuscript.
c) Disclosures: None
References
- 1.Chang L, Villacorta L, Li R, Hamblin M, Xu W, Dou C, Zhang J, Wu J, Zeng R and Chen YE. Loss of perivascular adipose tissue on peroxisome proliferator-activated receptor-gamma deletion in smooth muscle cells impairs intravascular thermoregulation and enhances atherosclerosis. Circulation. 2012;126:1067–78. [DOI] [PMC free article] [PubMed] [Google Scholar]
- 2.Wu J, Bostrom P, Sparks LM, Ye L, Choi JH, Giang AH, Khandekar M, Virtanen KA, Nuutila P, Schaart G, Huang K, Tu H, van Marken Lichtenbelt WD, Hoeks J, Enerback S, Schrauwen P and Spiegelman BM. Beige adipocytes are a distinct type of thermogenic fat cell in mouse and human. Cell. 2012;150:366–76. [DOI] [PMC free article] [PubMed] [Google Scholar]
- 3.Xiong W, Zhao X, Garcia-Barrio MT, Zhang J, Lin J, Chen YE, Jiang Z and Chang L. MitoNEET in Perivascular Adipose Tissue Blunts Atherosclerosis under Mild Cold Condition in Mice. Front Physiol. 8:1032. [DOI] [PMC free article] [PubMed] [Google Scholar]
- 4.Chatterjee TK, Stoll LL, Denning GM, Harrelson A, Blomkalns AL, Idelman G, Rothenberg FG, Neltner B, Romig-Martin SA, Dickson EW, Rudich S and Weintraub NL. Proinflammatory phenotype of perivascular adipocytes: influence of high-fat feeding. Circ Res. 2009;104:541–9. [DOI] [PMC free article] [PubMed] [Google Scholar]
- 5.Antonopoulos AS, Sanna F, Sabharwal N, Thomas S, Oikonomou EK, Herdman L, Margaritis M, Shirodaria C, Kampoli AM, Akoumianakis I, Petrou M, Sayeed R, Krasopoulos G, Psarros C, Ciccone P, Brophy CM, Digby J, Kelion A, Uberoi R, Anthony S, Alexopoulos N, Tousoulis D, Achenbach S, Neubauer S, Channon KM and Antoniades C. Detecting human coronary inflammation by imaging perivascular fat. Sci Transl Med. 2017;9 (398). [DOI] [PubMed] [Google Scholar]
- 6.Ohyama K, Matsumoto Y, Takanami K, Ota H, Nishimiya K, Sugisawa J, Tsuchiya S, Amamizu H, Uzuka H, Suda A, Shindo T, Kikuchi Y, Hao K, Tsuburaya R, Takahashi J, Miyata S, Sakata Y, Takase K and Shimokawa H. Coronary Adventitial and Perivascular Adipose Tissue Inflammation in Patients With Vasospastic Angina. J Am Coll Cardiol. 2018;71:414–425. [DOI] [PubMed] [Google Scholar]
- 7.DeVallance E, Branyan KW, Lemaster K, Olfert IM, Smith DM, Pistilli EE, Frisbee JC and Chantler PD. Aortic dysfunction in metabolic syndrome mediated by perivascular adipose tissue TNFalpha and NOX2 dependent pathway. Exp Physiol. 2018; 103:590–603. [DOI] [PMC free article] [PubMed] [Google Scholar]
- 8.Li C, Li S, Zhang F, Wu M, Liang H, Song J, Lee C and Chen H. Endothelial microparticles-mediated transfer of microRNA-19b promotes atherosclerosis via activating perivascular adipose tissue inflammation in apoE(−/−) mice. Biochem Biophys Res Commun. 2018;495:1922–1929. [DOI] [PubMed] [Google Scholar]
- 9.Brown NK, Zhou Z, Zhang J, Zeng R, Wu J, Eitzman DT, Chen YE and Chang L. Perivascular adipose tissue in vascular function and disease: a review of current research and animal models. Arterioscler Thromb Vasc Biol. 2014;34:1621–30. [DOI] [PMC free article] [PubMed] [Google Scholar]
- 10.Lu D, Wang W, Xia L, Xia P and Yan Y. Gene expression profiling reveals heterogeneity of perivascular adipose tissues surrounding coronary and internal thoracic arteries. Acta Biochim Biophys Sin (Shanghai). 2017;49:1075–1082. [DOI] [PubMed] [Google Scholar]
- 11.Cybularz M, Langbein H, Zatschler B, Brunssen C, Deussen A, Matschke K and Morawietz H. Endothelial function and gene expression in perivascular adipose tissue from internal mammary arteries of obese patients with coronary artery disease. Atheroscler Suppl. 2017;30:149–158. [DOI] [PubMed] [Google Scholar]
- 12.Chang L, Xiong W, Zhao X, Fan Y, Guo Y, Garcia-Barrio M, Zhang J, Jiang Z, Lin JD and Chen YE. Bmal1 in Perivascular Adipose Tissue Regulates Resting Phase Blood Pressure Through Transcriptional Regulation of Angiotensinogen. Circulation.2018; doi: 10.1161/CIRCULATIONAHA.117.029972. [DOI] [PMC free article] [PubMed] [Google Scholar]
- 13.Kong X, Banks A, Liu T, Kazak L, Rao RR, Cohen P, Wang X, Yu S, Lo JC, Tseng YH, Cypess AM, Xue R, Kleiner S, Kang S, Spiegelman BM and Rosen ED. IRF4 is a key thermogenic transcriptional partner of PGC-1alpha. Cell. 2014;158:69–83. [DOI] [PMC free article] [PubMed] [Google Scholar]
- 14.Daugherty A, Tall AR, Daemen M, Falk E, Fisher EA, Garcia-Cardena G, Lusis AJ, Owens AP 3rd, Rosenfeld ME, Virmani R, American Heart Association Council on Arteriosclerosis T, Vascular B and Council on Basic Cardiovascular S. Recommendation on Design, Execution, and Reporting of Animal Atherosclerosis Studies: A Scientific Statement From the American Heart Association. Arteriosclerosis, thrombosis, and vascular biology. 2017;37:e131–e157. [DOI] [PubMed] [Google Scholar]
- 15.Cho KW, Morris DL and Lumeng CN. Flow cytometry analyses of adipose tissue macrophages. Methods Enzymol. 2014;537:297–314. [DOI] [PMC free article] [PubMed] [Google Scholar]
- 16.Villacorta L, Minarrieta L, Salvatore SR, Khoo NK, Rom O, Gao Z, Berman RC, Jobbagy S, Li L, Woodcock SR, Chen YE, Freeman BA, Ferreira AM, Schopfer FJ and Vitturi DA. In situ generation, metabolism and immunomodulatory signaling actions of nitro-conjugated linoleic acid in a murine model of inflammation. Redox Biol. 2018;15:522–531. [DOI] [PMC free article] [PubMed] [Google Scholar]
- 17.Guo Y, Fan Y, Zhang J, Lomberk GA, Zhou Z, Sun L, Mathison AJ, Garcia-Barrio MT, Zhang J, Zeng L, Li L, Pennathur S, Willer CJ, Rader DJ, Urrutia R and Chen YE. Perhexiline activates KLF14 and reduces atherosclerosis by modulating ApoA-I production. J Clin Invest. 2015;125:3819–30. [DOI] [PMC free article] [PubMed] [Google Scholar]
- 18.Rom O, Korach-Rechtman H, Hayek T, Danin-Poleg Y, Bar H, Kashi Y and Aviram M. Acrolein increases macrophage atherogenicity in association with gut microbiota remodeling in atherosclerotic mice: protective role for the polyphenol-rich pomegranate juice. Arch Toxicol. 2017;91:1709–1725. [DOI] [PubMed] [Google Scholar]
- 19.Fitzgibbons TP, Kogan S, Aouadi M, Hendricks GM, Straubhaar J and Czech MP. Similarity of mouse perivascular and brown adipose tissues and their resistance to diet-induced inflammation. Am J Physiol Heart Circ Physiol. 2011;301:H1425–37. [DOI] [PMC free article] [PubMed] [Google Scholar]
- 20.Berbee JF, Boon MR, Khedoe PP, Bartelt A, Schlein C, Worthmann A, Kooijman S, Hoeke G, Mol IM, John C, Jung C, Vazirpanah N, Brouwers LP, Gordts PL, Esko JD, Hiemstra PS, Havekes LM, Scheja L, Heeren J and Rensen PC. Brown fat activation reduces hypercholesterolaemia and protects from atherosclerosis development. Nat Commun. 2015;6:6356. [DOI] [PMC free article] [PubMed] [Google Scholar]
- 21.Sethi JK and Vidal-Puig AJ. Thematic review series: adipocyte biology. Adipose tissue function and plasticity orchestrate nutritional adaptation. J Lipid Res. 2007;48:1253–62. [DOI] [PMC free article] [PubMed] [Google Scholar]
- 22.Schulz TJ, Huang TL, Tran TT, Zhang H, Townsend KL, Shadrach JL, Cerletti M, McDougall LE, Giorgadze N, Tchkonia T, Schrier D, Falb D, Kirkland JL, Wagers AJ and Tseng YH. Identification of inducible brown adipocyte progenitors residing in skeletal muscle and white fat. Proc Natl Acad Sci U S A. 2011;108:143–8. [DOI] [PMC free article] [PubMed] [Google Scholar]
- 23.Mukherjee J, Baranwal A and Schade KN. Classification of Therapeutic and Experimental Drugs for Brown Adipose Tissue Activation: Potential Treatment Strategies for Diabetes and Obesity. Curr Diabetes Rev. 2016;12:414–428. [DOI] [PMC free article] [PubMed] [Google Scholar]
- 24.Chawla A, Schwarz EJ, Dimaculangan DD and Lazar MA. Peroxisome proliferator-activated receptor (PPAR) gamma: adipose-predominant expression and induction early in adipocyte differentiation. Endocrinology. 1994;135:798–800. [DOI] [PubMed] [Google Scholar]
- 25.Barak Y, Nelson MC, Ong ES, Jones YZ, Ruiz-Lozano P, Chien KR, Koder A and Evans RM. PPAR gamma is required for placental, cardiac, and adipose tissue development. Mol Cell. 1999;4:585–95. [DOI] [PubMed] [Google Scholar]
- 26.Duan SZ, Ivashchenko CY, Whitesall SE, D’Alecy LG, Duquaine DC, Brosius FC 3rd,Gonzalez FJ, Vinson C, Pierre MA, Milstone DS and Mortensen RM. Hypotension, lipodystrophy, and insulin resistance in generalized PPARgamma-deficient mice rescued from embryonic lethality. J Clin Invest. 2007;117:812–22. [DOI] [PMC free article] [PubMed] [Google Scholar]
- 27.He W, Barak Y, Hevener A, Olson P, Liao D, Le J, Nelson M, Ong E, Olefsky JM and Evans RM. Adipose-specific peroxisome proliferator-activated receptor gamma knockout causes insulin resistance in fat and liver but not in muscle. Proc Natl Acad Sci U S A. 2003;100:15712–7. [DOI] [PMC free article] [PubMed] [Google Scholar]
- 28.Jones JR, Barrick C, Kim KA, Lindner J, Blondeau B, Fujimoto Y, Shiota M, Kesterson RA, Kahn BB and Magnuson MA. Deletion of PPARgamma in adipose tissues of mice protects against high fat diet-induced obesity and insulin resistance. Proc Natl Acad Sci U S A. 2005;102:6207–12. [DOI] [PMC free article] [PubMed] [Google Scholar]
- 29.Ahmad FS, Ning H, Rich JD, Yancy CW, Lloyd-Jones DM and Wilkins JT. Hypertension, Obesity, Diabetes, and Heart Failure-Free Survival: The Cardiovascular Disease Lifetime Risk Pooling Project. JACC Heart Fail. 2016;4:911–919. [DOI] [PMC free article] [PubMed] [Google Scholar]
- 30.Verhagen SN, Vink A, van der Graaf Y and Visseren FL. Coronary perivascular adipose tissue characteristics are related to atherosclerotic plaque size and composition. A post-mortem study. Atherosclerosis. 2012;225:99–104. [DOI] [PubMed] [Google Scholar]
- 31.Gomez-Hernandez A, Beneit N, Escribano O, Diaz-Castroverde S, Garcia-Gomez G, Fernandez S and Benito M. Severe Brown Fat Lipoatrophy Aggravates Atherosclerotic Process in Male Mice. Endocrinology. 2016;157:3517–28. [DOI] [PubMed] [Google Scholar]
- 32.Okamoto E, Couse T, De Leon H, Vinten-Johansen J, Goodman RB, Scott NA and Wilcox JN. Perivascular inflammation after balloon angioplasty of porcine coronary arteries. Circulation. 2001;104:2228–35. [DOI] [PubMed] [Google Scholar]
- 33.Henrichot E, Juge-Aubry CE, Pernin A, Pache JC, Velebit V, Dayer JM, Meda P, Chizzolini C and Meier CA. Production of chemokines by perivascular adipose tissue: a role in the pathogenesis of atherosclerosis? Arterioscler Thromb Vasc Biol. 2005;25:2594–9. [DOI] [PubMed] [Google Scholar]
- 34.Liu P, Huang G, Cao Z, Xie Q, Wei T, Huang C, Li Q, Sun M, Shen W and Gao P. Haematopoietic TLR4 deletion attenuates perivascular brown adipose tissue inflammation in atherosclerotic mice. Biochim Biophys Acta. 2017;1862:946–957. [DOI] [PubMed] [Google Scholar]
- 35.Bartelt A, Bruns OT, Reimer R, Hohenberg H, Ittrich H, Peldschus K, Kaul MG, Tromsdorf UI, Weller H, Waurisch C, Eychmuller A, Gordts PL, Rinninger F, Bruegelmann K, Freund B, Nielsen P, Merkel M and Heeren J. Brown adipose tissue activity controls triglyceride clearance. Nat Med. 2011;17:200–5. [DOI] [PubMed] [Google Scholar]
Associated Data
This section collects any data citations, data availability statements, or supplementary materials included in this article.