

Abstract
Group 2 innate lymphoid cells (ILC2s) are distributed systemically and produce type 2 cytokines in response to a variety of stimuli, including the epithelial cytokines interleukin (IL)-25, IL-33, and thymic stromal lymphopoietin (TSLP). Transcriptional profiling of ILC2s from different tissues, however, grouped ILC2s according to their tissue of origin, even in the setting of combined IL-25, IL-33R and TSLPR-deficiency. Single-cell profiling confirmed a tissue-organizing transcriptome and identified ILC2 subsets expressing distinct activating receptors, including the major subset of skin ILC2s, which were activated preferentially by IL-18. Tissue ILC2 subsets were unaltered in number and expression in germ-free mice, suggesting that endogenous, tissue-derived signals drive the maturation of ILC2 subsets by controlling expression of distinct patterns of activating receptors, thus anticipating tissue-specific perturbations occurring later in life.
Introduction
Group 2 innate lymphoid cells (ILC2s) are defined by their ability to produce type 2 cytokines, in particular interleukin 5 (IL-5) and IL-13, by integrating inputs from multiple ligands, including cytokines, neuropeptides and eicosanoids1,2. The epithelial cytokines IL-33, IL-25 and thymic stromal lymphopoietin (TSLP) are powerful ILC2 activating ligands, and mice deficient in these signaling pathways display substantial compromise in the capacity of mature lung ILC2s to generate type 2 cytokines in response to helminths and allergens3–7. Recent analyses of murine and human ILCs have indicated transcriptomic heterogeneity of ILC2s in tissues8–10; however, direct comparisons of ILC2s among normal resting tissues are limited and complicated by sorting strategies that rely on surface markers that are variably expressed by ILCs. Furthermore, functional characterization of the signals that establish the homeostatic activation profiles of ILC2s across and within disparate tissues, particularly in skin, are lacking.
In this study, we combine analysis of mouse cytokine reporter alleles with RNA sequencing approaches to comprehensively assess the constitutively function-marked populations of ILC2s present in resting bone marrow and peripheral tissues11,12. We further analyze germ-free mice and mice triple-deficient in IL-33, IL-25 and TSLP signaling, to uncover key determinants of homeostatic effector cytokine function that remains intact even in the absence of commensal microbiota, as assessed by the ILC2-defining cytokines IL-5 and IL-13. Remarkably, although IL-5+ ILC2s required IL-33, IL-25 and TSLP signaling for optimal homeostatic type 2 cytokine competency in a tissue-dependent manner, the transcriptomic signatures imprinted by each tissue in which ILC2s reside dictated their identity. Receptiveness to independent activating signals segregated by tissue, as highlighted by skin ILC2s, which, like smaller ILC2 subsets in lung and bone marrow, expressed the IL-18R and produced type 2 cytokines in response to IL-18. In the absence of IL-18, this ILC2 subset was functionally impaired both in the steady-state and after inflammatory skin challenge. The expression of activating receptors by a tissue-specific program even in the absence of ligand-receptor signals reveals an anticipatory logic underpinning the roles for type 2 immune responses among different organs and tissues.
Results
Basal activation defines tissue-resident ILC2s
The epithelial cytokines IL-33, IL-25 and thymic stromal lymphopoietin (TSLP) are important activating signals for ILC2s in homeostasis and in response to tissue injury. To assess the impact of combined TSLP, IL-33, and IL-25 deficiency on ILC2s under steady-state conditions, we analyzed ILC2s from multiple tissues in 8–12-week-old YRS mice that express reporter alleles for arginase-1 (Yarg), IL-5 (Red5; R5), and IL-13 (Smart13; huCD4), which are highly expressed among resting (YR7,11,13) and activated (S14,15) ILC2s; cells from YRS mice triple-deficient in TLSPR, IL-33R and IL-25 (TKO-YRS7; Fig. 1a) were collected and analyzed similarly (below). Among lineage-negative (Lin-) cells from YRS mice, we assessed R5+ ILC2s in the lung, gut (small intestine lamina propria), fat (perigonadal adipose tissue), and skin; the latter had diminished Yarg expression and variable expression of other common ILC2 surface markers. ILC2s from bone marrow expressed Yarg but were R5- (Fig. 1b and Supplementary Fig. 1). These findings are consistent with previous characterizations of these reporter alleles11,13,16. Although bone marrow ILC2s did not spontaneously express the R5 or S13 reporter alleles as in other tissues, stimulation with PMA and ionomycin resulted in robust IL-5 and IL-13 release and expression of cytokine reporter alleles in >90% of these cells, thereby confirming the identity of the Yarg+ bone marrow ILC2 population by their ability to produce hallmark ILC2 cytokines (Fig. 1c-e).
Figure 1: Steady-state ILC2 activation in multiple peripheral tissues.
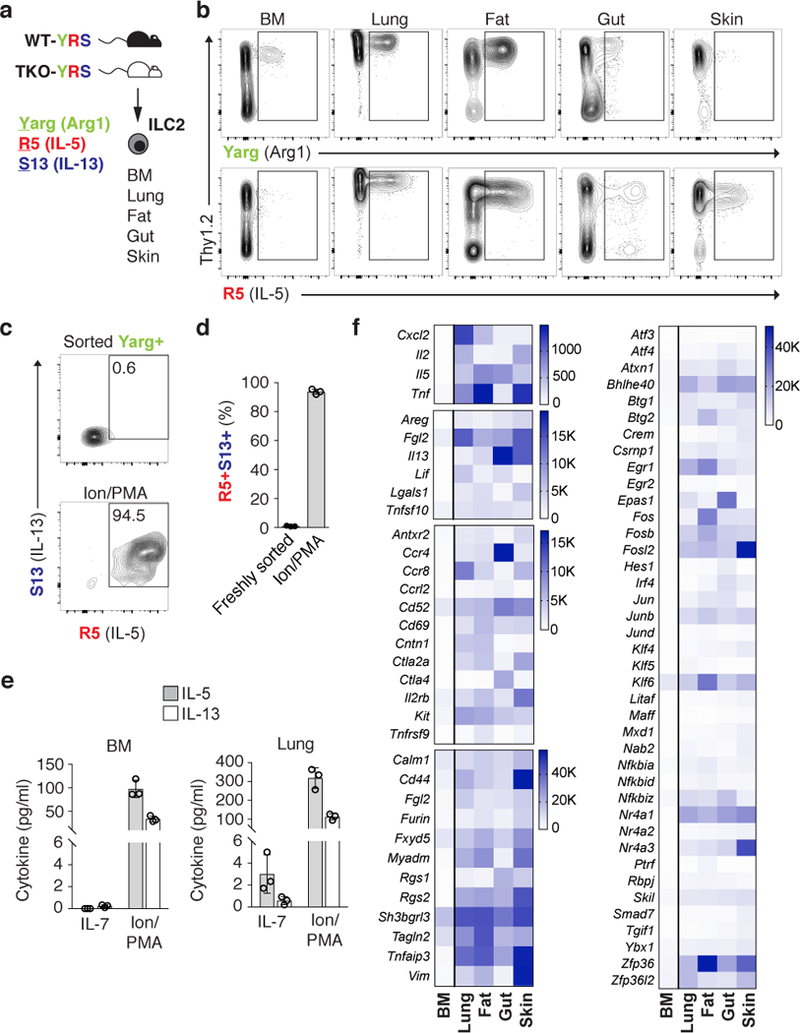
a, ILC2s were analyzed in multiple tissues from wild-type (WT) or Crlf2–/–IL25–/–Il1rl1–/– triple-deficient (TKO) mice on Arg1 (Yarg); R5 (IL-5); S13 (IL-13) combined triple-reporter (YRS) background. b, Representative flow cytometry of CD45+Lin- cells from indicated WT-YRS mouse tissues. c, d, Representative flow cytometry (c) and percentage (d) of sorted Yarg+ bone marrow (BM) ILC2 expressing R5 and S13 reporter alleles before and after stimulation with ionomycin (Ion) and phorbol 12-myristate 13-acetate (PMA). e, IL-5 and IL-13 in supernatants of Yarg+ ILC2 sorted from WT-YRS BM or lung tissue cultured in IL-7 or Ion/PMA for 24 h. f, RNA-seq analysis of select transcripts significantly enriched (FDR<0.01) in R5+ ILC2s from peripheral tissues (lung, gut, fat, skin) versus Yarg+ BM ILC2s. b, c, Data representative of 3 independent experiments and in (d-f) represent biological replicates (n=3; mean±SD). f, Data represent mean normalized read counts (fragments per million mapped reads) from biological replicates (n=3, BM; n=5, lung; n=6, fat, gut, skin).
The widespread distribution of R5+ ILC2s in resting tissues suggested that ILC2s are activated by stimuli in the absence of apparent exogenous challenge. To decipher these signals, we performed RNA sequencing (RNA-seq) to compare the transcriptomes of purified R5+ ILC2s isolated from lung, gut, fat, and skin, and Yarg+ ILC2s from bone marrow (which are R5-). Compared to bone marrow ILC2s, peripheral tissue steady-state ILC2s expressed significantly increased transcripts encoding growth factors, cytokines and cytokine-related genes (e.g., Areg, Il2, Il5, Il13, Lif, Tnf, Tnfsf10, Cish), transcriptional regulators (e.g., Fos, Jun, Klf4, Klf5, Klf6, Irf4, Maff, Egr1, Egr2, Epas1, Nfkbiz), nuclear factors (e.g., Nr4a1, Nr4a2, Nr4a3), enzymes (e.g., Tnfaip3, Plk3, Clk4, Dusp1, Dusp4, Dusp5, Dusp10) and extracellular receptors associated with lymphoid cell activation (e.g., Cd44, Cd69, Il2rb, Ctla4, Kit, Ccr4, Ccr8) (Fig. 1f, Supplementary Fig. 2, and Supplementary Table 1). These results highlight the basal activation state of tissue-resident ILC2s, although heterogeneity is apparent among different tissues. Indeed, the transcriptional profile of steady-state tissue ILC2s resembled the shared transcriptional programs of tissue effector ILC2s and CD4+ helper T cells (TH2) cells elicited by type 2 immune stimulation7,17.
Basal ILC2 activation is independent of microbiota
Steady-state stimulation by commensal microbes has been implicated in epigenetic and transcriptional alterations among intestinal ILC subsets10. With this in mind, we examined the tissue ILC2 activation program in germ-free mice as compared with mice housed in specific pathogen-free (SPF) barrier conditions. Similar numbers of ILC2s (defined in lungs, skin, fat, and bone marrow as Lin-CD45+Thy1.2+CD25+, or in gut as Lin-CD45+KLRG1+IL-17Rb+, in the absence of the fluorescent reporters) were recovered from the lungs, skin, gut, fat, and bone marrow of germ-free and SPF mice (Fig. 2a-c, and Supplementary Fig. 3a, b). Additionally, steady-state eosinophil numbers, which depend on ILC2-derived IL-511, were not significantly different in germ-free animals as compared to SPF controls (Fig. 2d), indicating that although the presence or absence of particular commensal microbes can alter intestinal ILC subset composition10, these changes do not significantly impact cytokine-influenced functional outcomes of the tissue ILC2 activation program. In confirmation of these findings, we detected similar expression of Il5 transcripts in comparing germ-free and SPF ILC2s isolated from bone marrow, fat, lung, gut, and skin (Fig. 2e). Transcript abundance for Gata3, Arg1, and for receptor components for tissue-derived cytokines, such as Il1rl1 (encoding the IL-33 receptor subunit T1/ST2), Il17rb (encoding the IL-25 receptor subunit IL17RB), and Tnfaip3 (encoding the ubiquitin-modifying enzyme A20 induced by NF-κB signaling) were also comparable (Supplementary Fig. 3c-g). Thus, tissue programs driving peripheral ILC2 activation are independent of commensal microbes and are likely driven by tissue-intrinsic signals.
Figure 2: ILC2 distribution and homeostatic function is independent of the microbiota.

a, b, Number of ILC2s (Lin-CD45+Thy1.2+CD25+) in lungs (a), and skin (b). c, c, Percentage of gut ILC2s (Lin-CD45+IL17rb+KLRG1+) out of total CD45+ cells. d,Number of spleen eosinophils in C57BL/6 mice housed in specific pathogen-free (SPF) or germ-free (GF) conditions. e, Quantitative RT-PCR (qPCR) analysis of Il5 transcript abundance among ILC2s sorted from SPF or GF mouse tissues. a-d, Data pooled from 2 or more independent experiments with n≥4 from each tissue and expressed as mean±SD. e, Data represent biological replicates (n=3; mean⩲SD) and are normalized to Rps17.
Distinct tissue signals drive resident ILC2 activation
Tissue-derived signals, such as the cytokines IL-25, IL-33, and TSLP, control type 2 cytokine production from ILC2s in peripheral tissues in response to infectious or homeostatic perturbations3,7,15,18,19, and synergize with other ILC2 activation signals such as leukotrienes20 and neuropeptides21. We assessed whether these three signals contributed to the resting activation profile of ILC2s by examining multiple tissues from triple-reporter YRS and TKO-YRS mice, which lack responsiveness to TLSP, IL-33, and IL-25 cytokine signals. Importantly, TKO-YRS mice harbored normal numbers of total ILC2s in lung, fat, and gut (Fig. 3a-c), although the numbers of activated IL-5-expressing R5+ ILC2s were significantly reduced in these peripheral tissues (Fig. 3d-f and Supplementary Fig. 4), extending prior observations of lung ILC2s7. Peripheral eosinophil numbers were also diminished in TKO-YRS mice, consistent with the role for ILC2s in sustaining systemic IL-5 (Fig. 3g). The magnitude of the reduction in R5+ ILC2s, however, was not consistent among peripheral tissues; notably, the skin contained comparable numbers of R5+ ILC2s in wild-type-YRS and TKO-YRS mice (Fig. 3h), indicating that signals apart from IL-25, IL-33, and TSLP sustain steady-state IL-5 production from skin ILC2s.
Figure 3: Tissue-resident ILC2s depend on distinct tissue signals.

a-b, Number of ILC2s (Lin-CD45+Thy1.2+CD25+) in lungs (a) and fat (b). c, percentage of ILC2s (Lin-CD45+KLRG1+) out of total CD45+ cells in gut among wild-type (WT) or Crlf2–/–IL25–/–Il1rl1–/– triple-deficient (TKO) mice on Arg1 (Yarg); R5 (IL-5); S13 (IL-13) triple-reporter (YRS) backgrounds. d-f, Number of R5+ ILC2s (Lin-CD45+) in lungs (d), fat (e), and gut (f) tissues of WT-YRS and TKO-YRS mice. g, Numbers of eosinophils in spleen. h, Number of R5+ ILC2s in skin (Lin-CD45+) of WT-YRS and TKO-YRS mice. Data pooled from 2 or more independent experiments with n≥10 mice per group, represented as mean⩲SD; **, p<0.001; ***, p<0.0001.
To explore this further, we compared the transcriptional profiles of ILC2s from YRS and TKO-YRS mice isolated from multiple tissues. In agreement with the reporter gene expression and in agreement with prior studies7,15,19, type 2 cytokine transcripts were reduced in TKO-YRS ILC2s isolated from lung, fat, and gut (Supplementary Fig. 5d, e). Clustering based on the top 1000 differentially expressed genes, however, revealed that the major transcriptional signatures from wild-type and TKO ILC2s were tissue-specific, and independent of the presence or absence of these epithelial cytokines (Fig. 4a and Supplementary Fig. 5a-e). Among wild-type R5+ or Yarg+ ILC2s, tens to hundreds of transcripts were differentially expressed by ILC2s collected from single tissues as compared to all other tissues, with gut and skin ILC2s showing the greatest numbers of divergent transcripts from the other groups. Notably, we observed enhanced Il17rb expression in gut ILC2s but significantly increased Il18r1 in skin ILC2s (Fig. 4b, Supplementary Fig. 5f, g, and Supplementary Table 1). Collectively, these findings suggest that distinct tissue-derived factors contribute to ILC2 subset activation in the steady state.
Figure 4: Transcriptional heterogeneity of tissue-resident ILC2s.

a, t-distributed stochastic neighbor embedding (tSNE) plot representing ILC2 samples. ILC2s were sorted from lung, fat, gut, skin (Lin-CD45+Red5+), and bone marrow (BM, Lin-CD45+Yarg+) as outlined in the gating strategy shown in Supplementary Figure 1. b, RNA-seq analysis of differentially expressed transcripts (FDR<0.01) among ILC2s from each tissue versus all other tissues; select upregulated transcripts in each tissue highlighted. Data pooled from 3 independent experiments with n≥3 biological replicates per group.
Single-cell RNA sequencing distinguishes ILC2 subsets
To explore further the nature of ILC2 tissue signatures and to discern whether these differences identified by bulk RNA-seq resulted from contamination by non-hematopoietic tissue cells, we performed single-cell RNA sequencing (scRNA-seq) on 35,396 sorted ILC2s from bone marrow and peripheral tissues. In confirmation of the bulk sequencing results, scRNA-seq analysis of the aggregated ILC2s from multiple tissues showed segregation by tissue, which could be further sub-clustered within each tissue, revealing novel intra-tissue ILC2 subsets (Fig. 5a and Supplementary Fig. 6a-c). We observed minimal (<2%; Supplementary Fig. 6b) contamination by non-ILC2 cells, and, in agreement with the bulk sequencing results, common transcripts such as Gata3, Il7r, and Crlf2 (encoding the TSLP receptor subunit TSLPR) were expressed by the majority of ILC2s across tissues, whereas other transcripts were enriched in particular tissues (Fig. 5b-f and Supplementary Figs. 6c, and 7), consistent with tissue-specific functional roles. The gene encoding the IL-33 receptor subunit Il1rl1 was enriched among fat and lung ILC2s, corresponding to a loss of IL-5 reporter R5 expression in ILC2s from these tissues in mice lacking this receptor (Fig. 5d and Supplementary Fig. 4). The gene encoding the IL-25R, Il17rb, was abundant among gut ILC2s, and matched the loss of R5 expression predominantly among small intestinal ILC2s in mice lacking IL-25 (Fig. 5e and Supplementary Fig. 4). These findings are consistent with prior studies linking IL-33 to steady-state ILC2 function in fat and lung19,22 and IL-25 to small intestinal ILC2 function15,23. In contrast, skin ILC2s showed comparatively low expression of both IL-25 and IL-33 receptors, as assessed both by flow cytometry and transcript analysis, and consistent with unaltered IL-5 expression among TKO skin ILC2s (Fig. 5d, e, g, Supplementary Figs. 4, 6c and Supplementary Table 1). Of note, skin ILC2s expressed IL-18R1 (CD218) cell surface protein and Il18r1 transcript, even in germ-free mice (Supplementary Fig. 3h). In agreement with the bulk RNA-seq results, IL-18 receptor subunit expression was also enriched on subsets of lung and bone marrow ILC2s identified by scRNA-seq and flow cytometry (Fig. 5f, h and Supplementary Fig. 6b, c). These findings raise the possibility that IL-18 could influence ILC2 function in a tissue- and subset-specific manner.
Figure 5: Tissue map of ILC2 signals revealed by single-cell RNA sequencing.
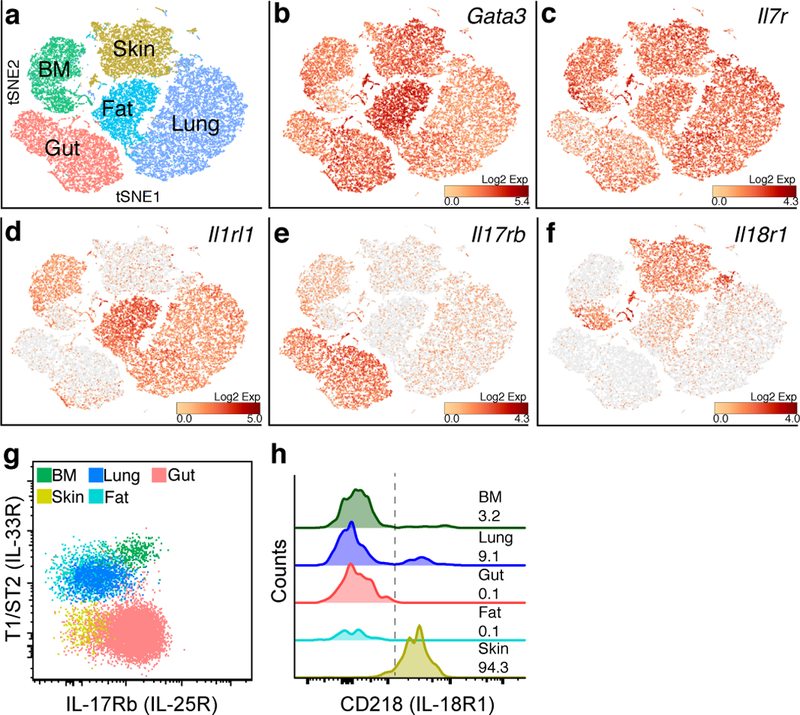
a, tSNE plot representing 35,396 ILC2s sorted from BM (Lin-CD45+Yarg+), lung, fat, gut and skin (Lin-CD45+Red5+) analyzed by single-cell RNA sequencing (scRNA-seq). b-f, normalized relative expression of Gata3 (b), Il7r (c), Il1rl1 (d), Il17rb (e), and Il18r1 (f) transcripts. g-h, Representative flow cytometric staining for T1/ST2 (IL-33R), IL17Rb (IL-25R) (g), and CD218 (IL-18R1) (h) among ILC2s from indicated WT-YRS mouse tissues. g, h, Data are representative of 3 independent experiments. h, numbers represent the percentage of ILC2s positive for CD218 (right of dotted line).
IL-18 independently activates IL-18R-bearing ILC2s
IL-1 cytokine family members, including IL-18 and IL-33, can induce cytokine expression from lymphoid cells, particularly in the presence of STAT5 activators such as IL-7 and TSLP24,25. To test the function of IL-18 on these IL-18R-bearing peripheral ILC2 subsets, we sorted ILC2s from skin and lung and cultured them with IL-18 and TSLP in vitro. As compared to TSLP alone, ILC2s produced significantly higher amounts of IL-13 in the presence of IL-18 (Fig. 6a), and in agreement with a recent characterization of IL-18-responsive ILCs isolated from human tissues9. Intradermal injection of IL-18 and TSLP into S13 reporter mice increased IL-13 reporter expression among both skin and lung ILC2s (Fig. 6b), indicating that IL-18R1 expression on ILC2s mediates type 2 cytokine production from these cells in response to IL-18. To determine whether IL-18 contributes to the steady-state production of type 2 cytokines from ILC2s, we compared S13 and R5 reporter allele expression on wild-type ILC2s to those on an IL-18-deficient background (IL-18 KO). Although the numbers of R5+ ILC2s in wild-type and IL-18 KO mice were comparable (Supplementary Fig. 8a, b), S13 expression and R5 fluorescence were significantly reduced in IL-18-deficient skin ILC2s in comparison with wild-type control cells (Fig. 6c, d), revealing a non-redundant role for IL-18 as a steady-state activator of IL-18R1-expressing ILC2s. We considered how IL-18 might contribute to steady-state activation of ILC2s in the presence or absence of other endogenous activating cytokines, including IL-25 and IL-33, in light of their tissue- and subset-specific receptor expression patterns. Although total R5+ ILC2s were reduced in the lungs of TKO animals (Fig. 3d and Supplementary Fig. 4), the IL-18R1+ R5+ ILC2 subset was expanded in number when compared to wild-type control mice, both in the steady-state and in response to intranasal IL-18 (Fig. 6e). These observations indicate that IL-18 could preferentially mediate activation and type 2 cytokine production from the IL-18R1-expressing ILC2 subset independent of IL-25, IL-33, and TSLP. In further support of this notion, IL-18 mediated activation and cytokine reporter expression among bone marrow IL-18R1+ Yarg+ ILC2s in the absence of IL-33R (ST2) expression, although the latter was required to respond to IL-33 (Fig. 6f). As receptor components for both IL-33 and IL-18 were expressed on some ILC2 subsets, we tested whether these two cytokines combined to control the steady-state expression of IL-5 in IL-18R1-expressing ILC2 subsets in skin and lung. Indeed, R5 expression among lung and skin ILC2 subsets bearing CD218 and/or ST2 was significantly reduced in mice that lacked both IL-18 and the IL-33 receptor ST2 when compared to wild-type controls (Fig. 6g). Thus, patterns of activating receptors have biologic significance that are organ-specific and based upon the subsets of ILC2s populating that tissue.
Figure 6: IL-18 independently mediates ILC2 subset activation.

a, IL-13 in supernatants of ILC2s (Lin-CD45+Thy1.2+Red5+) sorted from skin or lung tissue and cultured in TSLP alone or TSLP and IL-18. b, Percentage of skin and lung ILC2s (Lin-CD45+Thy1.2+Red5+) expressing S13 reporter allele after intradermal injection of PBS or TSLP and IL-18. c, d, Percentage of skin ILC2s expressing S13 reporter allele (c) and R5 reporter median fluorescence intensity (MFI) (d) among skin ILC2s from WT and IL18-deficient (KO) mice on a R5; S13 dual-reporter background. e, Number of IL-18R1+R5+ ILC2s in lungs of WT-YRS and TKO-YRS mice 24 h after intranasal administration of PBS or recombinant IL-18. f, Percentage of IL-18R1+Yarg+ ILC2s sorted from BM of WT or ST2 KO mice expressing S13 reporter allele 24 h after culture in IL-7+IL-33 or IL-7+IL-18. g, Representative flow cytometry of R5 reporter expression among skin and lung ILC2s (Lin-CD45+Thy1.2+) from WT and IL-18–/–ST2–/–deficient (DKO) mice on a R5; S13 dual-reporter background. Numbers indicate percent R5 positive in each quadrant. Data in (a-f) pooled from 2 or more independent experiments for a total of at least 3 mice per group, represented as mean⩲SD; *, p<0.01; **, p<0.001; ***, p<0.0001.
Blunted type 2 skin inflammation in the absence of IL-18
ILC2s have been shown to be increased in lesional skin of patients with atopic dermatitis and in mouse models of atopic dermatitis-like inflammation5,26. Our findings that IL-18 can activate skin ILC2s and that loss of IL-18 leads to reduced activation of skin ILC2s in homeostasis (Fig. 6a-d) led us to further examine whether IL-18 contributed to ILC2 function in the context of an in vivo mouse model of skin inflammation. In order to test this, we used topical application of MC903, a well characterized mouse model of atopic-like inflammation that has been shown to activate ILC2s and cause eosinophilia, skin swelling and type 2 inflammation26. Compared to wild-type mice, IL-18-deficient mice exhibited decreased skin tissue accumulation of total ILC2s and of IL-5- and IL-13-producing ILC2s (Fig. 7a-c), which are critical determinants of eosinophil recruitment into tissues7. Indeed, mice deficient in IL-18 also showed a corresponding decrease in the numbers of eosinophils recruited to ear skin tissue in response to MC903 (Fig. 7d). These data suggest that IL-18 not only influences basal ILC2 subset activation in the steady-state but also contributes to their function in models of atopic dermatitis.
Figure 7: Blunted type 2 skin inflammation in the absence of IL-18.

a-d, Total skin ILC2s (Lin-CD45+Thy1.2+CD25+) (a), R5+ ILC2s (Lin-CD45+Thy1.2+Red5+) (b), percentage of R5+ ILC2s expressing S13 reporter allele (c), and total eosinophils (d) in ears of wild type or IL-18KO mice treated with ethanol (EtOH) or MC903. Data pooled from 2–3 individual experiments with n≥6 for each experimental group and are represented as mean±SEM; *, p<0.05; **(p<0.005); ***, p<0.0005, ****, p<0.00005.
Discussion
ILC2s are largely tissue-resident cells with a canonical effector function centered around the production of type 2 cytokines, particularly in response to key activating cytokines like IL-33, IL-25 and TSLP. Here, we show that expression of these cytokine receptors impacts cytokine discharge from ILC2s, but with varying effects in different tissues, reflecting unappreciated diversity in receptor expression on ILC2 subsets in different organs. Indeed, some ILC2 subsets, including most skin ILC2s, express low levels of receptors for epithelial cytokines IL-33, IL-25 and TSLP, and instead are activated dominantly by IL-18, which is highly expressed on skin ILC2s and sub-populations of ILC2s in lung and bone marrow. Strikingly, transcriptomic profiling of ILC2s revealed tissue-specific subsets of cells whose expression patterns remained largely unaffected by the absence of signaling through the three canonical epithelial cytokines. These tissue-specific expression patterns, including the capacity to respond to epithelial cytokines or IL-18, were normal in germ-free and cytokine-deficient mice, uncovering a tissue-derived signature responsible for preemptively establishing responsiveness of ILC2 subsets in different tissues in anticipatory fashion, since normal receptor expression and tissue distribution occur even in the absence of ligand-mediated stimulation.
These tissue signatures reveal new potential therapeutic targets among particular cytokine receptor-bearing subsets of ILC2s. Notably, in IL-18-deficient mice, the IL-18R-bearing ILC2s in the skin exhibited a substantial defect in the homeostatic activation of ILC2s in vivo. Moreover, ILC2 proliferation and activation, as well as eosinophil recruitment, were blunted in IL-18-deficient animals after skin challenge with MC903, a well-characterized mouse model of atopic-like dermatitis. These results are particularly intriguing as transgenic mice that overexpress IL-18 in keratinocytes develop severe dermatitis27, and elevated IL-18 correlates with disease severity in atopic dermatitis28,29, raising the possibility that targeting IL-18 may represent a novel means to ameliorate type 2 immune activation in the skin. In addition, given that receptor components for both IL-33 and IL-18 were expressed on some ILC2 subsets, activation by these two signals either alone or in combination may influence allergic diseases like asthma and atopic dermatitis. Indeed, the genes for IL-18R1 and IL-33R receptors are located together in the genome at an interval linked by GWAS with risk for allergic diseases in large cohorts30,31.
Further study using appropriate fate-mapping tools will be required to determine whether these tissue-specific expression profiles are acquired during fetal or perinatal development when ILC2s become established in tissues12,16,32, and how these programs are engaged during differentiation from bone marrow precursors in adults, or after tissue insults like helminths and allergens. Intriguingly, ILC2 effector function is expressed post-birth, and may create an additional layer of control along with tissue resident macrophages during this critical period of growth and development, where cell identity becomes established within temporal proximity to tissue differentiation33, and before the maturation of tissue-resident adaptive immunity. Importantly, our findings suggest discrete stages in the development of mature tissue ILC2s34. ILC2 precursors are first seeded into tissues, where they acquire a tissue-specific transcriptome characterized by expression of distinct subsets of activating receptors and an activated, poised, phenotype. The subsequent generation of the canonical type 2 cytokines is then regulated by the generation of distinct sets of ligands that converge on receptors expressed by ILC2s specific to that tissue. How and why these diverse tissue pathways converge on the canonical type 2 cytokines and related effectors in ILC2s distributed across multiple tissues continues to be an important issue that may provide understanding of processes firmly at the nexus of homeostasis and allergic immunity.
Accession Codes
All RNA-seq and scRNA-seq data generated in this study are deposited in Gene Expression Omnibus (GEO) under accession code GSE117568.
Reporting Summary
Further information on experimental design is available in the Nature Research Reporting Summary linked to this article.
Data availability
The data that support the findings of this study are available from the corresponding author upon reasonable request.
METHODS
Mice.
Il5Red5, Arg1Yarg, and Il13Smart reporter alleles on wild-type and triple-deficient Crlf2-/-Il25-/-Il1rl1-/- C57BL/6J backgrounds were bred and maintained as described previously7,9,10,28. Il18-/- mice were obtained from The Jackson Laboratory (Stock 004130) and crossed with Il5Red5 and Il13Smart alleles to generate Il18-/- dual reporter mice. For all experiments, age-(7–14 weeks) and sex-matched mice maintained under specific pathogen-free conditions were used. For in vivo cytokine treatments, mice were injected subcutaneously with rmIL-18 (2.5 μg), rmTSLP (500 ng), and/or rmIL-33 (2.5 μg) in calcium- and magnesium-free phosphate buffered saline (PBS) or intranasally with rmIL-18 (500 ng), rmTSLP (100 ng) prior to analysis 18–24 h after injection. Germ-free C57BL/6J mice were a gift of the UCSF Gnotobiotic Core Facility. For MC903 experiments, mouse ears were treated with MC903 or ethanol for 5 consecutive days and as previously described35. All animal procedures were approved by the University of California San Francisco Institutional Animal Care and Use Committee.
Flow cytometry and cell sorting.
Single-cell suspensions from bone marrow (BM), lung, adipose tissue (fat), and small intestinal lamina propria (gut) were prepared are previously described15,18,36. For skin single-cell suspensions, pooled ear/back or back tissue was minced in RPMI-1640 with 10% FBS, then transferred to C tubes (Miltenyi Biotec), containing 5 ml of RPMI-1640 supplemented with Collagenase XI (2 mg/ml; Sigma C9407), Hyaluronidase (0.5 mg/ml; Sigma H3506), and DNAse I (0.1 mg/ml; Sigma 10104159001). Samples were shaken at 200–250 rpm for 90 min at 37 °C, then dispersed using an automated tissue dissociator (GentleMACS; Miltenyi Biotec) running program C. Single-cell suspensions were passed through a 70-μm filter and washed twice with RPMI containing 10% FBS. The following antibodies, all from BioLegend (unless otherwise specified) were used at 1:100 dilution unless noted: anti-CD3 (17A2), anti-CD4 (RM4–5), anti-CD5 (53–7.3), anti-CD8α (53–6.7), anti-CD11b (M1/70), anti-CD11c (N418), anti-CD19 (6D5), anti-CD25 (PC61), anti-CD44 (IM7), anti-CD45 (30F-11, BD Biosciences), anti-CD49b (DX5; eBiosciences), anti-CD103 (2E7), anti-CD127 (A7R34), anti-CD218 (P3TUNYA, diluted 1:200; eBiosciences), anti-F4/80 (BM8), anti-Gr-1 (RB6–8C5), anti-IL-17RB (9B10, diluted 1:20), anti-NK1.1 (PK136), anti-NKp46 (29A1.4), anti-Thy1.2 (53–2.1; diluted 1:500); anti-human CD4 (RPA-T4, diluted 1:20; eBiosciences), anti-KLRG1 (2F1; eBiosciences), anti-TSLPR (polyclonal; R&D Systems, diluted 1:20), anti-SiglecF (E50–244; BD Biosciences), anti-T1/ST2 (DJ8; MD Biosciences). Live/dead cell exclusion was performed with DAPI (4′,6-diamidine-2′-phenylindole dihydrochloride; Roche). Cell counts were performed using flow cytometry counting beads (CountBright Absolute; Life Technologies) per manufacturers instructions.
ILC2s were sorted from reporter mice as live (DAPI-), lineage-negative (CD3, CD4, CD8, CD11b, CD11c, CD19, NK1.1, NKp46, Gr-1, F4/80, Ter119, DX5) CD45+Red5+ for all tissues except for bone marrow (Lin-CD45+Thy1.2+Yarg+) and Crlf2-/-Il25-/-Il1rl1-/- small intestine ILC2s (Lin-CD45+Klrg1+Yarg+) using a MoFlo XDP (Beckman Coulter). For germ-free mice, ILC2s were sorted as Lin-CD45+Thy1.2+CD25+. Sample data were acquired with a 5-laser LSRFortessa X-20 flow cytometer and BD FACSDiva software (BD Biosciences) and analyzed using FlowJo software (Tree Star).
RNA preparation and qRT-PCR.
ILC2s from various tissues (1,000–10,000 cells per sample) were sorted into RLT Plus lysis buffer (Qiagen) and stored at -80 °C, then processed using RNeasy Micro Plus kit (Qiagen) per manufacturer’s protocol. For qPCR analyses, RNA was reverse transcribed using SuperScript VILO cDNA synthesis kit (ThermoFisher) and amplified using Power SYBR Green PCR master mix (ThermoFisher) using primers from PrimerBank as listed in Supplementary Table 2.
RNA sequencing.
Total RNA was prepared as indicated above, and quality was assessed by Agilent 2100 Bioanalyzer (Agilent Technologies). RNA-sequencing libraries were generated using the Illumina TruSeq stranded mRNA kit, according to the manufacturer’s protocol (Illumina). Library concentrations were measured using KAPA Library Quantification Kits (Kapa Biosystems), and equal amounts of indexed libraries were pooled and sequenced on the HiSeq 4000 (Illumina). Sequencing yielded ~6.5 billion reads with a mean read depth of 97.7 million reads/sample. Reads were then aligned to the Mus musculus genome and those that mapped uniquely to known mRNAs were used to assess differential expression. Differential gene expression testing was carried out using DESeq2 (doi: 10.1186/s13059-014-0550-8). DESeq2 was used to carry out pairwise comparisons between tissues with the same genotype and between genotypes in the same tissue. Additionally, DESeq2 was run using a multifactorial model to identify the general effect of each tissue on gene expression (bone marrow was modeled as the intercept), the general effect of the knockout (wild-type as the intercept) and an interaction term between the genotype and the tissue.
For single-cell RNA sequencing (scRNA-seq), ILC2s were sorted as described above into ice-cold 0.5% BSA in PBS and processed through the Chromium Single Cell 3′ v2 Library Kit (10X Genomics) per the manufacturer’s protocol. Each channel was loaded with 5,000 to 25,000 cells from each tissue, yielding between 400–11,600 single cells for analysis from each tissue. The cells were then partitioned into Gel Beads in Emulsion in the instrument, where cell lysis and barcoded reverse transcription of RNA occurred, followed by amplification, shearing, and 5′ adaptor and sample index attachment. Libraries were sequenced on an Illumina HiSeq 4000. Single Cell 3′ libraries used standard illumina sequencing primers for both sequencing and index reads and were run using paired-end sequencing with single indexing where Read1 is 26 cycles and Read 2 is 98 cycles.
The resulting bcl files were de-multiplexed using bcl2fastq2.1.7v and the resultant paired-end fastq files were aligned to the mm10 transcriptome (ftp://ftp.ensembl.org/pub/release-84/fasta/mus_musculus/dna/Mus_musculus.GRCm38.dna.primary_assembly.fa.gz, ftp://ftp.ensembl.org/pub/release-84/gtf/mus_musculus/Mus_musculus.GRCm38.84.gtf.gz) using STAR aligner which comes packaged in Cellranger toolkit (version 2.0.0) provided by 10X Genomics. Cellranger aggr was used to aggregate multiple libraries. Details of the pipeline are provided in Supplementary Table 3.
In vitro cell cultures and cytokine quantification.
Sorted ILC2s were cultured at 1500–3000 cells/well (37 °C, 5% CO2) for 24 h in 100 μl of media containing high glucose (4.5g/L) DMEM, 10% heat-inactivated FBS, 3.7g/L NaHCO3, 0.036g/L L-Asparagine, 0.116g/L L-Arginine, 0.006 g/L folic acid and supplemented with 10 mM HEPES pH 7.4, penicillin-streptomycin, and 2-mercaptoethanol (Life Technologies), plus IL-7, IL-18, IL-33, and and/or TSLP (all at 10 ng/ml; R&D Systems), or where indicated, ionomycin (500 ng/ml) and phorbol 12-myristate 13-acetate (PMA; 40 ng/ml; Sigma). Cell-free supernatants were collected after centrifugation for protein analysis, while cell pellets were resuspended and stained for flow cytometric analysis. Supernatants were assayed for IL-5 and IL-13 protein amounts using Cytometric Bead Array Flex Sets, acquired with a 5-laser LSRFortessa X-20 flow cytometer and BD FACSDiva software and analyzed using Flow Cytometric Analysis Program (FCAP) Array software (BD Biosciences).
Statistical analysis.
Results from independent experiments were pooled whenever possible, and all data were analyzed using Prism 7 (GraphPad Software) by comparison of means using unpaired two-tailed Student’s t tests. Statistical analysis for RNA-seq data is described above. Data in all figures represent mean ± s.d. unless otherwise indicated.
Methods-only References:
35. Li, M. et al. Induction of thymic stromal lymphopoietin expression in keratinocytes is necessary for generating an atopic dermatitis upon application of the active vitamin D3 analogue MC903 on mouse skin. J. Invest. Dermatol. 129, 498–502 (2009).
36. Molofsky, A. B. et al. Innate lymphoid type 2 cells sustain visceral adipose tissue eosinophils and alternatively activated macrophages. J. Exp. Med. 210, 535–549 (2013).
Supplementary Material
Acknowledgments
We thank M. Consengco and M. Ji for technical expertise, Z. Wang for cell sorting, A. Barczak, R. Barbeau, and J. Pollack for assistance with RNA-seq, E. Wan for assistance with scRNA-seq, J. Turnbaugh for providing germ-free mice, and M. Ansel and A. Marson for comments on the manuscript. This work was supported by the National Institutes of Health (AI030663 and HL128903 to R.M.L., AI122702 to J.L., DK101604 to A.B.M., AI113143 to J.C.N.), Dermatology Foundation (R.R.R.G), A.P. Giannini Foundation (R.R.R.G), Robert Wood Johnson Foundation (R.R.R.G.), Howard Hughes Medical Institute (R.M.L.), and the Sandler Asthma Basic Research Center at the University of California San Francisco (R.M.L).
Footnotes
Competing interests
The authors declare no competing interests.
Competing interests: None declared.
References
- 1.Moltke von, J. & Locksley RM I-L-C-2 it: type 2 immunity and group 2 innate lymphoid cells in homeostasis. Curr. Opin. Immunol 31, 58–65 (2014). [DOI] [PMC free article] [PubMed] [Google Scholar]
- 2.Klose CSN & Artis D Innate lymphoid cells as regulators of immunity, inflammation and tissue homeostasis. Nat. Immunol 17, 765–774 (2016). [DOI] [PubMed] [Google Scholar]
- 3.Neill DR et al. Nuocytes represent a new innate effector leukocyte that mediates type-2 immunity. Nature 464, 1367–1370 (2010). [DOI] [PMC free article] [PubMed] [Google Scholar]
- 4.Klein Wolterink RGJ et al. Pulmonary innate lymphoid cells are major producers of IL-5 and IL-13 in murine models of allergic asthma. Eur. J. Immunol 42, 1106–1116 (2012). [DOI] [PubMed] [Google Scholar]
- 5.Salimi M et al. A role for IL-25 and IL-33-driven type-2 innate lymphoid cells in atopic dermatitis. J. Exp. Med 210, 2939–2950 (2013). [DOI] [PMC free article] [PubMed] [Google Scholar]
- 6.Licona-Limón P, Kim LK, Palm NW & Flavell RA TH2, allergy and group 2 innate lymphoid cells. Nat. Immunol 14, 536–542 (2013). [DOI] [PubMed] [Google Scholar]
- 7.Van Dyken SJ et al. A tissue checkpoint regulates type 2 immunity. Nat. Immunol 17, 1381–1387 (2016). [DOI] [PMC free article] [PubMed] [Google Scholar]
- 8.Robinette ML et al. Transcriptional programs define molecular characteristics of innate lymphoid cell classes and subsets. Nat. Immunol 16, 306–317 (2015). [DOI] [PMC free article] [PubMed] [Google Scholar]
- 9.Simoni Y et al. Human Innate Lymphoid Cell Subsets Possess Tissue-Type Based Heterogeneity in Phenotype and Frequency. Immunity 46, 148–161 (2017). [DOI] [PMC free article] [PubMed] [Google Scholar]
- 10.Gury-BenAri M et al. The Spectrum and Regulatory Landscape of Intestinal Innate Lymphoid Cells Are Shaped by the Microbiome. Cell 166, 1231–1246.e13 (2016). [DOI] [PubMed] [Google Scholar]
- 11.Nussbaum JC et al. Type 2 innate lymphoid cells control eosinophil homeostasis. Nature 502, 245–248 (2013). [DOI] [PMC free article] [PubMed] [Google Scholar]
- 12.Huang Y et al. S1P-dependent interorgan trafficking of group 2 innate lymphoid cells supports host defense. Science 359, 114–119 (2018). [DOI] [PMC free article] [PubMed] [Google Scholar]
- 13.Bando JK, Nussbaum JC, Liang H-E & Locksley RM Type 2 innate lymphoid cells constitutively express arginase-I in the naive and inflamed lung. J. Leukoc. Biol 94, 877–884 (2013). [DOI] [PMC free article] [PubMed] [Google Scholar]
- 14.Liang H-E et al. Divergent expression patterns of IL-4 and IL-13 define unique functions in allergic immunity. Nat. Immunol 13, 58–66 (2011). [DOI] [PMC free article] [PubMed] [Google Scholar]
- 15.Moltke von, J., Ji M, Liang H-E & Locksley RM Tuft-cell-derived IL-25 regulates an intestinal ILC2-epithelial response circuit. Nature 529, 221–225 (2016). [DOI] [PMC free article] [PubMed] [Google Scholar]
- 16.Bando JK, Liang H-E & Locksley RM Identification and distribution of developing innate lymphoid cells in the fetal mouse intestine. Nat. Immunol 16, 153–160 (2015). [DOI] [PMC free article] [PubMed] [Google Scholar]
- 17.Shih H-Y et al. Developmental Acquisition of Regulomes Underlies Innate Lymphoid Cell Functionality. Cell 165, 1120–1133 (2016). [DOI] [PMC free article] [PubMed] [Google Scholar]
- 18.Van Dyken SJ et al. Chitin activates parallel immune modules that direct distinct inflammatory responses via innate lymphoid type 2 and γδ T cells. Immunity 40, 414–424 (2014). [DOI] [PMC free article] [PubMed] [Google Scholar]
- 19.Molofsky AB et al. Interleukin-33 and Interferon-γ Counter-Regulate Group 2 Innate Lymphoid Cell Activation during Immune Perturbation. Immunity 43, 161–174 (2015). [DOI] [PMC free article] [PubMed] [Google Scholar]
- 20.Moltke von, J. et al. Leukotrienes provide an NFAT-dependent signal that synergizes with IL-33 to activate ILC2s. J. Exp. Med 214, 27–37 (2017). [DOI] [PMC free article] [PubMed] [Google Scholar]
- 21.Cardoso V et al. Neuronal regulation of type 2 innate lymphoid cells via neuromedin U. Nature 549, 277–281 (2017). [DOI] [PMC free article] [PubMed] [Google Scholar]
- 22.Saluzzo S et al. First-Breath-Induced Type 2 Pathways Shape the Lung Immune Environment. Cell Rep 18, 1893–1905 (2017). [DOI] [PMC free article] [PubMed] [Google Scholar]
- 23.Schneider C et al. A Metabolite-Triggered Tuft Cell-ILC2 Circuit Drives Small Intestinal Remodeling. Cell 174, 271–284.e14 (2018). [DOI] [PMC free article] [PubMed] [Google Scholar]
- 24.Guo L, Junttila IS & Paul WE Cytokine-induced cytokine production by conventional and innate lymphoid cells. Trends Immunol 33, 598–606 (2012). [DOI] [PMC free article] [PubMed] [Google Scholar]
- 25.Mohapatra A et al. Group 2 innate lymphoid cells utilize the IRF4-IL-9 module to coordinate epithelial cell maintenance of lung homeostasis. Mucosal Immunol 9, 275–286 (2016). [DOI] [PMC free article] [PubMed] [Google Scholar]
- 26.Kim BS et al. TSLP elicits IL-33-independent innate lymphoid cell responses to promote skin inflammation. Sci Transl Med 5, 170ra16–170ra16 (2013). [DOI] [PMC free article] [PubMed] [Google Scholar]
- 27.Konishi H et al. IL-18 contributes to the spontaneous development of atopic dermatitis-like inflammatory skin lesion independently of IgE/stat6 under specific pathogen-free conditions. Proceedings of the National Academy of Sciences 99, 11340–11345 (2002). [DOI] [PMC free article] [PubMed] [Google Scholar]
- 28.Thijs J et al. Biomarkers for atopic dermatitis: a systematic review and meta-analysis. Curr Opin Allergy Clin Immunol 15, 453–460 (2015). [DOI] [PubMed] [Google Scholar]
- 29.Zedan K et al. Immunoglobulin e, interleukin-18 and interleukin-12 in patients with atopic dermatitis: correlation with disease activity. J Clin Diagn Res 9, WC01–5 (2015). [DOI] [PMC free article] [PubMed] [Google Scholar]
- 30.Ferreira MA et al. Shared genetic origin of asthma, hay fever and eczema elucidates allergic disease biology. Nature Genetics 49, 1752–1757 (2017). [DOI] [PMC free article] [PubMed] [Google Scholar]
- 31.Demenais F et al. Multiancestry association study identifies new asthma risk loci that colocalize with immune-cell enhancer marks. Nature Genetics 50, 42–53 (2018). [DOI] [PMC free article] [PubMed] [Google Scholar]
- 32.Steer CA et al. Group 2 innate lymphoid cell activation in the neonatal lung drives type 2 immunity and allergen sensitization. J. Allergy Clin. Immunol 140, 593–595.e3 (2017). [DOI] [PubMed] [Google Scholar]
- 33.Mass E et al. Specification of tissue-resident macrophages during organogenesis. Science 353, aaf4238–aaf4238 (2016). [DOI] [PMC free article] [PubMed] [Google Scholar]
- 34.Kotas ME & Locksley RM Why Innate Lymphoid Cells? Immunity 48, 1081–1090 (2018). [DOI] [PMC free article] [PubMed] [Google Scholar]
Associated Data
This section collects any data citations, data availability statements, or supplementary materials included in this article.
Supplementary Materials
Data Availability Statement
The data that support the findings of this study are available from the corresponding author upon reasonable request.