Abstract
Objective:
We devise a data-driven framework to assess the level of consciousness in etiologically heterogeneous comatose patients using intrinsic dynamical changes of resting-state Electroencephalogram (EEG) signals.
Methods:
EEG signals were collected from 54 comatose patients (GCS≤8) and 20 control patients (GCS>8). We analyzed the EEG signals using a new technique, termed Intrinsic Network Reactivity Index (INRI), that aims to assess the overall lability of brain dynamics without the use of extrinsic stimulation. The proposed technique uses three sigma EEG events as a trigger for ensuing changes to the directional derivative of signals across the EEG montage.
Results:
The INRI had a positive relationship with GCS and was significantly different between various levels of consciousness. In comparison, classical band-limited power analysis did not show any specific patterns correlated to GCS.
Conclusions:
These findings suggest that reaching low variance EEG activation patterns becomes progressively harder as the level of consciousness of patients deteriorate, and provide a quantitative index based on passive measurements that characterize this change.
Significance:
Our results emphasize the role of intrinsic brain dynamics in assessing the level of consciousness in coma patients and the possibility of employing simple electrophysiological measures to recognize the severity of disorders of consciousness (DOC).
Keywords: Consciousness, Traumatic Brain Injury, Coma, Electroencephalography, Intrinsic Dynamics, Intrinsic Network Reactivity Index (INRI)
1. Introduction
Coma and other disorders of consciousness (DOC) is associated with profound reductions in wakefulness and awareness (Bruno et al., 2011; Giacino et al., 2014; Laureys, 2005). Linking these behavioral markers with specific injury attributes remains a persistent clinical challenge (McGee et al., 2016). Electroencephalographic recordings offer the potential to help to disassociate underlying causes of DOC by revealing systematic electrophysiological correlates of injury and behavior (Sitt et al., 2014; Sebastiano et al., 2015). However, patients in coma exhibit substantial heterogeneity in etiology, including injury type and location. Moreover, these patients are often managed with pharmacological agonists that themselves produce electrophysiological effects (Blume, 2006). Thus, realizing the potential of EEG as a diagnostic tool has a number of practical challenges (Wijnen & van Boxtel, 2010; Cruse & Young, 2016).
The most traditional approach to EEG biomarker development involves spectral analysis of band-limited power, i.e., the assessment of rhythmicity and neural oscillations (Buzsáki & Draguhn, 2004), sometimes referred to as Quantitative EEG (QEEG). Examples of this approach for diagnosing disorders of consciousness includes the absence of blink-related delta oscillations in DOC patients (Bonfiglio et al., 2013, 2014), a positive correlation between Coma Recovery Scale-Revised (CRS-R) and ratios between frequencies above 8 Hz and frequencies below 8 Hz (Lechinger et al., 2013), higher theta/alpha and lower delta power of minimally conscious state (MCS) patients compared to vegetative state/unresponsive wakefulness syndrome (VS/UWS) patients (Piarulli et al., 2016), and lower alpha power in UWS and MCS patients (Naro et al., 2016).
However, such an approach could be prone to confound since sedative drugs, in particular, produce well-defined but wide-ranging changes in rhythmic activity (Carboncini et al., 2014). Nevertheless, those studies relying on spectral analysis could be informative for well-constrained patient populations. Alternatively, EEG analysis can be performed in an active, perturbational framework wherein stimuli are delivered to the patient, and electrophysiological responses are characterized (Guerit, 2010; Risetti et al., 2013; Kotchoubey, 2017). The premise of such an approach, which includes canonical examples such as EEG reactivity and event-related potentials (ERPs), is that it captures the responsiveness of the brain in a basal, primitive way. A less responsive/reactive brain is, ostensibly, less able to support normal cognitive function. Indeed, reactivity and related measures have been shown to be informative with respect to behavioral deficits associated with DOC (Cruse et al., 2016).
This perturbational approach has been previously used in characterizing the EEG response to an oddball paradigm (Kotchoubey et al., 2005), where the authors show that severely brain-damaged but conscious patients demonstrate much more electrophysiological signs of intact cortical processing than the persistent vegetative state (PVS) and minimally conscious state (MCS) patients. Along the same lines, Cavinato and his co-authors used an oddball paradigm with different levels of stimulus complexity and compared the latencies and amplitudes of N1 and P3 waves between six VS, eleven MCS, and ten control subjects (Cavinato et al., 2011). According to their results, healthy controls and MCS patients showed a progressive increase of P3 latency in relation to the level of stimulus complexity, whereas no modulation of P3 latency was observed in the vegetative patients. Using nonlinear features of EEG signals such as cross-approximate entropy (C-ApEn), Wu and his co-authors investigate the cortical response to painful and auditory stimuli (Wu et al., 2011b,a), and showed that the interconnection of local and distant cortical networks in MCS is superior to PVS group. In a more recent effort, Binder has studied the relationship of the phase-locking index (PLI) of 40 Hz auditory steady-state response (ASSR) with Coma Recovery Scale-Revised (CRS-R) and found that there is a correlation between these two measures (Binder et al., 2017).
However, such perturbational methods bring about their own set of challenges in the context of DOC patients. The inter-pretability of ERP studies involving a single sensory modality may be compromised due to etiological heterogeneity (Kotchoubey, 2017), and their robustness in differentiating various degrees of consciousness is subject to debate (Kotchoubey et al., 2005; Höller et al., 2011; Real et al., 2016). Alternatively, approaches involving direct (e.g., electromagnetic) stimulation of the cortex (Bagnato et al., 2012; Rosanova et al., 2012; Casali et al., 2013; Zhang et al., 2017), while conceptually more favorable, raise the instrumentation burden substantially and are thus not ideal for routine clinical assessment. More comprehensive reviews of the previous findings in detecting signs of consciousness using electrophysiological methods can be found in (Sitt et al., 2014; Rapp et al., 2015; Sebastiano et al., 2015; Cruse et al., 2016; Estraneo et al., 2016; Ragazzoni et al., 2017).
In this work, we seek to develop an objective EEG-based assay that can reliably differentiate injury severity and behavioral deficits in the face of etiological and pharmacological heterogeneity. Doing so would have at least two impacts. Foremost, such an assay would reveal fundamental electrophysiological features associated with DOC, ones that specifically are robust to the confounding effects of neurally active drugs. Further, such an assay would provide means to more objectively assess patients for whom traditional bedside behavioral exams are ineffective (Andrews et al., 1996; Schnakers et al., 2009; Sanders et al., 2012). Our goal is to devise a strategy that can offer an EEG-based assessment of brain responsiveness in resting state, without the need for extrinsic stimulation. Although there have been previous attempts to reach this goal (Bai et al., 2017), these attempts have been mostly based on information-theoretic (Pollonini et al., 2010; Sarà & Pistoia, 2010; Gosseries et al., 2011; King et al., 2013; Marinazzo et al., 2014; Thul et al., 2016) or graph-theoretic (Lehembre et al., 2012; Leon-Carrion et al., 2012; Chennu et al., 2014; Höller et al., 2014; Varotto et al., 2014; Chennu et al., 2017; Numan et al., 2017) metrics, which do not provide direct information about the underlying neuronal dynamics. Furthermore, the majority of these studies focus on distinguishing minimally conscious patients from patients in vegetative state. However, consciousness is a state on a continuous spectrum (Laureys, 2004), and detecting subtle changes of consciousness using neuroimaging and electrophysiological techniques remains an open question.
Here, we treat the analysis of EEG using formalisms from dynamical systems theory and the notion of reachability (Jurdjevic, 1997). This notion of intrinsic brain network reactivity is intended to holistically characterize the lability of the brain by describing the ability of rare electrophysiological events to create low probability excursions in neural activity, or, how easily the EEG is able to ‘reach’ a diverse set of patterns. Thus, the technical innovation of this paper is a method to estimate EEG reactivity without explicit delivery of exogenous stimuli. We introduce the Intrinsic Network Reactivity Index (INRI) by using three sigma events as an internal reactivity trigger and quantify the reachability of response states to these events.
2. Materials and Method
2.1. Data Description
We collected retrospective data including EEG and complete medical records from 54 comatose patients and 20 control subjects (GCS>8) over the course of three years (2013-2016). The patients underwent EEG recording for routine monitoring purposes in the Neurological and Neurosurgical Intensive Care Unit (NNICU) at Barnes-Jewish Hospital, which is affiliated with Washington University School of Medicine in St. Louis. Each patient underwent one recording session with exceptions of four patients for whom two recordings were performed. EEG data were acquired using 19 electrodes positioned according to the standard 10-20 system of electrode placement. The recording was performed for at least fifteen minutes for each patient. The original signals were recorded against a common reference electrode and re-referenced to 18 bipolar channels (FP1-F7, F7-T7, T7-P7, P7-O1, Fp1-F3, F3-C3, C3-P3, P3-O1, Fz-Cz, Cz-Pz, Fp2-F4, F4-C4, C4-P4, P4-O2, Fp2-F8, F8-T8, T8-P8, and P8-O2) to reduce the sensitivity of EEG signals to external noise (Osselton, 1965). The signals were recorded at either 250 or 500 Hz. Table 1 provides a summary of the study population including age, gender, injury type, injury location, and Glasgow coma scale (GCS), which was collected as part of the clinical routine. In case of the intubated patients, the verbal score was estimated from the motor score and eye score using the linear regression model VerbalScore = −0.3756 + MotorScore * (0.5713) + EyeScore * (0.4233) as described in (Meredith et al., 1998). The study was approved by the ethics committee of Washington University in St. Louis and conducted in accordance with the declaration of Helsinki.
Table 1:
Summary of the study population.
| Variable | Distribution |
|---|---|
| Age | 57 ±19 |
| Gender | Male (32) and Female (22) |
| Injury Type | Focal (16), Diffuse (23), Mix (15) |
| Injury Location | Left (11), Right (18), Bilateral (15), Unknown (10) |
| GCS at time of EEG | Score Three (12), Score Four (8), Score Five (3), Score Six (10), Score Seven (20), Score Eight (5) |
2.2. Data Preprocessing
EEG preprocessing steps include removing large amplitude and eye blink artifacts by visual inspection (Stern, 2005; Britton et al., 2016), downsampling, bandpass filtering the data, and standardization, which were all implemented in MATLAB using in-house code. More specifically, sections of the data with artifacts were discarded (approximately 6.8%), and the data that was initially recorded at 500 Hz was downsampled to 250 Hz to make the sampling rate of all the recordings consistent. Next, a Hamming window-based finite impulse response (FIR) bandpass filter was used to filter the signals into the 1 – 45 Hz frequency range. Finally, EEG signals from each cahnnel were standardized to zero mean and unit variance by taking out the mean and dividing by standard deviation (X = (X – μ)/(σ)) (Guyon & Elisseeff, 2006).
2.3. Quantifying Intrinsic Dynamics
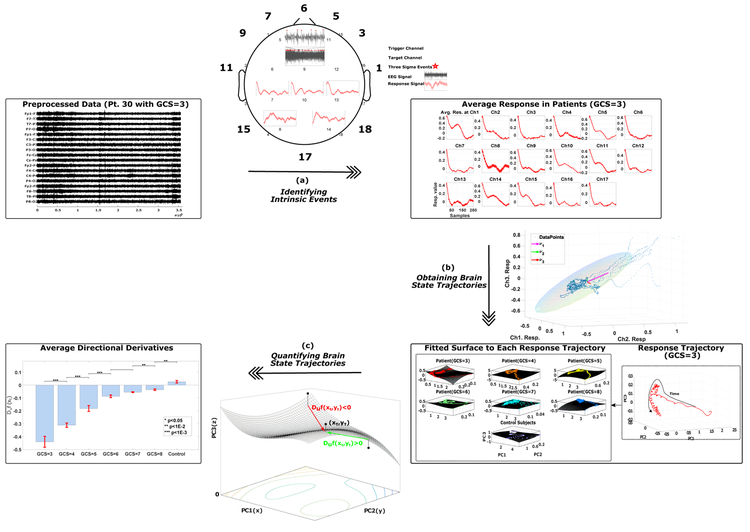
Calculating the Intrinsic Network Reactivity Index (INRI) involves three main steps of identifying intrinsic events, obtaining brain state trajectories, and quantifying the brain state trajectories (Figure 1). Each of these steps is discussed in the following subsections.
Figure 1:
The calculation of Intrinsic Network Reactivity Index (INRI) includes three main steps of (a) identifying intrinsic events, (b) obtaining brain state trajectories, and (c) quantifying the brain state trajectories. In (a), each channel is recursively selected as a trigger channel, and a typical response to three sigma events (+3σ) of this trigger channel in rest of the channels (target channels) is calculated. Next, the resulting response signals are averaged for each subject group (in this case different GCS values and control subjects). In (b), the typical response signals from the previous step are collapsed into three dimensions using principal component analysis. Finally, in (c), the three-dimensional data of the previous step is quantified by fitting a surface to the absolute value of obtained trajectories and calculating the directional derivative of the projection of trajectory points on the fitted surface in the direction of the final point in the time domain.
2.3.1. Identifying Intrinsic Events
After the data has been preprocessed, we would like to capture the typical response to intrinsic (in this case three sigma) events. In order to do this, we select one channel at a time as a trigger channel (where the intrinsic events occur) and then calculate the response to these intrinsic events in rest of the channels (target channels). More specifically, after the data has been preprocessed, we start selecting one channel at a time from each patient’s recording to serve as the trigger channel, and all the points that are more than three standard deviations away from the signal mean in this selected trigger channel are identified. These points are marked as intrinsic events, and a window of length w = 1s following these intrinsic events is defined. Next, the corresponding windows in the other recorded channels (target channels) of the same recording are identified and averaged to obtain a response signal for each target channel with regards to a specific trigger channel. The procedure is iterated by defining each channel as a trigger, then aggregating the responses from different target channels into one 18-dimensional prototypical response trajectory. Finally, the obtained typical responses are averaged across different subject groups. Figure 2 shows one iteration of the intrinsic event identification, where channel nine is selected as the trigger channel, and the response in five target channels {7, 8, 10, 13, 14} to the three sigma events in channel nine are represented.
Figure 2:
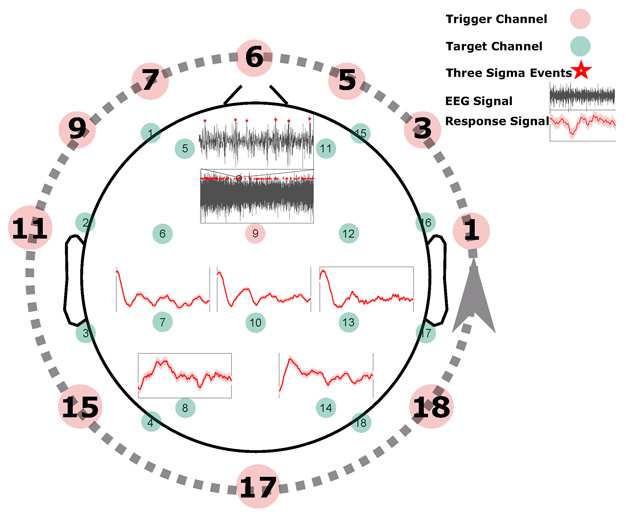
Identifying intrinsic events. To extract the intrinsic events, for each channel selected as a trigger channel (here channel nine), the data points that are more than three standard deviations away from the signal mean in the positive direction (+3σ) are identified (marked by red stars). Next, a window of length w (in this case one second) that follows the identified events is defined, and the corresponding windows in the remaining (target) channels are identified. For each target channel, all the marked windows are averaged to obtain a single response signal for that channel based on the selected trigger channel (shown by red curves here for channels {7, 8, 10, 13, 14}). This process is repeated until each channel is selected as a trigger channel once (represented by a dashed line here), and then the response signals to different trigger channels are averaged to get a typical response signal for each target channel. Finally, the resulting response signals are averaged for each subject group.
2.3.2. Obtaining Brain State Trajectories
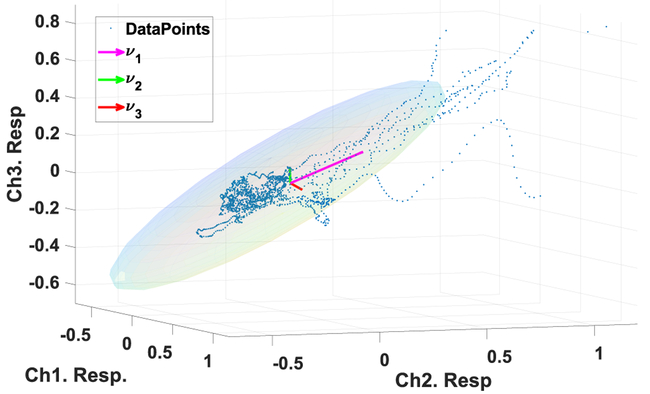
The 18-dimensional target response for each subject group is collapsed into three dimensions using principal component analysis (PCA). The principal component analysis is a statistical procedure that applies an orthogonal transformation to uncorrelate possibly correlated variables. PCA decomposes the original data X ∈ RN×M into uncorrelated components using a transformation matrix W and sorts them according to the variance explained by each component (Bishop, 2006). In this case, our X is the averaged responses in different target channels, N = 18 is the number of channels, and M = 250 is the length of averaged responses (w = 1s). Instead of applying the entire PCA transformation matrix, generally, the first k columns of the W matrix that explain a certain percentage of the variance in the signal is used. In this case, PCA acts as a dimensionality reduction method and reduces the dimension of the original data while retaining as much variance in the dataset as possible (Figure 3). Here we have used k = 3, which provides the first three principal components that explain 97.83% of the variance in our data.
Figure 3:
Obtaining brain state trajectories. To obtain the brain state trajectories PCA is used to reduce the 18-dimensional average responses (here 3-dimensional for visualization purpose) extracted in Section 2.3.1. Each point in this plot shows the averaged responses in three target channels to three sigma events. The three arrows show the direction of eigenvectors with the highest eigenvalues (in this case λ3 < λ2 < λ1), which represent the variance of the data in the direction of the eigenvectors. The ellipsoid is a characterization of the covariance of the data where the angle of the ellipsoid is determined by the interdependency between data points from different channels, and the magnitudes of the ellipsoid axes depend on the variance of the data.
2.3.3. Quantifying the Brain State Trajectories
The end result of the first two INRI steps is a threedimensional trajectory that captures the average evoked response (trigger channel to target channels) for each GCS value. As a final step, in order to quantify the lability of the obtained three-dimensional state trajectories for different groups of subjects, a numerical method is used where first a polynomial surface with degree d = 3 (Equation 1) is fitted to the absolute value of each point in the trajectories of each subject group (in this case x and y are the absolute values of the trajectory point coordinates in PC1 and PC2, respectively).
| (1) |
Next, given that zt = f(xt, yt) is the projection of each trajectory point on the fitted surface f, the directional derivative provides the rate of change of z in the direction of the unit vector . In our case, the direction of the unit vector is towards the last point of the trajectories in the time domain as described in Equation 2.
| (2) |
Hence, given the definition of directional derivatives for each point at time t, we have:
| (3) |
In practice, it is difficult to calculate the limit in Equation 3 and often the directional derivatives are calculated using the gradient as shown in Equation 4 (Simmons & Simmons, 1996).
| (4) |
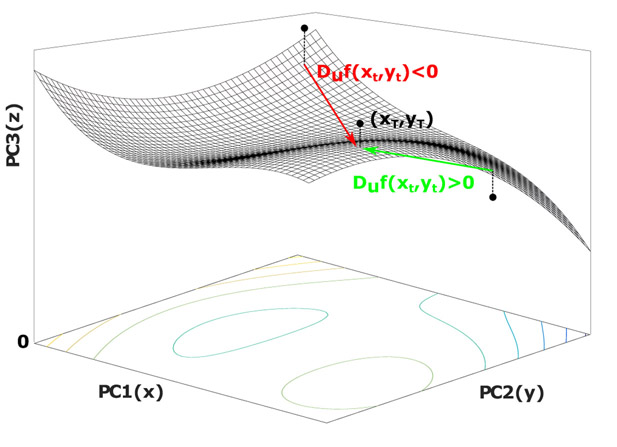
The calculated value gives the slope of our surface (z = f(x, y)) when standing at the point (xt, yt) and facing the direction of the final trajectory point in the time domain (). Hence, the positive value here means the value of z is increasing in the direction of when moving through (xt, yt), which implies an increase of PC3 component relative to PC1 and PC2. In other words, if we are standing at point (xt, yt) and moving towards the final point in the trajectory (xT, yT), a positive directional derivative means the next step we take will be towards a larger z value within the landscape of our surface (moving uphill). Since z is the absolute value of the PC3 component, using directional derivatives we are capturing the extent to which a given trajectory moves towards PC3 (See Figure 4). Given that PC3 is the low variance component (λ3 < λ2 < λ1), such movement towards larger z values in the positive PC3 domain implies moving to a lower variance region of the state space, which we posit to reflect greater lability in the underlying brain dynamics.
Figure 4:
Quantifying the brain state trajectories. To quantify the lability of the obtained three-dimensional state trajectories, first a surface (z = f (x, y)) is fitted to the absolute value of points in the trajectory. Next, at each projected point on the surface, the directional derivative in the direction of the final point in the trajectory (xT, yT) is calculated, which provides the rate of change of z in this direction.
3. Results
3.1. Intrinsic Network Reactivity Disambiguates Levels of Consciousness
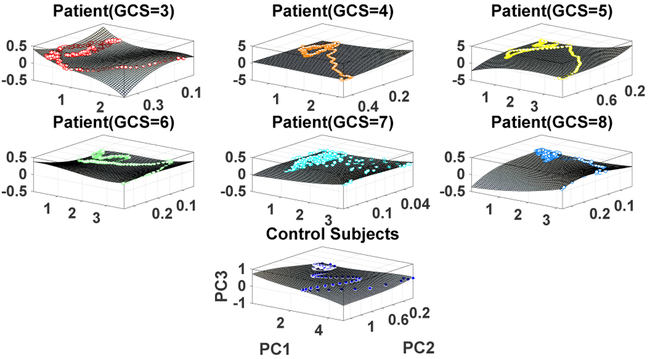
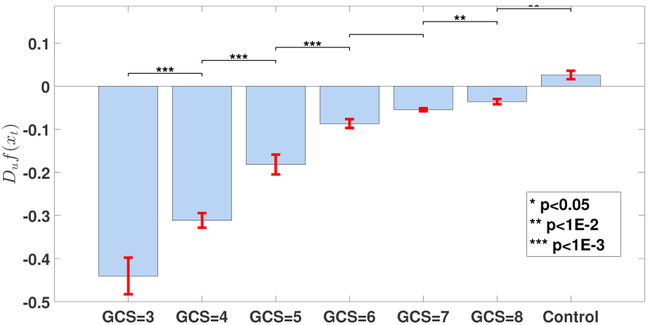
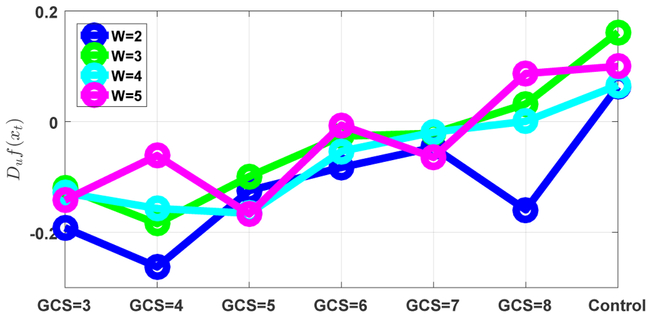
Figure 5 shows the obtained state space trajectories and the fitted surface plots for each subject group. It is clear that the state space trajectories differ between subject groups. In order to quantify these differences, the intrinsic network reactivity index was calculated for each subject group. As shown in Figure 6, the INRI values between each consequent patient groups (such as GCS = 5, 6) was significantly different (multiple comparison test (Tukey-Kramer) of Kruskal-Wallis ranks), except for patient groups GCS = 6, 7. Of note, the sign of the INRI value was negative except for the control subjects, consistent with a severity-dependent contraction in the space of electrical activity that can be supported in these (injured) brains. To check the robustness of these results, we also conducted a sensitivity analysis in terms of different window sizes as shown in Figure 7. The overall trend of increasing directional derivative values with respect to GCS scores is persistent for different window sizes, but there are also slight divergences due to the noisy nature of EEG signals.
Figure 5:
Intrinsic activity trajectories and their corresponding surface plots. Each color represents one subject group, and each point represents one time point of the averaged response from all target channels collapsed into three dimensions using PCA.
Figure 6:
Comparison of the calculated INRI values for various subject groups. Each bar plot is expressed as mean ± standard error, and the significance level of comparing each consequent pair using multiple comparison test (Tukey-Kramer) of Kruskal-Wallis ranks is shown at the top of each bar plot. The p-values from left to right are p = {4.00e−08, 1.09e−04, 5.50e−07, 1.00e+00, 9.90e−03, 3.62e−03}
Figure 7:
The sensitivity of the INRI values to various window sizes. The overall increasing trend of the INRI values with respect to GCS scores is persistent, but there are also some divergences due to the noisy nature of EEG signals.
3.2. INRI is Robust to Etiological and Pharmacological Heterogeneity
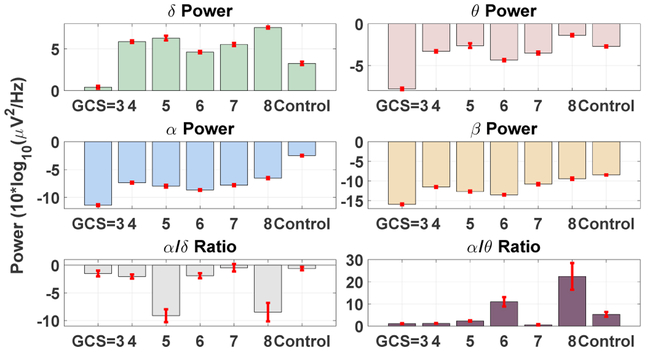
A key premise of the proposed measure is that it captures a fundamental aspect of neural circuit dynamics: their responsiveness to perturbation. This contrasts conventional studies of macro-scale brain signals that focus on characterization of the rhythmic electrophysiological activity. As a consequence, we hypothesized that our method would be robust to the heterogeneous effects of coma etiology and concurrent pharmacology that might confound oscillatory EEG assays. To emphasize this point, we derived several traditional quantitative EEG parameters based on spectral analysis on our dataset. More specifically, we estimated the multi-taper time-frequency spectrum (Babadi & Brown, 2014) using a 20 second moving window with 50% overlap and took the average of the power spectrum within each predefined frequency band (δ[0.5 – 4Hz], θ[4 – 8Hz], α[8 – 12Hz], and β[16 – 32Hz]) for all the channels. The selected frequency bands are based on the common frequency ranges used in quantitative EEG analysis (Lehembre et al., 2012). The EEG data was locally detrended prior to the power spectrum estimations, and the secondary measures such as α/δ ratio (Husain & Sinha, 2017; LaRoche & Hiba Arif Haider, 2018) were calculated based on the estimated band-limited power of the signals. The mean and standard error of the band-limited signal power and secondary measures for each patient group is provided in Figure 8. As shown, the average band-limited power of the signals in the canonical EEG bands does not reveal any systematic relationship with the level of consciousness in our patient cohort. Secondary indices based on spectral analysis, such as the alpha/delta ratio, similarly exhibit no relationship with GCS.
Figure 8:
Classical band-limited power analysis at different frequency bands fails to capture the subtle intrinsic brain dynamic changes that differentiate the levels of consciousness in comatose patients.
It should be noted that analyzing EEG signals at different frequency bands is one of the most conventional ways of examining rhythmicity of the EEG signals. However, here we are proposing a different perspective of analyzing the EEG signals based on the notion of reachability in dynamical systems. While one could, in principle, apply our proposed analysis to filtered (band-limited) versions of the EEG, the outcome of such a step would be difficult to interpret. This is because many effects on the trajectory of a dynamical system may not be restricted to a narrow frequency band (hence, the very motivation for exploring trajectory-based analysis).
3.3. The INRI is Scalable to Large Datasets
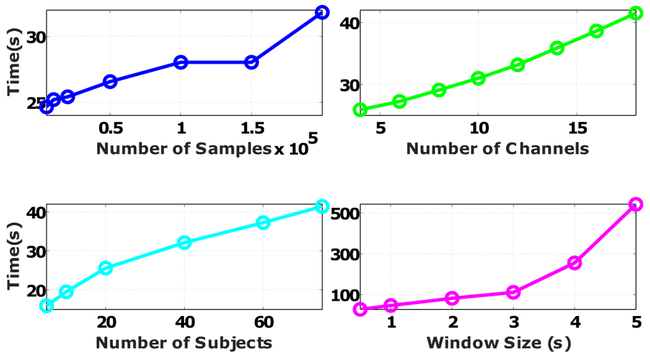
In this section, we test the scalability of the proposed method in terms of different aspects of data size. Instead of providing the theoretical upper bound for the complexity of the INRI calculation, we provide the actual runtime because the actual runtime depends on many factors such as the processor type, memory speed, and the computer architecture that are not captured in the algorithm complexity analysis. Figure 9 provides the actual runtime increase as a function of the number of channels, number of samples, number of patients, and window size. Based on the results, the length of the moving window has the largest impact on the increase of computational time, which is mainly because of the time needed to fit the surface and calculate the directional derivatives for a larger number of trajectory points.
Figure 9:
Scaling of the proposed method in terms of the number of channels, number of samples, number of subjects, and window size. For each factor, we either changed the original data size (18 Channels, 78 subjects, 390140 ± 192070 samples) or the default parameter setting (window size of one second). All the implementations were done in MATLAB R2016a using a Windows 10 PC with Intel Core i7-6700 CPU and 16 Gigabytes of DDR3 RAM.
4. Discussion
This study complements current efforts to identify fundamental neural circuit mechanisms underpinning different levels of consciousness in brain-injured patients. To this end, we investigated the plausibility of using a new notion of intrinsic brain dynamics to distinguish different levels of consciousness in severe coma cases, with an eye toward robustness in the face of etiological and pharmacological confounds. To the authors’ best knowledge, this is the first demonstration of the discriminative power of intrinsic brain dynamics extracted from resting state EEG recordings in distinguishing different levels of consciousness in severe cases of coma. We specifically developed a new EEG measure (intrinsic network reactivity index) that captures the lability of brain dynamics, conceptually similar to EEG reactivity but acting only on passively recorded data. Through this index, we showed that the lability of brain dynamics decreases with the level of consciousness.
4.1. Generalization of Intrinsic Event Detection and Clinical Applications
In the current paper, we have shown that the INRI is able to confer information about the severity of brain injury. It is important to note, though, that the best use-cases for this method are likely not in the realm of severity assessment since for many of these patients administering bedside behavioral assays is routine. Rather, the purpose of our results is to highlight that it is possible to extract fundamental information about brain dynamics, analogous to reactivity, using a strictly passive (resting state) paradigm. Most critically, the INRI framework is highly generalizable.
For instance, the INRI can be generalized to other formulations of trigger detection. That is, in our work we consider a simple three sigma criteria to identify moments in time from which evoked trajectories are calculated. However, more elaborate criteria could also be considered, e.g., defining trigger events as those moments when a particular waveform complex is observed. Similarly, the notion of the evoked trajectory could be abstracted. One can envision these generalizations being useful for applications such as injury localization, or estimation of focal sources of aberrant electrophysiological dynamics such as during states of seizure. For the specific purposes herein we found that the most basic formulation of detector criterion and evoked trajectory were sufficient to yield confirmation of our hypothesis.
4.1. Interpreting the INRI in Terms of Dynamical Systems and Reachability
The formulation of the proposed INRI measure is straight-forward: as opposed to the conventional reactivity design, involving delivery of exogenous sensory (or, more recently, electrical/magnetic) stimuli, we consider the extent to which particular channels ‘evoke’ rare responses through the measured montage. This framework has a particular interpretation if we consider the EEG as observations of an underlying dynamical system. In this scenario, any given time point t generates a (noisy) measurement of the state of the system. An assessment of reachability ascertains those states that can be realized or induced within some standardized time frame. For example, if the reachable set of states is small, then the system can do very little in response to an internally or externally generated stimulus. Thus, reachability is the formal mathematical analog to EEG reactivity.
Unfortunately, for all but the most idealized systems (specifically, those systems whose dynamics are linear), reachability calculations are notoriously difficult. Further, these calculations rely on the availability of a mathematical model for the system at hand. While such models can and have been postulated for EEG, they are certainly not linear (Fell et al., 1996; Stam et al., 1999; Stam, 2005). Thus, we desire a data-driven approach that can estimate a surrogate for the set of reachable states based on EEG recordings. This is precisely what the proposed INRI measure does. Specifically, we project each intrinsically evoked EEG response trajectory on a three-dimensional basis obtained by PCA. The basis vectors (i.e., the PCs) are ranked according to the amount of variance they capture about the full collection of trajectories across patients. Our INRI measure, by means of the directional derivative, attempts to capture the extent to which a given trajectory moves towards PC3, a low variance component. If it does, then the trajectory in question tends toward a rarer morphology, which we interpret as embodying circuit lability. As such, the INRI quantifies the ‘maneuverability’ of underlying neural circuits to make difficult (low variance) state transitions. In this setting, our findings suggest that the maneuverability of the brain decreases as the level of consciousness of patients deteriorates (lower GCS value), which could indicate a form of neuroprotection against the brain injury.
It is worth noting that there is significant prior work on the development of time-series analysis techniques for the characterization of EEG signals, including in the context of DOC. In particular, effort has been directed toward the assessment of signal ‘complexity’ (Gonzalez Andino et al., 2000; Gao et al., 2011; Tang et al., 2015) under the premise that such complexity decreases with the level of consciousness (Schartner et al., 2015). Many of these techniques, such as the perturbational complexity index (Bodart et al., 2017), approximate entropy (Gosseries et al., 2011) and weighted symbolic mutual information (King et al., 2013), enact a probabilistic quantification of the observed time series (the PCI also requires the application of external cortical stimulation). Other techniques, more conceptually similar to ours, treat EEG signals as trajectories of a dynamical system (e.g., Lyapunov exponents (Gallez & Babloyantz, 1991) and other data-driven attractor quantification methods, reviewed in (Pradhan & Dutt, 1993; Stam, 2005; Peng et al., 2009; Khanmohammadi, 2017)). The analysis we have put forth in this paper is distinct from these other efforts insofar as it attempts to explicitly quantify the responsiveness of the underlying neural circuit, as opposed to the complexity of the ongoing activity per se (e.g., the ongoing activity may be simple, yet highly responsive). Nonetheless, the INRI measure can also be viewed as a type of complexity characterization, where higher levels of reachability to low variance states could be interpreted as more complex phenomena.
4.3. Limitations and Future Directions
Despite the encouraging results, several limitations should be considered when interpreting the results of this study. First and foremost, the Glasgow coma scale used here is far from perfect for assessing the conscious state of coma patients (Dong & Cremer, 2011). It has limited capability in capturing the clinically relevant features and suffers from inter-rater inconsistency. Several alternatives to GCS such as Full Outline of UnResponsiveness (FOUR) score (Wijdicks et al., 2005) have been proposed. Along the same lines, we have only used the total Glasgow coma scale in this study, whereas GCS is comprised of three different subscores that could provide additional information about the patient’s condition. For example, patients one and three in our study had the same total GCS value whereas their scores on verbal and motor responses were different. Such a heterogeneous patient population may necessitate more sophisticated methods to take into account the intersubject variations of neuronal dynamics in order to make the method suitable for subject level analysis. Finally, pharmacological heterogeneity was not formally assessed in this study, but analyzing such heterogeneity could provide new insights into specific modulations of neural dynamics in comatose patients.
In summary, we provided a simple measure that can distinguish different levels of consciousness in severe coma patients without requiring any cooperation from the patient (in this case response to external stimuli). Future studies will be aimed at extending the proposed method to subject level analysis, using intrinsic brain dynamics to localize the brain injury, and exploring the possible correlations of intrinsic brain dynamics with the recovery of consciousness in comatose patients (prognosis).
Highlights.
Intrinsic brain dynamics distinguish different levels of consciousness in comatose patients.
Reaching low variance EEG activation patterns becomes harder for lower levels of consciousness.
The Intrinsic Network Reactivity Index is robust to etiological and pharmacological heterogeneity.
Acknowledgments
This work is primarily supported by the grant #1R21-NS096590-01A1 from the National Institutes of Health (NIH). Other sources of support include Air Force Office of Scientific Research (AFOSR YIP 15RT0189), National Science Foundation (NSF CMMI 1537015, NSF ECCS 1509342, and NSF CMMI 1653589), National Institutes of Health (NIH 1R21-EY027590-01, NIH UL1 TR000448), and Career Awards at the Scientific Interface (CASI) from Burroughs Wellcome Fund (BWF).
Footnotes
Conflict of Interest
None.
Publisher's Disclaimer: This is a PDF file of an unedited manuscript that has been accepted for publication. As a service to our customers we are providing this early version of the manuscript. The manuscript will undergo copyediting, typesetting, and review of the resulting proof before it is published in its final citable form. Please note that during the production process errors may be discovered which could affect the content, and all legal disclaimers that apply to the journal pertain.
References
- Andrews K, Murphy L, Munday R, & Littlewood C (1996). Misdiagnosis of the vegetative state: retrospective study in a rehabilitation unit. BMJ, 313, 13–16. [DOI] [PMC free article] [PubMed] [Google Scholar]
- Babadi B, & Brown EN (2014). A review of multitaper spectral analysis. IEEE T BIO-MED ENG, 61, 1555–1564. [DOI] [PubMed] [Google Scholar]
- Bagnato S, Boccagni C, SantAngelo A, Prestandrea C, Rizzo S, & Galardi G (2012). Patients in a vegetative state following traumatic brain injury display a reduced intracortical modulation. CLIN NEUROPHYSIOL, 123, 1937–1941. [DOI] [PubMed] [Google Scholar]
- Bai Y, Xia X, & Li X (2017). A review of resting-state eeg analysis in disorders of consciousness. FRONT NEUROL, 8, 1–9. [DOI] [PMC free article] [PubMed] [Google Scholar]
- Binder M, Górska U, & Griskova-Bulanova I (2017). 40hz auditory steady-state responses in patients with disorders of consciousness: correlation between phase-locking index and coma recovery scale-revised score. CLIN NEUROPHYSIOL, 128, 799–806. [DOI] [PubMed] [Google Scholar]
- Bishop CM (2006). Pattern recognition and machine learning. Springer. [Google Scholar]
- Blume WT (2006). Drug effects on eeg. J CLIN NEUROPHYSIOL, 23, 306–311. [DOI] [PubMed] [Google Scholar]
- Bodart O, Gosseries O, Wannez S, Thibaut A, Annen J, Boly M, Rosanova M, Casali AG, Casarotto S, Tononi G et al. (2017). Measures of metabolism and complexity in the brain of patients with disorders of consciousness. NEUROIMAGE-CLIN, 14, 354–362. [DOI] [PMC free article] [PubMed] [Google Scholar]
- Bonfiglio L, Olcese U, Rossi B, Frisoli A, Arrighi P, Greco G, Carozzo S, Andre P, Bergamasco M, & Carboncini MC (2013). Cortical source of blink-related delta oscillations and their correlation with levels of consciousness. HUM BRAIN MAPP, 34, 2178–2189. [DOI] [PMC free article] [PubMed] [Google Scholar]
- Bonfiglio L, Piarulli A, Olcese U, Andre P, Arrighi P, Frisoli A, Rossi B, Bergamasco M, & Carboncini MC (2014). Spectral parameters modulation and source localization of blink-related alpha and low-beta oscillations differentiate minimally conscious state from vegetative state/unresponsive wakefulness syndrome. PLOS ONE, 9, 1–16. [DOI] [PMC free article] [PubMed] [Google Scholar]
- Britton JW, Frey LC, Hopp J, Korb P, Koubeissi M, Lievens W, Pestana-Knight E, & St EL (2016). Electroencephalography (EEG): An introductory text and atlas of normal and abnormal findings in adults, children, and infants. American Epilepsy Society, Chicago. [PubMed] [Google Scholar]
- Bruno M-A, Vanhaudenhuyse A, Thibaut A, Moonen G, & Laureys S (2011). From unresponsive wakefulness to minimally conscious plus and functional locked-in syndromes: recent advances in our understanding of disorders of consciousness. J NEUROL, 258, 1373–1384. [DOI] [PubMed] [Google Scholar]
- Buzsáki G, & Draguhn A (2004). Neuronal oscillations in cortical networks. SCIENCE, 304, 1926–1929. [DOI] [PubMed] [Google Scholar]
- Carboncini MC, Piarulli A, Virgillito A, Arrighi P, Andre P, Tomaiuolo F, Frisoli A, Bergamasco M, Rossi B, & Bonfiglio L (2014). A case of post-traumatic minimally conscious state reversed by midazolam: clinical aspects and neurophysiological correlates. RESTOR NEUROL NEUROS, 32, 767–787. [DOI] [PubMed] [Google Scholar]
- Casali AG, Gosseries O, Rosanova M, Boly M, Sarasso S, Casali KR, Casarotto S, Bruno M-A, Laureys S, Tononi G et al. (2013). A theoretically based index of consciousness independent of sensory processing and behavior. SCI TRANSL MED, 5, 198ra105–198ra105. [DOI] [PubMed] [Google Scholar]
- Cavinato M, Volpato C, Silvoni S, Sacchetto M, Merico A, & Piccione F (2011). Event-related brain potential modulation in patients with severe brain damage. CLIN NEUROPHYSIOL, 122, 719–724. [DOI] [PubMed] [Google Scholar]
- Chennu S, Annen J, Wannez S, Thibaut A, Chatelle C, Cassol H, Martens G, Schnakers C, Gosseries O, Menon D et al. (2017). Brain networks predict metabolism, diagnosis and prognosis at the bedside in disorders of consciousness. BRAIN, 140, 2120–2132. [DOI] [PubMed] [Google Scholar]
- Chennu S, Finoia P, Kamau E, Allanson J, Williams GB, Monti MM, Noreika V, Arnatkeviciute A, Canales-Johnson A, Olivares F et al. (2014). Spectral signatures of reorganised brain networks in disorders of consciousness. PLOS COMPUT BIOL, 10, 1–16. [DOI] [PMC free article] [PubMed] [Google Scholar]
- Cruse D, & Young GB (2016). The complexity of disorders of consciousness. CLIN NEUROPHYSIOL, 127, 1001–1002. [DOI] [PubMed] [Google Scholar]
- Cruse D, Young GB, Piccione F, Cavinato M, & Ragazzoni A (2016). Brain electrophysiology in disorders of consciousness: Diagnostic and prognostic utility In Brain Function and Responsiveness in Disorders of Consciousness (pp. 105–118). Springer. [Google Scholar]
- Dong P, & Cremer O (2011). Limitations of the use of the glasgow coma scale in intensive care patients with non-neurological primary disease: a search for alternatives. CRIT CARE, 15, 179.21888684 [Google Scholar]
- Estraneo A, Loreto V, Guarino I, Boemia V, Paone G, Moretta P, & Trojano L (2016). Standard eeg in diagnostic process of prolonged disorders of consciousness. CLIN NEUROPHYSIOL, 127, 2379–2385. [DOI] [PubMed] [Google Scholar]
- Fell J, Röschke J, & Schäffner C (1996). Surrogate data analysis of sleep electroencephalograms reveals evidence for nonlinearity. BIOL CYBERN, 75, 85–92. [DOI] [PubMed] [Google Scholar]
- Gallez D, & Babloyantz A (1991). Predictability of human eeg: a dynamical approach. BIOL CYBERN, 64, 381–391. [DOI] [PubMed] [Google Scholar]
- Gao J, Hu J, & Tung W.-w. (2011). Complexity measures of brain wave dynamics. COGN NEURODYNAMICS, 5, 171–182. [DOI] [PMC free article] [PubMed] [Google Scholar]
- Giacino JT, Fins JJ, Laureys S, & Schiff ND (2014). Disorders of consciousness after acquired brain injury: the state of the science. NAT REV NEUROL, 10, 99–114. [DOI] [PubMed] [Google Scholar]
- Gonzalez Andino S, Grave de Peralta Menendez R, Thut G, Spinelli L, Blanke O, Michel C, & Landis T (2000). Measuring the complexity of time series: an application to neurophysiological signals. HUM BRAIN MAPP, 11, 46–57. [DOI] [PMC free article] [PubMed] [Google Scholar]
- Gosseries O, Schnakers C, Ledoux D, Vanhaudenhuyse A, Bruno M-A, Demertzi A, Noirhomme Q, Lehembre R, Damas P, Goldman S et al. (2011). Automated eeg entropy measurements in coma, vegetative state/unresponsive wakefulness syndrome and minimally conscious state. FUNCT NEUROL, 26, 25–30. [PMC free article] [PubMed] [Google Scholar]
- Guerit J-M (2010). Neurophysiological testing in neurocritical care. CURR OPIN CRIT CARE, 16, 98–104. [DOI] [PubMed] [Google Scholar]
- Guyon I, & Elisseeff A (2006). An introduction to feature extraction In Feature extraction (pp. 1–25). Springer. [Google Scholar]
- Höller Y, Bergmann J, Kronbichler M, Crone JS, Schmid EV, Golaszewski S, & Ladurner G (2011). Preserved oscillatory response but lack of mismatch negativity in patients with disorders of consciousness. CLIN NEUROPHYSIOL, 122, 1744–1754. [DOI] [PubMed] [Google Scholar]
- Höller Y, Thomschewski A, Bergmann J, Kronbichler M, Crone JS, Schmid EV, Butz K, Höller P, Nardone R, & Trinka E (2014). Connectivity biomarkers can differentiate patients with different levels of consciousness. CLIN NEUROPHYSIOL, 125, 1545–1555. [DOI] [PubMed] [Google Scholar]
- Husain AM, & Sinha SR (2017). Continuous EEG Monitoring: Principles and Practice. Springer. [Google Scholar]
- Jurdjevic V (1997). Geometric control theory volume 52 Cambridge university press. [Google Scholar]
- Khanmohammadi S (2017). An improved synchronization likelihood method for quantifying neuronal synchrony. COMPUT BIOL MED, 91, 80–95. [DOI] [PubMed] [Google Scholar]
- King J-R, Sitt JD, Faugeras F, Rohaut B, El Karoui I, Cohen L, Naccache L, & Dehaene S (2013). Information sharing in the brain indexes consciousness in noncommunicative patients. CURR BIOL, 23, 1914–1919. [DOI] [PMC free article] [PubMed] [Google Scholar]
- Kotchoubey B (2017). Evoked and event-related potentials in disorders of consciousness: A quantitative review. CONSCIOUS COGN, 54, 155–167. [DOI] [PubMed] [Google Scholar]
- Kotchoubey B, Lang S, Mezger G, Schmalohr D, Schneck M, Semmler A, Bostanov V, & Birbaumer N (2005). Information processing in severe disorders of consciousness: vegetative state and minimally conscious state. CLIN NEUROPHYSIOL, 116, 2441–2453. [DOI] [PubMed] [Google Scholar]
- LaRoche SM, & Hiba Arif Haider M (2018). Handbook of ICU EEG monitoring. Springer Publishing Company. [Google Scholar]
- Laureys S (2004). Functional neuroimaging in the vegetative state. NEUROREHABILITATION, 19, 335–341. [PubMed] [Google Scholar]
- Laureys S (2005). Death, unconsciousness and the brain. NAT REV NEUROSCI, 6, 899–909. [DOI] [PubMed] [Google Scholar]
- Lechinger J, Bothe K, Pichler G, Michitsch G, Donis J, Klimesch W, & Schabus M (2013). Crs-r score in disorders of consciousness is strongly related to spectral eeg at rest. J NEUROL, 260, 2348–2356. [DOI] [PubMed] [Google Scholar]
- Lehembre R, Bruno M-A, Vanhaudenhuyse A, Chatelle C, Cologan V, Leclercq Y, Soddu A, Macq B, Laureys S, & Noirhomme Q (2012). Resting-state eeg study of comatose patients: a connectivity and frequency analysis to find differences between vegetative and minimally conscious states. FUNCT NEUROL, 27, 41–47. [PMC free article] [PubMed] [Google Scholar]
- Leon-Carrion J, Leon-Dominguez U, Pollonini L, Wu M-H, Frye RE, Dominguez-Morales MR, & Zouridakis G (2012). Synchronization between the anterior and posterior cortex determines consciousness level in patients with traumatic brain injury (tbi). BRAIN RES, 1476, 22–30. [DOI] [PubMed] [Google Scholar]
- Marinazzo D, Gosseries O, Boly M, Ledoux D, Rosanova M, Massimini M, Noirhomme Q, & Laureys S (2014). Directed information transfer in scalp electroencephalographic recordings: insights on disorders of consciousness. CLIN EEG NEUROSCI, 45, 33–39. [DOI] [PubMed] [Google Scholar]
- McGee J, Alekseeva N, Chernyshev O, & Minagar A (2016). Traumatic brain injury and behavior: a practical approach. NEUROL CLIN, 34, 55–68. [DOI] [PubMed] [Google Scholar]
- Meredith W, Rutledge R, Fakhry SM, Emery S, & Kromhout-Schiro S (1998). The conundrum of the glasgow coma scale in intubated patients: a linear regression prediction of the glasgow verbal score from the glasgow eye and motor scores. J TRAUMA ACUTE CARE, 44, 839–845. [DOI] [PubMed] [Google Scholar]
- Naro A, Bramanti P, Leo A, Cacciola A, Bramanti A, Manuli A, & Calabrò RS (2016). Towards a method to differentiate chronic disorder of consciousness patients’ awareness: The low-resolution brain electromagnetic tomography analysis. J NEUROL SCI, 368, 178–183. [DOI] [PubMed] [Google Scholar]
- Numan T, Slooter AJ, van der Kooi AW, Hoekman AM, Suyker WJ, Stam CJ, & van Dellen E (2017). Functional connectivity and network analysis during hypoactive delirium and recovery from anesthesia. CLIN NEUROPHYSIOL, 128, 914–924. [DOI] [PubMed] [Google Scholar]
- Osselton J (1965). Acquisition of eeg data by bipolar unipolar and average reference methods: a theoretical comparison. CLIN NEUROPHYSIOL, 19, 527–528. [DOI] [PubMed] [Google Scholar]
- Peng C-K, Costa M, & Goldberger AL (2009). Adaptive data analysis of complex fluctuations in physiologic time series. ADV ADAPT DATA ANAL, 1, 61–70. [DOI] [PMC free article] [PubMed] [Google Scholar]
- Piarulli A, Bergamasco M, Thibaut A, Cologan V, Gosseries O, & Laureys S (2016). Eeg ultradian rhythmicity differences in disorders of consciousness during wakefulness. J NEUROL, 263, 1746–1760. [DOI] [PubMed] [Google Scholar]
- Pollonini L, Pophale S, Situ N, Wu M-H, Frye RE, Leon-Carrion J, & Zouridakis G (2010). Information communication networks in severe traumatic brain injury. BRAIN TOPOGR, 23, 221–226. [DOI] [PubMed] [Google Scholar]
- Pradhan N, & Dutt DN (1993). A nonlinear perspective in understanding the neurodynamics of eeg. COMPUT BIOL MED, 23, 425–442. [DOI] [PubMed] [Google Scholar]
- Ragazzoni A, Cincotta M, Giovannelli F, Cruse D, Young GB, Miniussi C, & Rossi S (2017). Clinical neurophysiology of prolonged disorders of consciousness: from diagnostic stimulation to therapeutic neuromodulation. CLIN NEUROPHYSIOL, 128, 1629–1646. [DOI] [PubMed] [Google Scholar]
- Rapp PE, Keyser DO, Albano A, Hernandez R, Gibson DB, Zambon RA, Hairston WD, Hughes JD, Krystal A, & Nichols AS (2015). Traumatic brain injury detection using electrophysiological methods. FRONT HUM NEUROSCI, 9, 1–32. [DOI] [PMC free article] [PubMed] [Google Scholar]
- Real RG, Veser S, Erlbeck H, Risetti M, Vogel D, Müller F, Kotchoubey B, Mattia D, & Kübler A (2016). Information processing in patients in vegetative and minimally conscious states. CLIN NEUROPHYSIOL, 127, 1395–1402. [DOI] [PubMed] [Google Scholar]
- Risetti M, Formisano R, Toppi J, Quitadamo LR, Bianchi L, Astolfi L, Cincotti F, & Mattia D (2013). On erps detection in disorders of consciousness rehabilitation. FRONT HUM NEUROSCI, 7, 1–10. [DOI] [PMC free article] [PubMed] [Google Scholar]
- Rosanova M, Gosseries O, Casarotto S, Boly M, Casali AG, Bruno M-A, Mariotti M, Boveroux P, Tononi G, Laureys S et al. (2012). Recovery of cortical effective connectivity and recovery of consciousness in vegetative patients. BRAIN, 135, 1308–1320. [DOI] [PMC free article] [PubMed] [Google Scholar]
- Sanders RD, Tononi G, Laureys S, & Sleigh JW (2012). Unresponsiveness≠ unconsciousness. ANESTHESIOLOGY, 116, 946–959. [DOI] [PMC free article] [PubMed] [Google Scholar]
- Sarà M, & Pistoia F (2010). Complexity loss in physiological time series of patients in a vegetative state. NONLINEAR DYNAMICS PSYCHOL LIFE SCI, 14, 1–13. [PubMed] [Google Scholar]
- Schartner M, Seth A, Noirhomme Q, Boly M, Bruno M-A, Laureys S, & Barrett A (2015). Complexity of multi-dimensional spontaneous eeg decreases during propofol induced general anaesthesia. PLOS ONE, 10, 1–21. [DOI] [PMC free article] [PubMed] [Google Scholar]
- Schnakers C, Vanhaudenhuyse A, Giacino J, Ventura M, Boly M, Majerus S, Moonen G, & Laureys S (2009). Diagnostic accuracy of the vegetative and minimally conscious state: clinical consensus versus standardized neurobehavioral assessment. BMC NEUROL, 9, 35–39. [DOI] [PMC free article] [PubMed] [Google Scholar]
- Sebastiano DR, Panzica F, Visani E, Rotondi F, Scaioli V, Leonardi M, Sattin D, DIncerti L, Parati E, Strambi LF et al. (2015). Significance of multiple neurophysiological measures in patients with chronic disorders of consciousness. CLIN NEUROPHYSIOL, 126, 558–564. [DOI] [PubMed] [Google Scholar]
- Simmons GF, & Simmons GF (1996). Calculus with analytic geometry. McGraw-Hill; New York. [Google Scholar]
- Sitt JD, King J-R, El Karoui I, Rohaut B, Faugeras F, Gramfort A, Cohen L, Sigman M, Dehaene S, & Naccache L (2014). Large scale screening of neural signatures of consciousness in patients in a vegetative or minimally conscious state. BRAIN, 137, 2258–2270. [DOI] [PMC free article] [PubMed] [Google Scholar]
- Stam C, Pijn J, Suffczynski P, & Da Silva FL (1999). Dynamics of the human alpha rhythm: evidence for non-linearity? CLIN NEUROPHYSIOL, 110, 1801–1813. [DOI] [PubMed] [Google Scholar]
- Stam CJ (2005). Nonlinear dynamical analysis of eeg and meg: review of an emerging field. CLIN NEUROPHYSIOL, 116, 2266–2301. [DOI] [PubMed] [Google Scholar]
- Stern JM (2005). Atlas of EEG patterns. Lippincott Williams & Wilkins. [Google Scholar]
- Tang L, Lv H, Yang F, & Yu L (2015). Complexity testing techniques for time series data: A comprehensive literature review. CHAOS SOLITON FRACT, 81, 117–135. [Google Scholar]
- Thul A, Lechinger J, Donis J, Michitsch G, Pichler G, Kochs EF, Jordan D, Ilg R, & Schabus M (2016). Eeg entropy measures indicate decrease of cortical information processing in disorders of consciousness. CLIN NEUROPHYSIOL, 127, 1419–1427. [DOI] [PubMed] [Google Scholar]
- Varotto G, Fazio P, Sebastiano DR, Duran D, DIncerti L, Parati E, Sattin D, Leonardi M, Franceschetti S, & Panzica F (2014). Altered resting state effective connectivity in long-standing vegetative state patients: An eeg study. CLIN NEUROPHYSIOL, 125, 63–68. [DOI] [PubMed] [Google Scholar]
- Wijdicks EF, Bamlet WR, Maramattom BV, Manno EM, & McClelland RL (2005). Validation of a new coma scale: the four score. ANN NEUROL, 58, 585–593. [DOI] [PubMed] [Google Scholar]
- Wijnen VJ, & van Boxtel GJ (2010). The continuing problem of diagnosing unresponsive patients: Searching for neurophysiological correlates of consciousness. CLIN NEUROPHYSIOL, 121, 992–993. [DOI] [PubMed] [Google Scholar]
- Wu D.-y., Cai G, Yuan Y, Liu L, Li G.-q., Song W. q., & Wang M.-b. (2011a). Application of nonlinear dynamics analysis in assessing unconsciousness: a preliminary study. CLIN NEUROPHYSIOL, 122, 490–498. [DOI] [PubMed] [Google Scholar]
- Wu D.-y., Cai G, Zorowitz RD, Yuan Y, Wang J, & Song W.-q. (2011b). Measuring interconnection of the residual cortical functional islands in persistent vegetative state and minimal conscious state with eeg nonlinear analysis. CLIN NEUROPHYSIOL, 122, 1956–1966. [DOI] [PubMed] [Google Scholar]
- Zhang Y, Song W, Du J, Huo S, Shan G, & Li R (2017). Transcranial direct current stimulation in patients with prolonged disorders of consciousness: Combined behavioral and event-related potential evidence. FRONT NEUROL, 8, 1–10. [DOI] [PMC free article] [PubMed] [Google Scholar]


