Abstract
Despite the pivotal role of MYC in tumorigenesis, the mechanisms by which it promotes cancer aggressiveness remain incompletely understood. Here we show that MYC transcriptionally upregulates the ubiquitin fusion degradation 1 (UFD1) gene in T-cell acute lymphoblastic leukemia (T-ALL). Allelic loss of ufd1 in zebrafish induces tumor-cell apoptosis and impairs MYC-driven T-ALL progression but does not affect general health. As the E2 component of an endoplasmic reticulum (ER)-associated degradation (ERAD) complex, UFD1 facilitates the elimination of misfolded/unfolded proteins from the ER. We found that UFD1 inactivation in human T-ALL cells impairs ERAD, exacerbates ER stress, and induces apoptosis. Moreover, we show that UFD1 inactivation promotes the proapoptotic unfolded protein response (UPR) mediated by protein kinase RNA-like ER kinase (PERK). This effect is demonstrated by an upregulation of PERK and its downstream effector C/EBP homologous protein (CHOP), as well as a downregulation of BCL2 and BCLxL. Indeed, CHOP inactivation or BCL2 overexpression is sufficient to rescue tumor-cell apoptosis induced by UFD1 knockdown. Together, our studies identify UFD1 as a critical regulator of the ER stress response and a novel contributor to MYC-mediated leukemia aggressiveness, with implications for targeted therapy in T-ALL and likely other MYC-driven cancers.
INTRODUCTION
Enhanced MYC activity contributes to malignant transformation, maintenance, and progression in over half of all human cancers, including leukemias, lymphomas, and carcinomas.1 T-cell acute lymphoblastic leukemia (T-ALL) is an aggressive hematologic malignancy of developing thymocytes that afflicts both children and adults.2 In over 60% of T-ALL cases, MYC is overexpressed downstream of activated NOTCH1 mutations and plays a pivotal role in disease induction and aggressiveness.3–7 Despite a range of treatment improvements, 15% to 20% of pediatric and 50% of adult patients with T-ALL succumb to disease.2 Moreover, current multiagent protocols often cause serious systemic toxicities, underscoring the need for better therapy.8 Improved understanding of the molecular mechanisms that underlie MYC-mediated leukemia aggressiveness may provide strategies for development of effective targeted treatments.
It has been demonstrated that enhanced MYC activity leads to cellular changes associated with a global increase in gene transcription and protein synthesis.9–11 One consequence of this effect is an increase in misfolded/unfolded polypeptides in the endoplasmic reticulum (ER), referred to as ER stress.12 In order to restore protein homeostasis in the ER, a number of stress response pathways are activated, including the unfolded protein response (UPR) and ER-associated degradation (ERAD) pathways.13 The UPR is a well-conserved pathway among vertebrate species that inhibits general protein translation and upregulates specific ER chaperones to alleviate ER stress. ERAD functions downstream of the UPR to facilitate the degradation of misfolded/unfolded proteins and thus helps to restore ER protein homeostasis.13 Although optimal cell function and survival depend on the coordinated functions of both UPR and ERAD,14 it remains unclear how these pathways cooperate to promote tumor induction and progression.
In cells with elevated ER stress, at least three types of ER stress transducers can be activated through the release of inhibitory binding by glucose-regulated chaperone protein (GRP78/BIP): the protein kinase RNA-like ER kinase (PERK), the inositol-requiring enzyme 1 (IRE1), and the activating transcription factor 6 (ATF6).15, 16 Each transducer communicates ER stress to the cytosol and the nucleus to alter gene transcription, protein synthesis, and protein degradation.15, 16 Although the UPR is often cytoprotective, it can become cytotoxic when there is prolonged and unresolved ER stress, thus serving as a central regulator of cell fate.12 Identification of genes controlling this switch could deepen our understanding of the regulation of the ER stress response pathways and reveal new strategies for cancer treatment.
Here we identify the ubiquitin fusion degradation 1 (UFD1) protein as a novel mediator of MYC-driven leukemia aggressiveness and a suppressor of the cytotoxic UPR. Our genomic and biochemical analyses of human patient samples pinpoint UFD1 as a MYC-activated protein that is significantly upregulated in T-ALL. UFD1 functions in a major ERAD complex downstream of the UPR to retrotranslocate unfolded/misfolded proteins from the ER lumen to the cytosol for proteasome-mediated degradation.17 We demonstrate that UFD1 inactivation impairs ERAD, exacerbates ER stress, and activates the PERK-mediated proapoptotic UPR to induce tumor-cell apoptosis. Disruption of UFD1 function suppresses MYC-driven leukemia progression in vivo and kills human MYC-dependent T-ALL cells in vitro. Our studies thus identify UFD1 as a key mediator of MYC-driven T-ALL progression, and suggest that a targeted therapy strategy based on these findings could improve the outlook for patients with MYC-associated, high-risk T-ALL and perhaps those with other MYC-driven cancers.
RESULTS
Human T-ALL cells show elevated levels of ER stress and upregulate UFD1 in a MYC-dependent manner
Aberrant MYC activity promotes gene transcription and protein translation, leading to an accumulation of misfolded/unfolded polypeptides in the ER (i.e., ER stress).10, 11 To determine the level of ER stress in human MYC-dependent T-ALL cells, we utilized publicly available databases to compare gene expression profiles between primary human T-ALL and normal T-cell samples (GSE33470 and GSE42328).18 Gene set enrichment analysis (GSEA) of these datasets revealed that human T-ALL cells are significantly enriched for a previously-defined ER stress signature (Figure 1a and Supplementary Figure 1),19 indicative of elevated ER stress in these tumor cells. To understand how T-ALL cells cope with ER stress, we analyzed the expression of genes involved in all three branches of the UPR,20 as well as components of the major ERAD complex (UFD1, nuclear protein localization-4 [NPL4], and the valosin-containing protein P97) in human T-ALL samples and normal T cells.17 Strikingly, the transcript levels of all UPR/ERAD-related genes analyzed, except IRE1α, were significantly elevated in human T-ALL samples compared to normal T cells (Figure 1b).
Figure 1. Human patient T-ALL samples show signs of ER stress and upregulate UFD1 in a MYC-dependent manner.
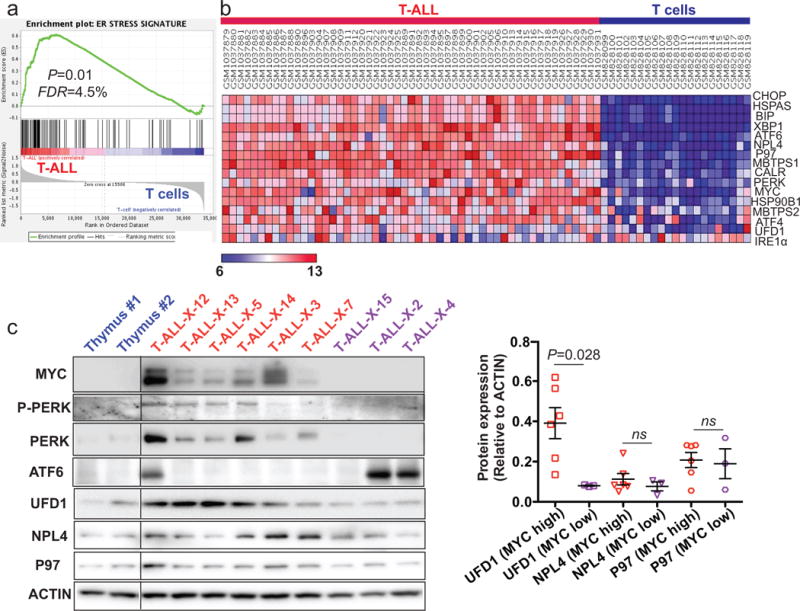
(a) Gene set enrichment analysis of publically available datasets revealed that a previously-defined ER stress signature is significantly enriched in T-ALL patient samples, compared with normal T cells (P=0.01; n=53 and 21, respectively). (b) Gene expression heatmap for MYC, genes in three branches of the UPR pathway, and genes encoding the major ERAD complex (UFD1, NPL4, and P97) from the same datasets analyzed in (a). (c) Western blot analysis (left panel) of MYC, ATF6, P-PERK (phospho-PERK), PERK, UFD1, NPL4, and P97 in thymus (denoted as blue) and primary T-ALL patient samples with high (denoted as red) or low (denoted as purple) MYC expression. Protein quantification (right panel) revealed that MYC-high T-ALL patient samples have higher expression levels of UFD1 but not NPL4 or P97, compared to MYC-low tumor samples (mean ± SD of UFD1 to ACTIN ratio: 0.39 ± 0.08 vs. 0.08 ± 0.002, P=0.028; NPL4 to ACTIN ratio: 0.12 ± 0.02 vs. 0.06 ± 0.02, P=0.154; and P97 to ACTIN ratio: 0.21 ± 0.04 vs. 0.18 ± 0.06, P=0.63; n=6 for MYC-high and 3 for MYC-low T-ALL patient samples).
Next we analyzed protein levels of the UPR components and the UFD1-NPL4-P97 ERAD complex. As expected,7, 21 protein levels of MYC and phospho/total PERK, but not ATF6 or IRE1α, were increased in most primary T-ALL samples (Figure 1c and Supplementary Figure 2). Surprisingly, among the three UFD1-NPL4-P97 ERAD components, only UFD1 was significantly upregulated in MYC-overexpressing T-ALL samples, compared to those with lower MYC expression (Figure 1c). Finally, we performed Western blot analysis on a panel of human MYC-dependent T-ALL cell lines to detect protein levels of the above UPR and ERAD components. Consistent with what we observed in MYC-overexpressing patient samples, MYC and UFD1 were significantly upregulated in human T-ALL cell lines, compared to control thymus (Supplementary Figure 3). Additionally, we observed upregulation of phospho/total PERK and ATF6 in some of human MYC-dependent T-ALL cell lines, indicative of ER stress. Together, our studies demonstrate that human T-ALL cells are primed with ER stress and upregulate UFD1 in a MYC-dependent manner.
MYC transcriptionally regulates UFD1 in human leukemic cells
To determine if MYC regulates UFD1, we inactivated MYC by short hairpin RNA (shRNA) in human BCL-2-overexpressing and thus apoptosis-resistant JURKAT T-ALL cells. Western blotting revealed that UFD1, but not P97 or NPL4, was downregulated in these cells upon MYC knockdown (Figure 2a). MYC inactivation also suppressed PERK-mediated UPR, as demonstrated by decreased expression of phospho/total PERK and its downstream effector C/EBP homologous protein (CHOP), while minimally affecting ATF6 and IRE1α (Figure 2a). Similar to MYC knockdown, inactivation of TAL1, another major T-ALL oncogene, also downregulated phospho/total PERK and CHOP, but did not decrease UFD1 protein levels, suggesting that UFD1 is specifically regulated by MYC but not TAL1 or PERK (Figure 2a). To understand if MYC regulates UFD1 transcriptionally, we performed firefly luciferase assays to measure UFD1 promoter activity in BCL-2-overexpressing JURKAT T-ALL cells. MYC inactivation significantly reduced UFD1 promoter activity, leading to a reduced expression of the luciferase reporter gene (Figure 2b). Next, we performed chromatin-immunoprecipitation (ChIP) PCR in human JURKAT T-ALL cells and found that MYC binds to the promoter region of UFD1 (Figure 2c). Finally, analysis of published ChIP-Seq data, from experiments designed to identify MYC binding sites in human JURKAT and K562 leukemic cells,22, 23 further demonstrated that MYC binds to the promoter region of UFD1 (Supplementary Figure 4). Analyses of human ENCODE databases revealed three MYC-binding elements, including a conserved E-box motif, in the promoter region of UFD1. Together, our data indicate that MYC transcriptionally upregulates UFD1 in human leukemic cells.
Figure 2. MYC transcriptionally upregulates UFD1 in human leukemic cells.
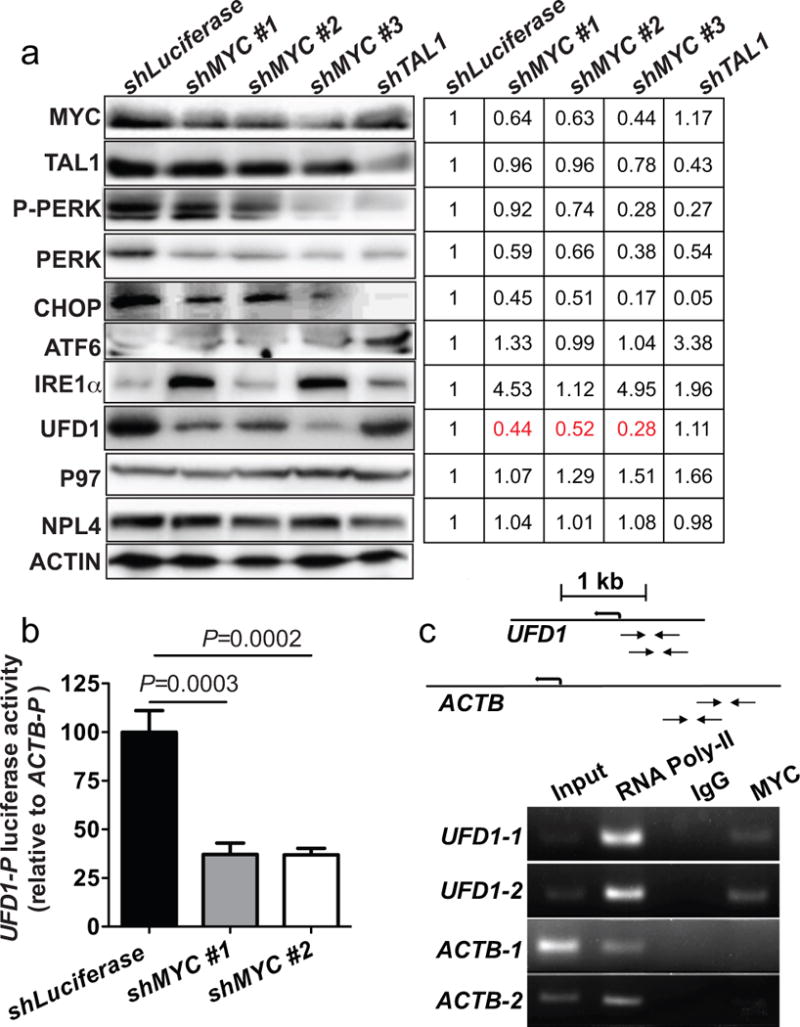
(a) Western blot analysis of human BCL2-overexpressing JURKAT T-ALL cells revealed that P-PERK, PERK and CHOP decreased upon shMYC or shTAL1 knockdown; however, UFD1 protein levels decreased only upon shMYC knockdown. ACTIN serves as the loading control. (b) Firefly luciferase assays show that MYC inactivation significantly reduced UFD1 promoter activity. (c) CHIP-PCR demonstrates that MYC binds to the promoter region of UFD1 but not β-ACTIN (ACTB) gene. Schematic drawing on the top illustrates the primer location within the UFD1 or ACTB promoter.
MYC drives continuous upregulation of ufd1 during T-ALL development in vivo
To gain insight into the in vivo importance of UFD1 during MYC-mediated leukemogenesis, we studied a zebrafish model of T-ALL that overexpresses EGFP-fused mammalian Myc from a lymphocyte-specific promoter (rag2) and resembles a major subtype of human disease.24, 25 Western blot analysis was performed to detect Ufd1 and EGFP-MYC protein levels in the normal thymus from control Tg(rag2:EGFP) fish (EGFP) versus tumor cells from Tg(rag2:EGFP-mMyc) fish (Myc) at stages of disease onset and dissemination (Figure 3a). Compared to the control thymus, Ufd1 protein levels were significantly elevated in Myc-overexpressing T-ALL cells at disease onset and continued to increase as the tumors progressed, a pattern similar to that of EGFP-MYC protein levels (Figures 3a-b). Bip protein levels were also elevated in these Myc-overexpressing T-ALL cells, compared to control thymocytes (Supplementary Figure 5a), indicating elevated ER stress. Consistent with our observation in human patient samples, qRT-PCR analysis demonstrated a significant upregulation of perk but not atf6 transcript levels in these Myc-overexpressing T-ALL cells, compared to control thymocytes (Supplementary Figure 5b). As in human T-ALL cells (Figures 1b, 2), the increase in Ufd1 protein levels was also driven by MYC-induced transcription in vivo, as shown by qRT-PCR analysis of ufd1 transcript levels in control thymocytes (EGFP;ufd1+/+) and Myc-overexpressing T-ALL (Myc;ufd1+/+) cells (left panel of Figure 3c). To address whether continued upregulation of ufd1 depends on MYC, we analyzed the Tg(rag2:MYC-ER);Tg(rag2:EGFP-bcl2) zebrafish line, in which MYC activity is conditionally regulated by 4-hydroxytamoxifen (4-HT) and bcl2 overexpression precludes apoptosis upon MYC inactivation.26 Indeed, ufd1 transcript levels were significantly downregulated as early as 24 hours after 4-HT removal (right panel of Figure 3c). These data indicate that MYC activity accounts for the elevated ufd1 expression observed during T-ALL development.
Figure 3. ufd1 is transcriptionally upregulated by MYC during tumor development in a zebrafish model of MYC-induced T-ALL.
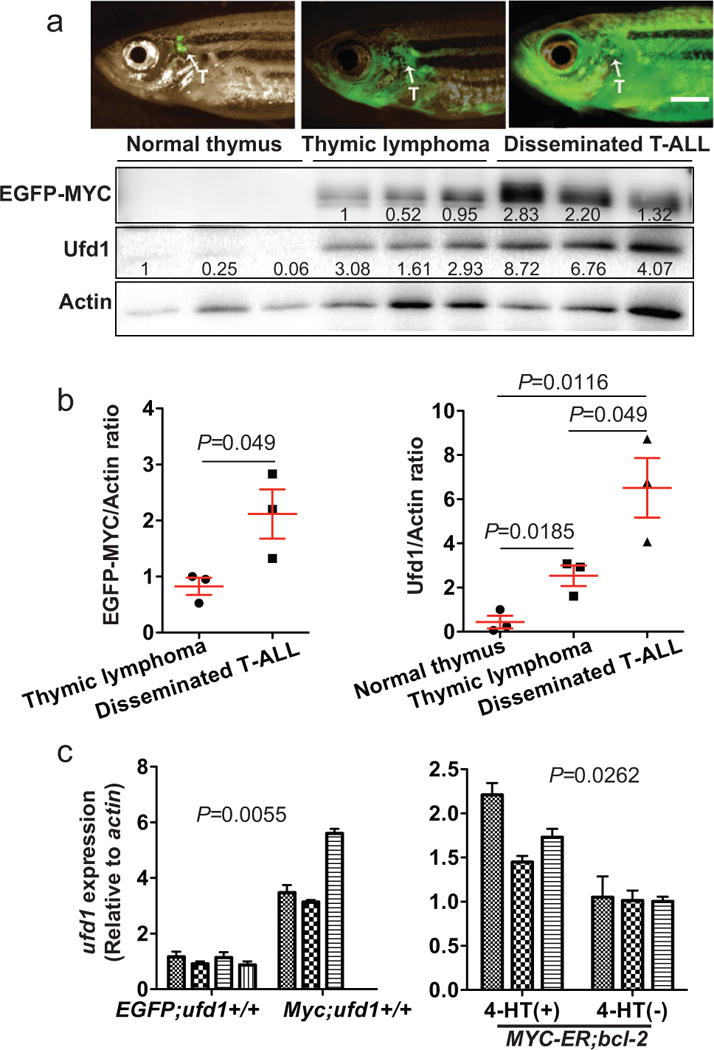
(a) EGFP-labeled T cells outline the normal thymus boundary of a control Tg(rag2:EGFP) fish (EGFP;ufd1+/+; 87-day-old; upper left panel). EGFP-labeled T lymphoblasts in a Tg(rag2:EGFP-mMyc) fish (Myc) proliferate actively, invade into the local tissue (87-day-old; upper middle panel), and eventually disseminate throughout the host (151-day-old; upper right panel). Arrows point to thymus (T). Western blot analysis (lower panel) of EGFP-MYC and Ufd1 protein levels in EGFP+ T cells from fish described above. (b) Quantification of relative EGFP-MYC (left panel) and Ufd1 (right panel) to Actin ratios revealed that both MYC and Ufd1 protein levels increased gradually as the disease progressed (mean ± SD of EGFP-MYC to Actin ratio: 0.82 ± 0.15 for lymphoma cells vs. 2.12 ± 0.44 for leukemic cells, P=0.049; and Ufd1 to Actin ratio: 0.44 ± 0.29 for normal thymus, 2.54 ± 0.47 for lymphoma cells, and 6.52 ± 1.35 for leukemic cells, P=0.018 for thymus vs. lymphoma cells; P=0.049 for lymphoma vs. leukemic cells; P=0.012 for normal thymus vs. leukemic cells; n=3 per group). (c) qRT-PCR analysis revealed elevated ufd1 transcript levels in Myc-overexpressing T-ALL cells from each individual fish (Myc;ufd1+/+), compared with normal thymus dissected from each control fish (EGFP;ufd1+/+; Mean ± SD of ufd1 to β-actin ratio: 4.08 ± 0.77 vs. 1.03 ± 0.08; P=0.0055; n=3 and 4 fish, respectively; left panel); and downregulation of ufd1 in T-ALL cells from Tg(rag2:MYC-ER);Tg(rag2-EGFP-bcl2) fish (MYC-ER;bcl-2) at 24 hours post 4-HT removal (Mean ± SD of ufd1 to β-actin ratio: 1.8 ± 0.23 [+ 4-HT] vs. 1.02 ± 0.01 [- 4-HT]; P=0.0262; n=3 fish per group; right panel). Fish at 2-3 months of age were used for analysis in (c).
Heterozygosity of ufd1 decreases MYC-induced T-ALL burden and delays tumor progression without affecting animal health
To determine whether UFD1 is essential for MYC-driven T-ALL pathogenesis, we studied the zebrafish ufd1hi3471 mutant line,27 which harbors a retroviral insertion in the 5’ UTR region of the ufd1 gene, leading to disruption of transcription and loss of gene expression. After breeding the ufd1 heterozygous fish to the stable Myc transgenic fish, we observed a significant reduction of tumor burden in the Myc;ufd1+/− fish versus their Myc;ufd1+/+ siblings (right panels of Figures 4a-b). Notably, ufd1 heterozygosity did not affect non-transformed thymocytes in the control EGFP fish (compare fluorescence intensity of EGFP;ufd1+/+ vs. EGFP;ufd1+/− in left panels of Figures 4a-b). Western blot analysis confirmed a 50% reduction of Ufd1 protein levels in both control EGFP;ufd1+/− thymocytes and Myc;ufd1+/− lymphoblasts, although Ufd1 protein levels in tumor cells were significantly higher than control thymocytes regardless of ufd1 mutational status (Supplementary Figures 6a-b). Next, we asked whether disruption of UFD1 function could inhibit T-ALL progression. For this purpose we chose Tg(rag2:loxp-dsRED2-loxp-EGFP-mMyc);Tg(hsp70-Cre) fish [designated as Myc;Cre],28 which develop T-ALL more slowly and with a wider window of time than the stable Myc [Tg(rag2:EGFP-mMyc)] line (45-250 vs. 35-60 days of life), permitting delineation of tumor onset and disease progression.28, 29 We then bred ufd1 heterozygous fish to the Myc;Cre double transgenic fish, subjected their progeny to heat-shock treatment to induce Myc expression, and monitored the fish for the time of tumor onset and progression as previously described.28, 29 Despite no effect on tumor onset (Supplementary Figure 6c), heterozygous loss of ufd1 significantly suppressed the progression and distant dissemination of T-ALL in the Myc;Cre;ufd1+/− fish, compared to their Myc;Cre;ufd1+/+ siblings (Figures 4c-d). By 399 days of life, 78% of the Myc;Cre;ufd1+/+ fish with tumor had wide T-ALL dissemination, in marked contrast to only 37% of the Myc;Cre;ufd1+/− fish with the disease (Figure 4d).
Figure 4. Heterozygous loss of ufd1 significantly decreases MYC-induced T-ALL burden and delays disease progression in zebrafish.
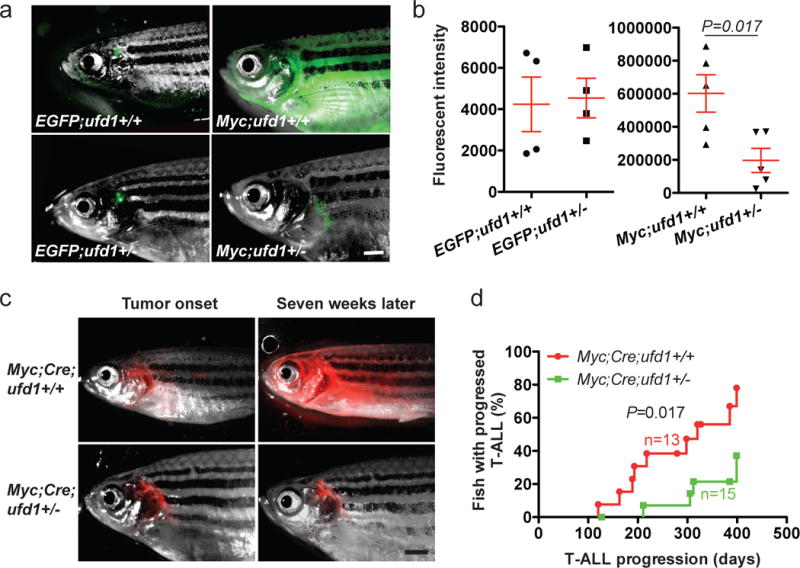
(a) Overlay of brightfield images and EGFP fluorescence of T cells in a control EGFP;ufd1+/+ and EGFP;ufd1+/− fish (123-day-old; left panels), as well as GFP+ tumor cells in a Myc;ufd1+/+ and Myc;ufd1+/− fish (114-day-old; right panels). (b) Fluorescence intensity quantification demonstrated that Myc;ufd1+/− fish had significantly less tumor burden than Myc;ufd1+/+ fish (mean ± SD: 196,720 ± 72,740 vs. 602,086 ± 112,985; P=0.017; n=5 per group; right panel), while there were no difference in thymic fluorescence intensity for EGFP;ufd1+/− versus EGFP;ufd1+/+ fish (mean ± SD: 4,539 ± 955 vs. 4,239 ± 1,319; P=0.86; n=4 per group; left panel). (c) Localized DsRED2-labeled tumors arose in a conditional Myc;Cre;ufd1+/+ (48-day) and Myc;Cre;ufd1+/− fish (57-day); widespread dissemination of T-ALL was seen seven weeks later in Myc;Cre;ufd1+/+ fish, but not in Myc;Cre;ufd1+/− fish. (d) Rates of T-ALL progression indicate that despite a similar tumor onset time, Myc;Cre;ufd1+/− fish (green line) develop widely disseminated T-ALL much slower than Myc;Cre;ufd1+/+ fish (red line; n=15 and 13; respectively). Scale bar for panels (a) and (c) = 1 mM.
An important question was whether the reduced Ufd1 activity would impede normal development. A visual screen of the progeny of ufd1 heterozygotes at 4, 6 and 9 days postfertilization (dpf) failed to detect any morphologic or hematopoietic defects in these fish (ufd1+/−; Supplementary Figures 7a-b, middle panels), compared to wild-type siblings (ufd1+/+; Supplementary Figures 7a-b, left panels). However, ufd1 homozygous mutants (ufd1−/−) exhibited developmental defects starting at 4 dpf (e.g., jaw protrusion) and failed to develop swim bladders at 6 dpf, despite apparently normal hematopoietic development (Supplementary Figures 7a-b, right panels). By 9 dpf, none of the ufd1−/− fish remained viable. Consistent with their lack of morphologic defects during embryonic stages, ufd1 heterozygous fish were viable and grew at similar rates as their wild-type siblings into adulthood in the expected Mendelian ratios (Supplementary Figure 8a). Finally, histologic analysis of serial H & E-stained sections of 4-month-old ufd1+/+ and ufd1+/− siblings did not reveal any gross abnormalities in multiple tissues and organs from the heterozygous fish, including eye, brain, thymus, kidney, heart, liver, ovary, testis, intestine, and muscle (Supplementary Figure 8b and data not shown). These data demonstrate that ufd1 heterozygosity inhibits MYC-induced T-ALL pathogenesis without impairing normal fish development.
To elucidate the cellular basis for this effect, we performed immunofluorescent staining for active caspase-3 to detect possible apoptotic cells in four groups of cells: EGFP;ufd1+/+ and EGFP;ufd1+/− thymocytes, as well as Myc;ufd1+/+ and Myc;ufd1+/− lymphoblasts (Figure 5a). Active caspase-3 staining revealed a significantly higher number of apoptotic cells among the Myc;ufd1+/− T-ALL cells, compared with control thymocytes or Myc;ufd1+/+ T-ALL cells (Figures 5a-b). Similarly, Annexin-V/PI (propidium iodide) staining of these cells also revealed increased apoptotic cells in Myc;ufd1+/− T-ALL cells (Supplementary Figure 9a). To understand how ufd1 loss affects cell proliferation, we performed PI staining and flow cytometry analysis to examine DNA content in control EGFP;ufd1+/+ and EGFP;ufd1+/− thymocytes, as well as Myc;ufd1+/+ and Myc;ufd1+/− T-ALL cells. Heterozygous loss of ufd1 did not cause any cell cycle changes in non-transformed thymocytes (EGFP;ufd1+/+ vs. EGFP;ufd1+/−; left panel of Figure 5c, and Supplementary Figures 9b-c). However, Myc;ufd1+/− tumor cells showed a significant increase in G0/G1-phase cells and a reduction of cells in S and G2 phase, compared to Myc;ufd1+/+ T-ALL cells or EGFP;ufd1+/− control thymocytes (right panel of Figure 5c, and Supplementary Figures 9b-c). Our data demonstrate that ufd1 heterozygosity induces apoptosis and decreases proliferation in Myc-overexpressing T-ALL cells but not in normal thymocytes.
Figure 5. Heterozygous loss of ufd1 induces apoptosis and inhibits cell proliferation in Myc-overexpressing T-ALL cells but not in control thymocytes in zebrafish.
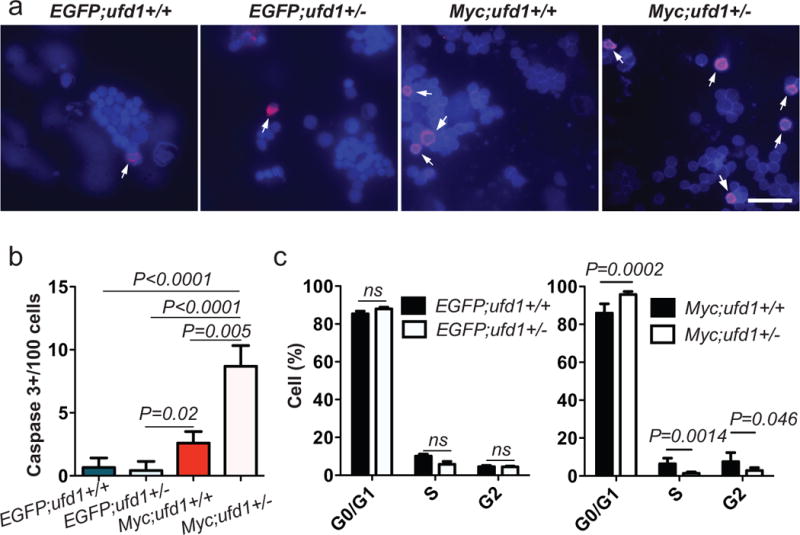
(a) FAC-sorted EGFP+ cells stained with anti-active caspase-3 (red; denoted by arrows)/DAPI (blue; n=3) from: EGFP;ufd1+/+, EGFP;ufd1+/−, Myc;ufd1+/+, and Myc;ufd1+/− fish. (b) Quantification of active caspase-3+ cells revealed that a significantly higher percentage of tumor cells from Myc;ufd1+/− fish underwent apoptosis, compared to those in Myc;ufd1+/+ fish (mean ± SD of active caspase-3+ cells per area: 8.69 ± 0.95 vs. 2.59 ± 0.53; P=0.005; n=3 per group). There was no difference detected in number of active caspase-3+ thymocytes from EGFP;ufd1+/− vs. EGFP;ufd1+/+ fish (mean ± SD of active caspase-3+ cells per area: 0.42 ± 0.42 vs. 0.66 ± 0.44; P=0.71; n=3 per group). (c) Cell cycle distribution of EGFP;ufd1+/+ vs. EGFP;ufd1+/− control thymocytes (left panel) and Myc;ufd1+/+ vs. Myc;ufd1+/− T-ALL cells (right panel). Percentage of cells in G1/G0, S, or G2/M cell cycle phases is presented as mean ± SD; n=5-7 per group. GFP-sorted control thymocytes dissected from thymus or tumor cells dissected outside the thymus of each fish (~2 months of age) were used for analyses. Scale bar in (a) for upper panels = 10 μm and lower panels = 20 μm.
UFD1 inactivation exacerbates ER stress, decreases cell growth, and induces apoptosis in human MYC-dependent T-ALL cells
Our findings thus far suggest that targeting UFD1 could efficiently impair the ability of leukemic T cells to cope with ER stress, leading to their apoptotic death. To test this hypothesis in human leukemic cells, we genetically inactivated UFD1 in JURKAT, MOLT3 and PEER cell lines, using two previously published shRNA hairpins (shUFD1 #1 and #2; see Western blotting insert in Figures 6a,7a, and left panel of Supplementary Figure 10c),30 as well as two hairpins that target the 3’ untranslated region of the gene and reduce ~80% of UFD1 protein levels (shUFD1 #3 and #4; see Western blotting inserts in Supplementary Figure 10a and right panel of Supplementary Figure 10c). UFD1 knockdown by shRNAs significantly induced ER stress, as demonstrated by increased thioflavin staining (Supplementary Figure 11) and elevated BIP levels in human T-ALL cells (Figure 7a and Supplementary Figure 10c).31–33 Moreover, these shRNAs significantly reduced the growth of all three T-ALL cell lines, with strong knockdown leading to a more severe inhibition of growth, compared to control cells transduced with shLuciferase (Figure 6a and Supplementary Figures 10a-b). To assess the dependency of T-ALL cells on UFD1 for survival, we stained JURKAT, MOLT3, and PEER cells with Annexin-V and PI, and found that UFD1 inactivation robustly induced apoptosis in each cell line as compared to control cells transduced with shLuciferase (Figure 6b). Cell cycle analysis at day 4 postinfection revealed that UFD1 knockdown induced a modest but significant accumulation of G1-phase cells and a reduction of S-phase cells in JURKAT T-ALL cells (Figure 6c). These data support the concept that human T-ALL cells depend on elevated UFD1 protein levels to cope with ER stress, and indicate the potential of targeting this protein as a therapeutic option in high-risk cases.
Figure 6. UFD1 inactivation in human T-ALL cells exacerbates ER stress, decreases cell growth, and induces apoptosis.
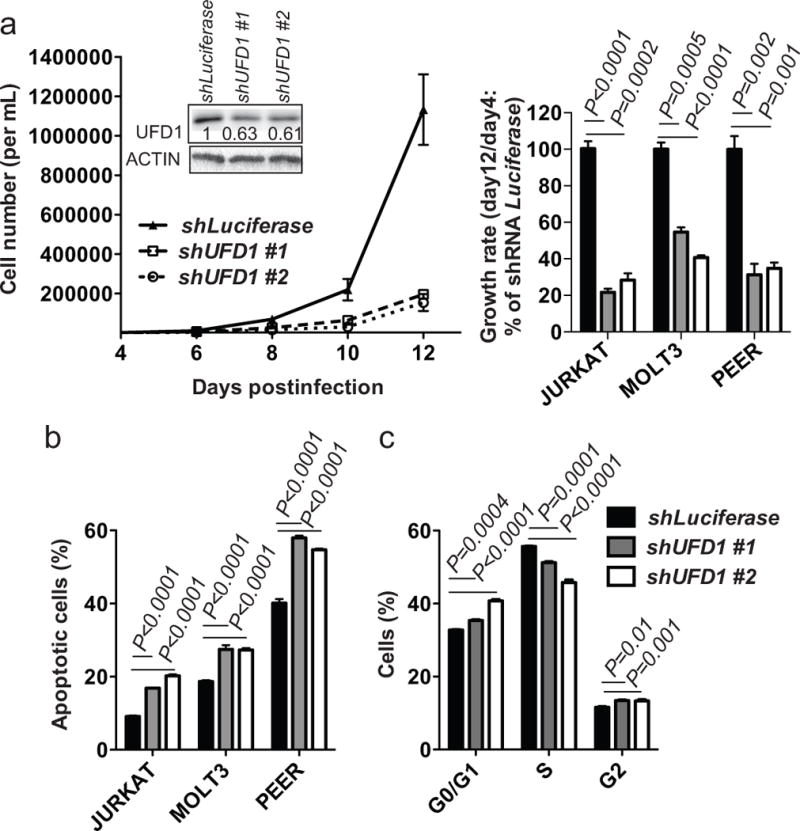
(a) Growth curve of human JURKAT cells was analyzed after transducing with either a control Luciferase shRNA or two UFD1 shRNA hairpins. The insert in panel (a) revealed that the two shUFD1 hairpins decreased about half of the UFD1 protein levels at day 4 postinfection. The right panel illustrates relative growth rate of human JURKAT, MOLT3 and PEER T-ALL cells. (b) Percentage of apoptotic cells upon UFD1 knockdown at day 9 or 10 postinfection in the above three cell lines. Annexin-V staining was performed on cells isolated day 4, 6 and 9/10 postinfection, and apoptosis was detected as early as day 4 postinfection. (c) Genetic knockdown of UFD1 induces moderate cell cycle changes in human JURKAT cells. At day 3 postinfection, cells were fixed and then stained with PI and analyzed by flow cytometry. Representative data from over three independent experimental repeats are shown.
Figure 7. UFD1 inactivation impairs ERAD and activates the proapoptotic UPR through the PERK-CHOP-BCL-2 axis in human T-ALL cells.
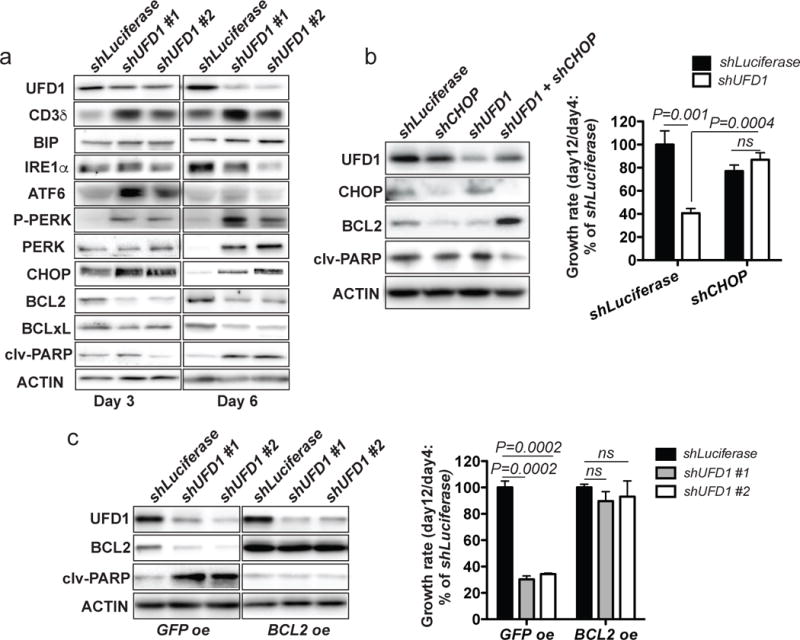
(a) Western blot analysis of UFD1, CD3δ, BIP, IRE1α, ATF6, P-PERK, PERK, CHOP, BCL2, BCLxL, and cleaved PARP (clv-PARP) in JURKAT T-ALL cells at day 3 and 6 postinfection. (b) Western blot analysis of UFD1, CHOP, BCL2, and clv-PARP in JURKAT T-ALL cells at day 6 postinfection (left panel). Relative growth rate of human JURKAT T-ALL cells showed that CHOP knockdown rescued cell growth defects caused by UFD1 knockdown (right panel). (c) Western blot analysis of UFD1, BCL2, and clv-PARP in JURKAT T-ALL cells that either overexpress GFP or BCL2 (left panel). BCL2 overexpression rescued cell growth defects caused by UFD1 knockdown in JURKAT T-ALL cells. Representative data from three independent experiments were shown (right panel). ACTIN serves as a loading control.
UFD1 inactivation impairs ERAD and activates the PERK-mediated proapoptotic UPR in human T-ALL cells
UFD1 functions in the major ERAD complex downstream of the UPR to facilitate the retrotranslocation of misfolded/unfolded proteins from the ER lumen to the cytosol for proteolysis.17 We thus performed Western blotting to examine the protein levels of ERAD substrates and UPR components in human T-ALL cells.20, 34 UFD1 knockdown led to elevated levels of CD3δ (a known ERAD substrate of UFD1),35 ATF6, phospho/total PERK, but not phospho- or total IRE1α in JURKAT, MOLT3, and PEER T-ALL cell lines (Figure 7a, Supplementary Figure 10c, and data not shown). As expected, due to the difference in response kinetics of ER stress transducers,36 the expression levels of these proteins varied at different time points upon UFD1 inactivation in each cell line. However, all three T-ALL cell lines upregulated phospho- and/or total PERK upon UFD1 inactivation. Additionally, we observed upregulation of CHOP, a downstream effector of the PERK-mediated proapoptotic UPR.37 Because CHOP activation leads to downregulation of the antiapoptotic protein BCL2 and subsequent activation of ER-stress-induced apoptosis,38 we performed Western blotting to analyze protein levels of BCL2, BCLxL, and cleaved PARP. Indeed, UFD1 knockdown led to downregulation of BCL2 and BCLxL, as well as an increase in cleaved PARP in all three T-ALL cell lines tested, compared to control cells with shLuciferase knockdown (Figure 7a and Supplementary Figure 10c).
To determine whether the PERK-CHOP-BCL2 axis is crucial to the growth and survival of human T-ALL cells, we transduced human JURKAT and MOLT3 cells with shCHOP and shUFD1, alone or in combination, and measured cell growth from day 4 to 12 postinfection. As expected, knockdown of UFD1 alone induced apoptosis and a significant decrease in cell growth, compared to control cells infected with shLuciferase (Figure 7b and data not shown). Although shCHOP alone slightly decreased cell growth, the combined knockdown of CHOP and UFD1 led to upregulation of BCL2 and rescue of the decreased cell growth (Figure 7b and data not shown). Overexpressing BCL2, a downregulated gene in the CHOP-mediated apoptotic axis, had the same effect in completely rescuing the decreased cell growth induced by UFD1 knockdown (Figure 7c). These results demonstrate that UFD1 inactivation in MYC-dependent T-ALL cells disrupts ERAD and primarily induces the proapoptotic UPR through the PERK-CHOP-BCL2 axis.
DISCUSSION
Tumor progression is facilitated by a number of adaptive mechanisms that enable malignant cells to survive and proliferate in a hostile microenvironment.39–41 Together with oncogenic stress, the adverse microenvironmental conditions, such as free radicals, low oxygen, nutrient deprivation, pH imbalance, and reactive oxygen species, all severely burden the ER with misfolded/unfolded proteins (see Figure 8). The ER quality control system, including the UPR and ERAD, is therefore critical for enabling cells to cope with ER stress.13 Although others have demonstrated that MYC-dependent lymphoma and breast cancer cells activate the UPR to support tumor cell survival,21, 42 whether MYC regulates ERAD remains unclear. Our findings show that while MYC-overexpressing T-ALL cells activate the UPR, they simultaneously enhance ERAD through transcriptional upregulation of UFD1 to support leukemic cell survival. UFD1 inactivation in MYC-dependent T-ALL cells led to an accumulation of its ERAD substrate CD3δ, indicative of defective ERAD function, and exacerbation of ER stress, as demonstrated by increased thioflavin T staining and BIP expression. Importantly, ufd1 heterozygosity induced tumor-cell apoptosis and significantly impaired disease progression in the zebrafish model of MYC-induced T-ALL. Together, our results support the working model that MYC-enhanced expression of UFD1 promotes ERAD and mitigates ER stress, cooperating with the UPR to sustain tumor cell survival and disease progression (Figure 8a). Hence, our studies identify UFD1 as a novel contributor to MYC-mediated cancer aggressiveness.
Figure 8. Schematic diagram to summarize our findings and working model.
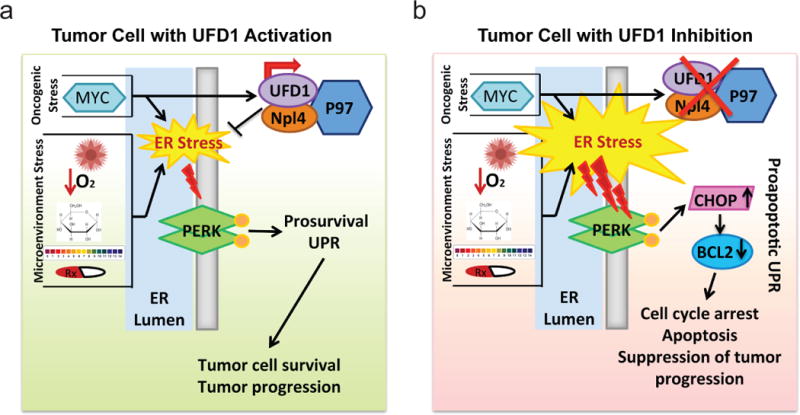
(a) A tumor cell with UFD1 activation. (b) A tumor cell with UFD1 inactivation.
The role of the UPR in supporting tumor cell survival is of great interest for therapeutic exploitation in multiple human cancers.43 Interestingly, MYC-overexpressing T-ALL cells primarily activate the PERK-mediated UPR. Although translation inhibition mediated by PERK activation can induce leukemic cell apoptosis,44, 45 we found that the decreased cell growth upon UFD1 inactivation was fully rescued through downregulation of CHOP or overexpression of BCL2, both of which are downstream effectors of the PERK-mediated proapoptotic UPR. Thus, UFD1 inactivation in MYC-dependent T-ALL cells induces apoptosis primarily through the PERK/CHOP/BCL2 axis instead of through PERK-mediated translation inhibition or the ATF6-mediated UPR. Earlier studies focused on targeting the PERK-mediated UPR as an anti-neoplastic approach. However, PERK inhibitors were found to be highly toxic and cause diabetes.44 We show that a 50% reduction of UFD1 protein induces robust apoptosis and slows proliferation in T-ALL cells but not in non-transformed thymocytes. Underlying this difference is that non-malignant cells do not or minimally experience ER stress, while T-ALL cells are burdened with ER stress due to MYC overexpression and hostile microenvironmental conditions. Our findings support the notion that UFD1 inhibition could serve as a productive approach to activate the PERK-mediated proapoptotic UPR and kill MYC-dependent tumor cells while minimally affecting normal cells (Figure 8b).
Among the three ERAD components, we found that MYC selectively upregulates UFD1 but not P97 or NPL4. Although the involvement of P97 in cancers has been previously demonstrated,45 how P97 promotes tumorigenesis remains elusive. Our studies suggest that the contribution of P97 to MYC-driven tumor development is largely mediated through UFD1. The enhanced UFD1 expression can compete P97 away from other adaptor proteins to enhance its ERAD function. Although P97 inhibitors show preclinical anti-neoplastic efficacy, they likely possess off-target toxicities given that P97 interacts with a myriad of adaptors beyond UFD1.46 Importantly, the enhanced UFD1 expression is observed in multiple human MYC-driven cancers besides T-ALL,47, 48 and predicts poor treatment outcome in ER+ breast cancer and lung cancer (http://kmplot.com/analysis/). Therefore, besides treating MYC-overexpressing refractory/relapsed T-ALL, the therapeutic potential of directly targeting UFD1 could extend to patients with a broad spectrum of MYC-driven cancers, supporting the need to develop UFD1-specific inhibitors.
MATERIALS AND METHODS
Zebrafish husbandry, tumor surveillance, and genotyping
Zebrafish line maintenance and husbandry were performed as previously described in the aquatics facility at the Dana-Farber Cancer Institute under a subcontract and at the Boston University School of Medicine,49 according to standards set by the National Institutes of Health (NIH) and approved protocols of the Institutional Animal Care and Use Committee. Both male and female AB fish younger than 2-year-old were included in the studies. All transgenic and mutant fish were genotyped by gene-specific PCR using primers (Supplementary Table 1) and DNA isolated from either the whole embryo or the tail fin of the individual adult fish as previously described.28 Surveillance for tumor onset and progression were conducted as previously described using published criteria.29 Tumor burden and disease stage were documented by imaging on both brightfield and EGFP/DsRED2 channels using a fluorescent microscope (MVX10; Olympus, Center Valley, PA, USA). The images were quantified with Image J software and processed with Adobe Photoshop (Adobe Systems Incorporated, San Jose, CA, USA).
Patient samples and gene expression analysis
The detailed information for patient samples is included in Supplementary Information. For gene expression analysis of patient samples, previously published gene expression datasets (GSE33470 and GSE42328) were obtained from the NCBI Gene Expression Omnibus, and reanalyzed in this study.18 Both of the studies were carried out on the Illumina HumanHT-12 V4.0 Expression BeadChip. To compare the differential gene expression profiles between normal T cells and T-ALL patient samples, we merged data from the two series of records and applied quantile normalization to the raw data to remove sources of variation between different experiments. The GSEA system from the Broad Institute was used to analyze for the enrichment of the ER stress signature in T cells and T-ALL patient samples. We calculated an enrichment score that reflects the degree to which the gene set is overrepresented at the extremes (top or bottom) of the entire ranked list. The result is significant at False Discovery Rate (FDR) < 25% and at nominal P-values ≤ 5%.
Firefly luciferase assay and ChIP-PCR analysis
Human T-ALL cells were transfected with LightSwitch promoter constructs for UFD1 or β-ACTIN (ACTB) (Switchgear Genomics, Carlsbad, CA, USA) at day 3 postinfection. Luciferase assays were performed at 30 hours posttransfection using a commercial luciferase kit (Switchgear Genomics, Carlsbad, CA, USA).
Human T-ALL cells were cross-linked, sonicated, and subsequently subjected to ChIP using a commercial ChIP kit (Epigentek Group Inc., Farmingdale, NY, USA), together with an anti-MYC or anti-polymerase II or anti-IgG antibody. The input and resultant ChIP DNA were subjected to PCR using two UFD1 and ACTB primers (Supplementary Table 2), spanning their respective promoters.
Statistical analysis
Kaplan-Meier analysis and the log-rank test were used to compare times to tumor onset and progression between Myc;Cre;ufd1+/+ and Myc;Cre;ufd1+/− fish. The sample size was determined based on data previously published.28, 29 Student’s t-test was used to analyze differences in gene expression, tumor burden, cell cycle, number of active caspase-3+ cells, protein levels, Annexin-V-stained cells, and cell viability between control and experimental group, or between any two groups of cells with different genotypes. P-values ≤0.05 were considered statistically significant, and not adjusted for multiple comparisons.
Supplementary Material
Acknowledgments
We thank Drs. A. Thomas Look, David M. Langenau, Anurag Singh, Neil J. Ganem, and Herbert Cohen for helpful discussion and suggestions; as well as Dr. Michael T. Kirber from the Cellular Imaging Core facility at Boston University School of Medicine for his expert help with imaging acquisitions. This study was supported by grants from the NIH (R00CA134743, R56CA215059 and Boston University [BU] pilot grants through 1UL1TR001430 to H.F., R01CA096899 to M.A.K., predoctoral training grant through T32GM008541 to L.N.H.) and fellowship grants from the Rally Foundation and the Alex Lemonade Stand Foundation (N.M.A.). H.F. also acknowledges funding support through a Karin Grunebaum Faculty Fellowship, a BU Ralph Edwards Career Development Professorship, a Young Investigator Award from the Leukemia Research Foundation, a St. Baldrick Scholar grant, and the American Cancer Society (IRG-72-001-36-IRG and RSG-17-204-01-TBG). Y.S., B.L., and J.W.C received the Undergraduate Research Opportunity Program Award at BU. The content of this research is solely the responsibility of the authors and does not necessarily represent the official views of the NIH.
Footnotes
AUTHOR CONTRIBUTIONS
H.F. conceived and supervised the project. The experiments were designed by H.F., L.N.H., N.M.A, F.J.F.L., J.E.R., and C.T.L; and performed by L.N.H., Y.S., B.L., Y.W.W., J.W.C., G.L.Z., L.W., C.T.L., and J.E.R. Data analyses were performed by H.F., L.N.H., L.W., C.T.L., and G.L.Z. Manuscripts were written by H.F. and L.N.H., and revised by N.M.A., Y.S., B.L., and M.A.K.
CONFLICT OF INTEREST DISCLOSURE
The authors declare that no conflict of interest exists.
References
- 1.Nesbit CE, Tersak JM, Prochownik EV. MYC oncogenes and human neoplastic disease. Oncogene. 1999 May 13;18(19):3004–3016. doi: 10.1038/sj.onc.1202746. [DOI] [PubMed] [Google Scholar]
- 2.Pui CH, Robison LL, Look AT. Acute lymphoblastic leukaemia. Lancet. 2008 Mar 22;371(9617):1030–1043. doi: 10.1016/S0140-6736(08)60457-2. [DOI] [PubMed] [Google Scholar]
- 3.Weng AP, Ferrando AA, Lee W, Morris JPt, Silverman LB, Sanchez-Irizarry C, et al. Activating mutations of NOTCH1 in human T cell acute lymphoblastic leukemia. Science. 2004 Oct 8;306(5694):269–271. doi: 10.1126/science.1102160. [DOI] [PubMed] [Google Scholar]
- 4.Sharma VM, Calvo JA, Draheim KM, Cunningham LA, Hermance N, Beverly L, et al. Notch1 contributes to mouse T-cell leukemia by directly inducing the expression of c-myc. Mol Cell Biol. 2006 Nov;26(21):8022–8031. doi: 10.1128/MCB.01091-06. [DOI] [PMC free article] [PubMed] [Google Scholar]
- 5.Weng AP, Millholland JM, Yashiro-Ohtani Y, Arcangeli ML, Lau A, Wai C, et al. c-Myc is an important direct target of Notch1 in T-cell acute lymphoblastic leukemia/lymphoma. Genes Dev. 2006 Aug 1;20(15):2096–2109. doi: 10.1101/gad.1450406. [DOI] [PMC free article] [PubMed] [Google Scholar]
- 6.Palomero T, Lim WK, Odom DT, Sulis ML, Real PJ, Margolin A, et al. NOTCH1 directly regulates c-MYC and activates a feed-forward-loop transcriptional network promoting leukemic cell growth. Proc Natl Acad Sci U S A. 2006 Nov 28;103(48):18261–18266. doi: 10.1073/pnas.0606108103. [DOI] [PMC free article] [PubMed] [Google Scholar]
- 7.Sanchez-Martin M, Ferrando A. The NOTCH1-MYC highway toward T-cell acute lymphoblastic leukemia. Blood. 2017 Mar 02;129(9):1124–1133. doi: 10.1182/blood-2016-09-692582. [DOI] [PubMed] [Google Scholar]
- 8.Bhojwani D, Pui CH. Relapsed childhood acute lymphoblastic leukaemia. Lancet Oncol. 2013 May;14(6):e205–217. doi: 10.1016/S1470-2045(12)70580-6. [DOI] [PubMed] [Google Scholar]
- 9.Lin CY, Loven J, Rahl PB, Paranal RM, Burge CB, Bradner JE, et al. Transcriptional amplification in tumor cells with elevated c-Myc. Cell. 2012 Sep 28;151(1):56–67. doi: 10.1016/j.cell.2012.08.026. [DOI] [PMC free article] [PubMed] [Google Scholar]
- 10.Tu WB, Helander S, Pilstal R, Hickman KA, Lourenco C, Jurisica I. Myc and its interactors take shape. Biochim Biophys Acta. 2015 May;1849(5):469–483. doi: 10.1016/j.bbagrm.2014.06.002. [DOI] [PubMed] [Google Scholar]
- 11.Sabo A, Kress TR, Pelizzola M, de Pretis S, Gorski MM, Tesi A, et al. Selective transcriptional regulation by Myc in cellular growth control and lymphomagenesis. Nature. 2014 Jul 24;511(7510):488–492. doi: 10.1038/nature13537. [DOI] [PMC free article] [PubMed] [Google Scholar]
- 12.Yadav RK, Chae SW, Kim HR, Chae HJ. Endoplasmic reticulum stress and cancer. J Cancer Prev. 2014 Jun;19(2):75–88. doi: 10.15430/JCP.2014.19.2.75. [DOI] [PMC free article] [PubMed] [Google Scholar]
- 13.Kim H, Bhattacharya A, Qi L. Endoplasmic reticulum quality control in cancer: Friend or foe. Semin Cancer Biol. 2015 Aug;33:25–33. doi: 10.1016/j.semcancer.2015.02.003. [DOI] [PMC free article] [PubMed] [Google Scholar]
- 14.Travers KJ, Patil CK, Wodicka L, Lockhart DJ, Weissman JS, Walter P. Functional and genomic analyses reveal an essential coordination between the unfolded protein response and ER-associated degradation. Cell. 2000 Apr 28;101(3):249–258. doi: 10.1016/s0092-8674(00)80835-1. [DOI] [PubMed] [Google Scholar]
- 15.Bertolotti A, Zhang Y, Hendershot LM, Harding HP, Ron D. Dynamic interaction of BiP and ER stress transducers in the unfolded-protein response. Nature cell biology. 2000 Jun;2(6):326–332. doi: 10.1038/35014014. [DOI] [PubMed] [Google Scholar]
- 16.Shen J, Chen X, Hendershot L, Prywes R. ER stress regulation of ATF6 localization by dissociation of BiP/GRP78 binding and unmasking of Golgi localization signals. Dev Cell. 2002 Jul;3(1):99–111. doi: 10.1016/s1534-5807(02)00203-4. [DOI] [PubMed] [Google Scholar]
- 17.Wolf DH, Stolz A. The Cdc48 machine in endoplasmic reticulum associated protein degradation. Biochim Biophys Acta. 2012 Jan;1823(1):117–124. doi: 10.1016/j.bbamcr.2011.09.002. [DOI] [PubMed] [Google Scholar]
- 18.Van Vlierberghe P, Ambesi-Impiombato A, De Keersmaecker K, Hadler M, Paietta E, Tallman MS, et al. Prognostic relevance of integrated genetic profiling in adult T-cell acute lymphoblastic leukemia. Blood. 2013 Jul 4;122(1):74–82. doi: 10.1182/blood-2013-03-491092. [DOI] [PMC free article] [PubMed] [Google Scholar]
- 19.Harding HP, Zhang Y, Zeng H, Novoa I, Lu PD, Calfon M, et al. An integrated stress response regulates amino acid metabolism and resistance to oxidative stress. Mol Cell. 2003 Mar;11(3):619–633. doi: 10.1016/s1097-2765(03)00105-9. [DOI] [PubMed] [Google Scholar]
- 20.Ron D, Walter P. Signal integration in the endoplasmic reticulum unfolded protein response. Nat Rev Mol Cell Biol. 2007 Jul;8(7):519–529. doi: 10.1038/nrm2199. [DOI] [PubMed] [Google Scholar]
- 21.Hart LS, Cunningham JT, Datta T, Dey S, Tameire F, Lehman SL, et al. ER stress-mediated autophagy promotes Myc-dependent transformation and tumor growth. J Clin Invest. 2012 Dec;122(12):4621–4634. doi: 10.1172/JCI62973. [DOI] [PMC free article] [PubMed] [Google Scholar]
- 22.Edgar R, Domrachev M, Lash AE. Gene Expression Omnibus: NCBI gene expression and hybridization array data repository. Nucleic Acids Res. 2002 Jan 01;30(1):207–210. doi: 10.1093/nar/30.1.207. [DOI] [PMC free article] [PubMed] [Google Scholar]
- 23.Rosenbloom KR, Sloan CA, Malladi VS, Dreszer TR, Learned K, Kirkup VM, et al. ENCODE data in the UCSC Genome Browser: year 5 update. Nucleic Acids Res. 2013 Jan;41:D56–63. doi: 10.1093/nar/gks1172. (Database issue) [DOI] [PMC free article] [PubMed] [Google Scholar]
- 24.Langenau DM, Feng H, Berghmans S, Kanki JP, Kutok JL, Look AT. Cre/lox-regulated transgenic zebrafish model with conditional myc-induced T cell acute lymphoblastic leukemia. Proc Natl Acad Sci U S A. 2005 Apr 26;102(17):6068–6073. doi: 10.1073/pnas.0408708102. [DOI] [PMC free article] [PubMed] [Google Scholar]
- 25.Blackburn JS, Liu S, Raiser DM, Martinez SA, Feng H, Meeker ND, et al. Notch signaling expands a pre-malignant pool of T-cell acute lymphoblastic leukemia clones without affecting leukemia-propagating cell frequency. Leukemia. 2012 Sep;26(9):2069–2078. doi: 10.1038/leu.2012.116. [DOI] [PMC free article] [PubMed] [Google Scholar]
- 26.Gutierrez A, Grebliunaite R, Feng H, Kozakewich E, Zhu S, Guo F, et al. Pten mediates Myc oncogene dependence in a conditional zebrafish model of T cell acute lymphoblastic leukemia. The Journal of experimental medicine. 2011 Aug 01;208(8):1595–1603. doi: 10.1084/jem.20101691. [DOI] [PMC free article] [PubMed] [Google Scholar]
- 27.Amsterdam A, Nissen RM, Sun Z, Swindell EC, Farrington S, Hopkins N. Identification of 315 genes essential for early zebrafish development. Proc Natl Acad Sci U S A. 2004 Aug 31;101(35):12792–12797. doi: 10.1073/pnas.0403929101. [DOI] [PMC free article] [PubMed] [Google Scholar]
- 28.Feng H, Langenau DM, Madge JA, Quinkertz A, Gutierrez A, Neuberg DS, et al. Heat-shock induction of T-cell lymphoma/leukaemia in conditional Cre/lox-regulated transgenic zebrafish. Br J Haematol. 2007 Jul;138(2):169–175. doi: 10.1111/j.1365-2141.2007.06625.x. [DOI] [PubMed] [Google Scholar]
- 29.Feng H, Stachura DL, White RM, Gutierrez A, Zhang L, Sanda T, et al. T-lymphoblastic lymphoma cells express high levels of BCL2, S1P1, and ICAM1, leading to a blockade of tumor cell intravasation. Cancer Cell. 2010 Oct 19;18(4):353–366. doi: 10.1016/j.ccr.2010.09.009. [DOI] [PMC free article] [PubMed] [Google Scholar]
- 30.Chen M, Gutierrez GJ, Ronai ZA. Ubiquitin-recognition protein Ufd1 couples the endoplasmic reticulum (ER) stress response to cell cycle control. Proc Natl Acad Sci U S A. 2011 May 31;108(22):9119–9124. doi: 10.1073/pnas.1100028108. [DOI] [PMC free article] [PubMed] [Google Scholar]
- 31.Beriault DR, Werstuck GH. Detection and quantification of endoplasmic reticulum stress in living cells using the fluorescent compound, Thioflavin T. Biochim Biophys Acta. 2013 Oct;1833(10):2293–2301. doi: 10.1016/j.bbamcr.2013.05.020. [DOI] [PubMed] [Google Scholar]
- 32.Shiu RP, Pouyssegur J, Pastan I. Glucose depletion accounts for the induction of two transformation-sensitive membrane proteinsin Rous sarcoma virus-transformed chick embryo fibroblasts. Proc Natl Acad Sci U S A. 1977 Sep;74(9):3840–3844. doi: 10.1073/pnas.74.9.3840. [DOI] [PMC free article] [PubMed] [Google Scholar]
- 33.Lee AS. The ER chaperone and signaling regulator GRP78/BiP as a monitor of endoplasmic reticulum stress. Methods. 2005 Apr;35(4):373–381. doi: 10.1016/j.ymeth.2004.10.010. [DOI] [PubMed] [Google Scholar]
- 34.Elsasser S, Finley D. Delivery of ubiquitinated substrates to protein-unfolding machines. Nature cell biology. 2005 Aug;7(8):742–749. doi: 10.1038/ncb0805-742. [DOI] [PubMed] [Google Scholar]
- 35.Ballar P, Shen Y, Yang H, Fang S. The role of a novel p97/valosin-containing protein-interacting motif of gp78 in endoplasmic reticulum-associated degradation. J Biol Chem. 2006 Nov 17;281(46):35359–35368. doi: 10.1074/jbc.M603355200. [DOI] [PubMed] [Google Scholar]
- 36.Woehlbier U, Hetz C. Modulating stress responses by the UPRosome: a matter of life and death. Trends Biochem Sci. 2011 Jun;36(6):329–337. doi: 10.1016/j.tibs.2011.03.001. [DOI] [PubMed] [Google Scholar]
- 37.Ma Y, Brewer JW, Diehl JA, Hendershot LM. Two distinct stress signaling pathways converge upon the CHOP promoter during the mammalian unfolded protein response. J Mol Biol. 2002 May 17;318(5):1351–1365. doi: 10.1016/s0022-2836(02)00234-6. [DOI] [PubMed] [Google Scholar]
- 38.McCullough KD, Martindale JL, Klotz LO, Aw TY, Holbrook NJ. Gadd153 sensitizes cells to endoplasmic reticulum stress by down-regulating Bcl2 and perturbing the cellular redox state. Mol Cell Biol. 2001 Feb;21(4):1249–1259. doi: 10.1128/MCB.21.4.1249-1259.2001. [DOI] [PMC free article] [PubMed] [Google Scholar]
- 39.Kozutsumi Y, Segal M, Normington K, Gething MJ, Sambrook J. The presence of malfolded proteins in the endoplasmic reticulum signals the induction of glucose-regulated proteins. Nature. 1988 Mar 31;332(6163):462–464. doi: 10.1038/332462a0. [DOI] [PubMed] [Google Scholar]
- 40.Dong D, Stapleton C, Luo B, Xiong S, Ye W, Zhang Y, et al. A critical role for GRP78/BiP in the tumor microenvironment for neovascularization during tumor growth and metastasis. Cancer Res. 2011 Apr 15;71(8):2848–2857. doi: 10.1158/0008-5472.CAN-10-3151. [DOI] [PMC free article] [PubMed] [Google Scholar]
- 41.Mahadevan NR, Zanetti M. Tumor stress inside out: cell-extrinsic effects of the unfolded protein response in tumor cells modulate the immunological landscape of the tumor microenvironment. J Immunol. 2011 Nov 01;187(9):4403–4409. doi: 10.4049/jimmunol.1101531. [DOI] [PMC free article] [PubMed] [Google Scholar]
- 42.Shajahan-Haq AN, Cook KL, Schwartz-Roberts JL, Eltayeb AE, Demas DM, Warri AM, et al. MYC regulates the unfolded protein response and glucose and glutamine uptake in endocrine resistant breast cancer. Mol Cancer. 2014 Oct 23;13:239. doi: 10.1186/1476-4598-13-239. [DOI] [PMC free article] [PubMed] [Google Scholar]
- 43.Ojha R, Amaravadi RK. Targeting the unfolded protein response in cancer. Pharmacol Res. 2017 Jun;120:258–266. doi: 10.1016/j.phrs.2017.04.003. [DOI] [PMC free article] [PubMed] [Google Scholar]
- 44.Atkins C, Liu Q, Minthorn E, Zhang SY, Figueroa DJ, Moss K, et al. Characterization of a novel PERK kinase inhibitor with antitumor and antiangiogenic activity. Cancer Res. 2013 Mar 15;73(6):1993–2002. doi: 10.1158/0008-5472.CAN-12-3109. [DOI] [PubMed] [Google Scholar]
- 45.Fessart D, Marza E, Taouji S, Delom F, Chevet E. P97/CDC-48: proteostasis control in tumor cell biology. Cancer Lett. 2013 Aug 28;337(1):26–34. doi: 10.1016/j.canlet.2013.05.030. [DOI] [PubMed] [Google Scholar]
- 46.Dargemont C, Ossareh-Nazari B. Cdc48/p97, a key actor in the interplay between autophagy and ubiquitin/proteasome catabolic pathways. Biochim Biophys Acta. 2012 Jan;1823(1):138–144. doi: 10.1016/j.bbamcr.2011.07.011. [DOI] [PubMed] [Google Scholar]
- 47.Chen X, Ran ZH, Tong JL, Nie F, Zhu MM, Xu XT, et al. RNA interference (RNAi) of Ufd1 protein can sensitize a hydroxycamptothecin-resistant colon cancer cell line SW1116/HCPT to hydroxycamptothecin. J Dig Dis. 2011 Apr;12(2):110–116. doi: 10.1111/j.1751-2980.2011.00478.x. [DOI] [PubMed] [Google Scholar]
- 48.Uhlen M, Zhang C, Lee S, Sjostedt E, Fagerberg L, Bidkhori G, et al. A pathology atlas of the human cancer transcriptome. Science. 2017 Aug 18;357(6352) doi: 10.1126/science.aan2507. [DOI] [PubMed] [Google Scholar]
- 49.Westerfield M. The Zebrafish Book: A Guide for the Laboratory Use of Zebrafish (Brachydanio rerio) University of Oregon Press; Eugene, OR: 1994. [Google Scholar]
- 50.Zhang Y, Liu T, Meyer CA, Eeckhoute J, Johnson DS, Bernstein BE, et al. Model-based analysis of ChIP-Seq (MACS) Genome Biol. 2008;9(9):R137. doi: 10.1186/gb-2008-9-9-r137. [DOI] [PMC free article] [PubMed] [Google Scholar]
- 51.Langmead B, Trapnell C, Pop M, Salzberg SL. Ultrafast and memory-efficient alignment of short DNA sequences to the human genome. Genome Biol. 2009;10(3):R25. doi: 10.1186/gb-2009-10-3-r25. [DOI] [PMC free article] [PubMed] [Google Scholar]
Associated Data
This section collects any data citations, data availability statements, or supplementary materials included in this article.


