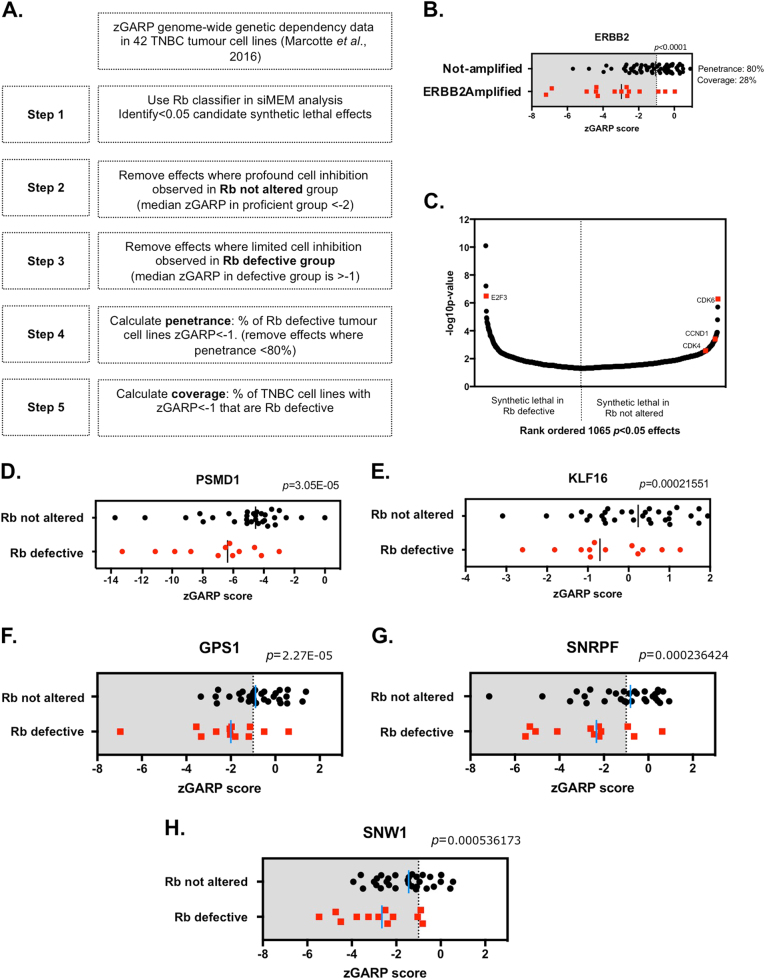
Fig. 2.
Identifying highly penetrant Rb synthetic lethal effects that operate in TNBC. a Schematic illustrating the data analysis workflow used. In the first instance, 16 056 gene zGARP scores from shRNA screens in 42 TNBC cell lines described in the Colt2 data set were analysed; parallel analyses were carried out using data from the DRIVE and Achilles data sets (see main text). b Scatter plot illustrating ERBB2 zGARP scores in 77 breast tumour cell lines partitioned according to effects in ERBB2-amplified and -non-amplified TCLs. ERBB2 shRNA elicits a p < 0.0001 oncogene addiction effect (siMEM) with 80% penetrance in ERBB2-amplified tumour cell lines (red). Coverage is also shown. c Scatter plot illustrating 1065 p < 0.05 significant siMEM Rb synthetic lethal effects identified from the siMEM analysis of TNBC TCLs in the Colt2 study (step one in a). p < 0.05 effects are ranked ordered by siMEM p value. E2F3 (synthetic lethal in Rb-defective), CDK6, CDK4 and the CDK4,6 cyclin partner, Cyclin D1 (CCND1) (dependencies in Rb not altered) are highlighted. d, e. Scatter plots illustrating Z scores in 42 TNBC TCLs for two siMEM p < 0.05 candidate Rb synthetic lethal effects, PSMD1 (D) and KLF16 (E), removed from further analysis by the use of Z score filters (steps two and three in a). zGARP scores for PSMD1 (preferentially target Rb-defective, siMEM p value 3 × 10⁻⁵) indicate all but two Rb not altered tumour cell lines exhibit Z score of <−2 (median Z in not altered group < −4). zGARP scores for KLF16 (preferentially target Rb-defective, siMEM p value 0.0002) indicate that the majority of Rb-defective TCLs exhibit Z score of >−1 (median Z in defective group = −0.8), despite median Z scores being significantly different in Rb not altered vs. deficient TCLs. f–h Scatter plots illustrating Z scores in 42 TNBC TCLs for three siMEM p < 0.05 candidate Rb synthetic lethal effects, GPS1, SNRPF and SNW1, where median Z in defective group < −1 and median Z in proficient group > −2 (steps two and three in a)

