

Abstract
Background:
Standard automated perimetry does not sufficiently detect early open-angle glaucoma (OAG) in the clinic. New visual function tests for early glaucoma damage are therefore needed. The present study evaluated whether an isolated-check visual evoked potential (icVEP) could be used to detect visual function abnormalities in early-stage OAG and to explore potential related factors.
Methods:
This was a cross-sectional study. Thirty-seven OAG patients with early-stage visual field loss (mean deviation ≥ −6.00 dB) detected by the Humphrey Field Analyzer (30-2 SITA program) and 26 controls were included in this study. Optical coherence tomography (OCT) was used to detect retinal nerve fiber layer (RNFL) defects. The icVEP preferentially evaluates the magnocellular-ON pathway. VEPs were recorded and signal-to-noise ratios (SNRs) were derived based on multivariate analysis. Eyes that yielded an SNR ≤1 were considered abnormal. Receiver operating characteristic (ROC) curve analysis was used to estimate the accuracy of group classification. Correlations between SNRs and related factors were analyzed.
Results:
Based on an SNR criterion of 1, the icVEP had a sensitivity of 62.2% and a specificity of 92.3% for diagnosing early-stage OAG with 74.6% classification accuracy. The ROC curve analysis, however, suggested that an SNR criterion of 0.93 would produce the highest classification accuracy (77.3%). Both RNFL thinning in the temporal superior quadrant on OCT and number of abnormal test points in the central 11° visual field (pattern deviation, P < 0.5%) significantly correlated with the SNR (P < 0.05).
Conclusions:
The icVEP detected visual function abnormalities in approximately 3/5 of eyes with early-stage OAG with greater than 90% specificity. SNR correlated with both a decrease in RNFL thickness and severity of central visual field loss.
Keywords: Cross-Sectional Study, Isolated-Check, Open-Angle Glaucoma, Signal-To-Noise Ratios, Visual Evoked Potential
摘要
背景:
标准自动视野计(SAP)在临床中无法充分地检测早期开角型青光眼。我们需要新型的视功能检查法来检测早期青光眼损 伤。本研究将评估分离格栅视觉诱发电位(icVEP)在检测早期开角型青光眼(OAG)视功能异常中的能力,探索其潜力及相关因 素。
方法:
这是一项横断面研究。37名结合标准自动视野计(Humphery视野分析仪,30-2 SITA程序)检测结果(MD≥-6dB)诊断 为早期视野异常的早期OAG患者,以及26名健康志愿者被纳入该研究。光学相干断层扫描(OCT)用于检测OAG患者的视网 膜神经纤维层(RNFL)缺损。icVEP能够特异性地刺激视网膜神经节细胞的大细胞(M细胞)ON通路。刺激产生视觉诱发电 位被记录下来,通过多元统计方法得到信号噪声比(SNR)。SNR=1被考虑为icVEP结果异常。受试者工作特征(ROC)曲线 用于分析SNR分组的准确度。进一步分析相关因素与SNR的相关性。
结果:
SNR判定值为1时,icVEP对早期OAG诊断的灵敏度为62.2%、特异度为92.3%,准确度为74.6%;而当SNR判定值为0.93 时准确度达到最高值(77.3%),相应的灵敏度59.5%、特异度100%。颞上象限RNFL厚度的变薄以及中心11°视野的异常测试点 数(模式偏差图,P <0.5%)均与SNR显著相关(P <0.05)。
结论:
icVEP能够检测出早期OAG患者的近3/5存在青光眼性视功能异常,特异度超过90%;其评价指标SNR与OCT测得的RNFL 厚度的下降以及中心11°视野缺损的程度均有相关性。
INTRODUCTION
Open-angle glaucoma (OAG) is a leading cause of blindness, thus requiring early detection and diagnosis. As the current gold standard for glaucomatous visual loss detection, visual field tests based on conventional standard automated perimetry (SAP) do not adequately detect early glaucomatous functional losses until 20–40% of the retinal ganglion cells are damaged.[1,2] Moreover, as a subjective psychophysical test, SAP is also variable with only moderate test–retest reliability, and it is a time-consuming and difficult task for the patient.[3] Although objective electrophysiologic measures of visual field function such as the multifocal visual evoked potential (VEP) and the pattern electroretinogram have been applied to diagnose glaucoma, the multifocal VEP is more time-consuming than the SAP and the pattern electroretinogram does not provide topographic information.[4,5,6,7] Recently, a new technique, the isolated-check VEP (icVEP), was reported to detect glaucomatous damage earlier and faster.[8]
“Isolated-check” means that a specific cell or pathway can be examined. There are several ganglion cell subpopulations in the retina, such as magnocellular (M) cells and parvocellular (P) cells, which represent parallel pathways for transmitting visual information to the brain.[9] The ON and OFF pathways govern the separate perceptions of brightness and darkness, respectively.[10,11] In humans, M cells are considerably larger than P cells, and M-ON cells are considerably larger than M-OFF cells.[12] The M and P pathways (each one with ON and OFF subdivisions) are functionally distinct: the M pathway conveys primarily low spatial frequency/high temporal frequency information.[1] Therefore, cells in M-ON pathway are sensitive to low levels of luminance contrast but rather insensitive to chromatic information and having larger diameter axons that could be preferentially damaged in early glaucoma and might result in visual field loss.[13,14] To measure M-ON pathway function, the icVEP was designed to create a low spatial frequency/high temporal frequency bright stimulus, recording cortical activities initiated primarily by afferents in the M-ON pathway.[15,16,17,18]
Recent studies demonstrated that the accuracy of the icVEP for diagnosing glaucoma is high, ranging from 91% to 100%,[8,17] especially for early glaucoma in Asians with a sensitivity of 53.1–82.2% and a specificity of 57.6–90%.[19,20,21] Age and sex differences in samples between patients and healthy controls existed in these studies, however, and none of these studies evaluated the diagnostic value of the icVEP in only patients diagnosed with early stage of OAG, comprising both primary OAG (POAG) and normal-tension glaucoma (NTG). Therefore, we performed this cross-sectional study in China to further evaluate the potential diagnostic value of the icVEP in patients with early-stage POAG and NTG.
METHODS
Ethical approval
This study was approved by the Ethics Committee Review Board of Peking University Third Hospital and conformed to the Declaration of Helsinki. All patients and controls provided their written informed consent to participate in the study.
Subjects and selection criteria
Subjects were consecutive patients with OAG and healthy volunteers were recruited as controls from the Department of Ophthalmology, Peking University Third Hospital, from June 2014 to January 2015.
Inclusion criteria for all participants were 25–75 years old, best-corrected visual acuity better than 0.3 (logarithm of the minimum angle of resolution), spherical refraction within −6 to +3 diopters, and transparent ocular media. In addition, OAG patients required the presence of OAG (participants with open angle, visual field defects corresponding to glaucomatous optic neuropathy [GON], having normal or elevated intraocular pressure [IOP] without secondary causes) in which the IOP was medically well controlled and reliable visual field test results (false-positive errors <20%, false-negative errors <20%, and fixation losses <30%) showed early glaucomatous visual field defects on SAP; the controls had no ocular abnormalities, especially no GON in either eye and normal IOP, never >21 mmHg (1 mmHg = 0.133 kPa). Exclusion criteria for all participants were diabetes or any other systemic disease, history of ocular or neurologic disease, unequal pupil diameters and pupil diameters <2.0 mm, poor fixation, current use of a medication that could affect visual field sensitivity, or previous history of intraocular surgery or refractory surgery.
Examinations for diagnosis of open-angle glaucoma
At least two reliable SAP tests were performed with the Humphrey Field Analyzer II (HFA II 750i, Carl Zeiss Meditec Inc., Dublin, German) 30-2 SITA standard program for all the patients at baseline. To minimize the learning effect, the second reliable visual field result obtained was used in the study.[22] Spectacle corrections were used to decrease the possible effect of a blur on visual field sensitivity. An early-stage glaucomatous visual field result was defined as mean deviation (MD) ≥ −6.00 dB and at least one of the following: (1) on a pattern deviation plot, there a cluster of three or more points in an expected location of the visual field depressed below the 5% level, at least one of which is depressed below the 1% level; (2) corrected pattern standard deviation/pattern standard deviation significant at P < 0.05; (3) glaucoma hemifield test “outside normal limits.”[23]
Baseline examination comprised a complete ophthalmologic examination including visual acuity, refraction, pupil diameter measurement with a ruler in the natural light, slit-lamp biomicroscopy, gonioscopy, Goldmann applanation tonometry, and dilated stereoscopic fundus examination and stereoscopic photographs of the optic nerve heads for all participants.
Baseline IOP was measured by Goldmann tonometer during glaucoma service time (8 a.m. to 11 a.m.) on the day after receiving the icVEP test reports. A 24-h Goldmann tonometer measurement was also needed to discriminate patients with POAG and NTG based on the maximum IOP. A central corneal thickness measurement using ultrasound pachymetry (DGH 500 Pachette™, DGH Technology, Exton, PA, USA) was also obtained for each patient under topical anesthesia.[24] An average of five consecutive readings was recorded.
Stereoscopic fundus photographs (CR-2 AF Digital Non-Mydriatic Retinal Camera, Canon U.S.A., Inc., Melville, NY, USA) were acquired for each patient after pupil dilation. Fundi were examined with an ophthalmoscope, and the fundus photographs were evaluated in a masked fashion by two experienced doctors. Discrepancies between the two doctors were either resolved by consensus or by adjudication by a third experienced doctor. We recorded the vertical cup-to-disk ratio. GON was defined as: rim-to-disc ratio <0.1 in the upper or lower rims or retinal nerve fiber layer (RNFL) defects or optic disc splinter hemorrhages.[25,26]
Each patient additionally underwent an optical coherence tomography (OCT; Spectralis spectral-domain OCT [SD-OCT], Heidelberg Engineering, Heidelberg, Germany) examination to confirm the RNFL defects corresponding to the stereoscopic photographs and HFA results, and the changing of RNFL thickness in temporal superior quadrant and temporal inferior quadrant was recorded as follow: thickness change in RNFL = RNFL thickness value − the standard value from a database of normal people [Figure 1b].
Figure 1.

The results of a typical case of early-stage OAG: (a) Abnormal icVEP results; (b) outcomes of peripapillary RNFLT classification on the report of OCT. Thickness change in RNFL = RNFLT value (black number) − the standard value from a database of normal people (green number in brackets); (c) Central 16 test points of the pattern deviation on the Humphrey Field Analyzer 30-2 SITA program corresponding to central 11° visual field. RNFL: Retinal nerve fiber layer; RNFLT: Retinal nerve fiber layer thickness; OCT: Optical coherence tomography; G: Global; N: Nasal; T: Temporal; NS: Nasal superior; TS: Temporal superior; NI: Nasal inferior; TI: Temporal inferior; icVEP: Isolated-check visual evoked potential; OAG: Open-angle glaucoma.
Isolated-check visual evoked potential
The icVEP (Neucodia novel electrophysiologic instrument, Huzhou Medconova Medical Technology Co., Ltd., Zhejiang Province, China) was performed for both eyes of each participant. The hardware of this instrument required re-examining the appropriate stimulus conditions required to favor M-ON pathway stimulation, using a standard video card with 8-bit digital-to-analog converters per display and a 60-Hz frame rate, and the luminance of the display's static background was 51 cd/m2. A sinusoidal temporal signal of 10 Hz (6 frames/cycle) and 15% positive-contrast (bright) condition was selected to differentiate OAG patients and controls. The test protocol was 2 s: in the first second, half the test contrast level (7.5%) was presented as an adaptation condition, and in the next second, the full test contrast (15.0%) was presented to elicit the desired VEP. The spatial pattern was a 24 × 24 array of isolated-checks to subtend a 11° visual field at a testing distance of 114 cm, and a fixation cross-cue facilitated careful fixation on the center of the screen [Figure 2].[8]
Figure 2.
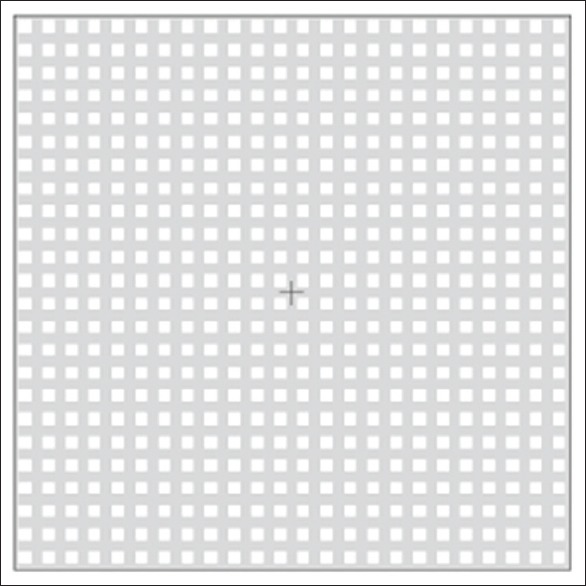
Example of a bright-check condition (positive contrast) on a screen of the icVEP. icVEP: Isolated-check visual evoked potential.
Gold-cup electrodes filled with electrolytic water-soluble paste were placed at the following midline sites on the scalp based on the international 10–20 system [Figure 3].[8] The electroencephalographic (EEG) signals were recorded, and the data were analyzed using a discrete Fourier transform. If noise was detected, the EEG epoch was rejected, and the program prompted the operator to repeat the run. If the run was determined to be valid, the EEG data were displayed on the operator's monitor, and the operator was prompted to either accept or reject the data based on both inspection for additional artifacts and whether proper fixation was maintained during the run. If the data were accepted, the program instructed the operator to initiate the next run until a set of eight valid runs was accumulated. Each run produced a fundamental frequency component (FFC), and if one of the FFCs was an outlier relative to the remaining seven FFCs, the program would discard that FFC and prompt the operator to repeat the run until eight qualified runs were collected. Given these eight FFCs, the program calculated the mean FFC and the radius of a 95% confidence circle using the T2circ statistic.[8] The signal-to-noise ratio (SNR) was defined as the ratio of the mean amplitude of the FFC to the radius of the 95% confidence circle, and it was used to assess the reliability of the VEP. Thus, SNR >1 indicated a significant response at the 0.05 level, suggesting normal electrophysiologic activity of the optic nerve, recorded as SNR negative; SNR ≤1 indicated the response was similar to or weaker than the background noise at the 0.05 level, suggesting abnormal electrophysiologic activity of the optic nerve, recorded as SNR positive. At the end of the test, the individual and mean FFC values, confidence circle, and SNR were displayed on the operator's monitor within <1 min [Figure 1a].
Figure 3.
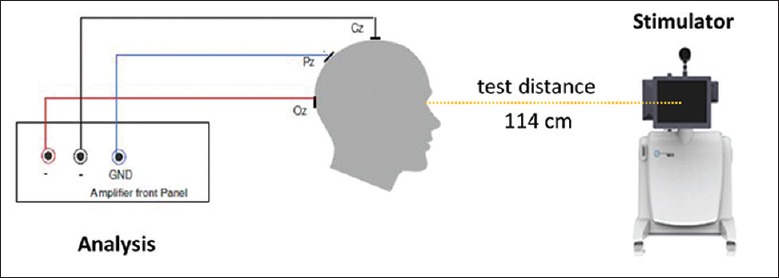
The diagrammatic sketch of the icVEP examination. icVEP: Isolated-check visual evoked potential; GND: Grounding electrode; Cz: Central midline; Pz: Parietal midline; Oz: Occipital midline.
After spectacle correction according to the distance of the test, a flowchart was used to facilitate the operator in obtaining reliable results. The difference in the radius between the right and left eyes of the participant should be <0.2 to exclude the effect of emotion; otherwise, the operator must initiate a retest after an at least 30-min rest. A confirmed icVEP required either two consecutive reliable tests with SNR ≤1 or two consecutive tests with SNR >1, and the latter test was recorded.
Statistical analysis
For each participant, all the data were collected within 3 months. If both eyes of the patient met the inclusion criteria, one eye was randomly selected for analysis. Furthermore, only one eye of controls was randomly selected for analysis. Normally distributed variables were compared with the independent-sample t-test. Numeric variables that were not normally distributed were compared with the Mann–Whitney U-test. Binomial variables were compared with the Chi-square test or Fisher's exact test when necessary. Receiver operating characteristic (ROC) curve analysis was used to estimate the accuracy of prediction for the presence of glaucomatous damage. The 95% confidence limits for the area under the ROC curve were calculated based on the 2 × 2 contingency table. Furthermore, especially for the patients, correlations between the SNR and parameters even for the abnormalities in the central 11° field on SAP were analyzed using the Pearson correlation test. All statistical tests were run by the SPSS 22.0 statistical package (version 22.0.0.0, IBM Co., USA). Results of univariate comparisons were considered significant if P < 0.05.
RESULTS
Thirty-seven OAG patients met the criteria and had complete clinical data. Twenty-six age-matched controls were included in the study according to the statistical calculation. All 63 participants were Chinese (39 men and 24 women) with a mean age of 50.54 ± 13.70 (range 27–74) years. Table 1 shows the clinical characteristics. Age, sex, right/left eye, best-corrected visual acuity (BCVA), spherical equivalent, and pupil diameters were not significantly different between OAG patients and controls (P > 0.05). The SNR, however, was significantly lower in OAG patients than in controls (P < 0.05). None of the participants complained about the icVEP test procedure.
Table 1.
Clinical characteristics of the OAG patients and controls at baseline
| Variables | OAG patients (n = 37) | Control observers (n = 26) | Statistical value | P |
|---|---|---|---|---|
| Age (years) | 50.32 ± 10.44 | 50.85 ± 15.57 | −0.302* | 0.764 |
| Gender (male/female), n | 24/13 | 15/11 | 0.333† | 0.564 |
| Right eyes/left eyes, n | 16/21 | 13/13 | 0.281† | 0.596 |
| Diagnosis (POAG/NTG), n | 24/13 | NA | NA | NA |
| BCVA (logMAR) | 0.04 ± 0.06 | 0.02 ± 0.05 | NA‡ | 0.171 |
| Spherical equivalent (D) | −1.98 ± 2.22 | −1.30 ± 1.99 | NA‡ | 0.148 |
| Pupil diameters (mm) | 3.46 ± 0.51 | 3.35 ± 0.49 | NA‡ | 0.372 |
| icVEP-SNR | 0.89 ± 0.56 | 1.33 ± 0.42 | NA‡ | 0.000 |
*Independent-sample t-test, †Chi-square test, ‡Mann–Whitney U-test. BCVA: Best-corrected visual acuity; icVEP: Isolated-check visual evoked potential; logMAR: Logarithm of the minimum angle of resolution; NTG: Normal-tension glaucoma; OAG: Open-angle glaucoma; POAG: Primary open-angle glaucoma; SNR: Signal-to-noise ratio; NA: Not available.
The icVEP revealed that 23 eyes of early OAG patients were SNR positive (62.2%) whereas only 2 eyes in the control group (7.7%) were SNR positive. Based on an SNR criterion of 1, the icVEP had a sensitivity of 62.2% and a specificity of 92.3% for diagnosing early OAG, with an accuracy of 47/63 (74.6%). The ROC analysis result, however, indicated that an a priori SNR criterion of 0.93 was optimal for discriminating patients and controls [Figure 4]. Thus, based on an SNR criterion of 0.93, the specificity of the test reached 100% with a sensitivity of 59.5%. Using a nonparametric estimate of the area under the ROC curve, the accuracy of the test was 77.3%, and the 95% confidence interval for the area under the ROC curve was 0.66–0.89 (P < 0.001).
Figure 4.
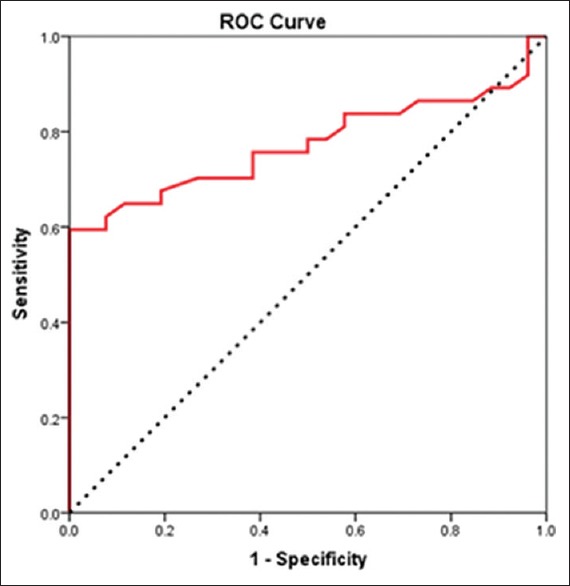
ROC curve for the data collected from the SNR of icVEP of OAG patients and controls. ROC: Receiver operating characteristic; SNR: Signal-to-noise ratios; icVEP: Isolated-check visual evoked potential; OAG: Open-angle glaucoma.
Factors related to SNR were also analyzed. For OAG patients, thickness changes in the RNFL in the temporal superior quadrant significantly correlated with the SNR [P < 0.05, Table 2], whereas SAP-MD, SAP-MD of the other eye, thickness changes in the RNFL in the temporal inferior quadrant, baseline IOP, and central corneal thickness did not correlate with the SNR [P > 0.05, Table 2]. Moreover, abnormalities in the central 11° visual field [pattern deviation on HFA, central 16 test points, Figure 1c] were calculated based on the numbers of abnormal points from different possible criteria. When setting the criterion level of P < 0.5%, the number of abnormal test points in the central 11° significantly correlated with the SNR [P < 0.05, Table 3] with a correlation coefficient of r = −0.107.
Table 2.
Correlations between icVEP-SNR and related factors for patients with OAG
| Variables | Mean ± SD (n = 37) | r | Statistical value* | P |
|---|---|---|---|---|
| SAP-MD (dB) | −3.85 ± 1.26 | 0.068 | 0.153 | 0.367 |
| SAP-MD of the other eye (dB) | −5.19 ± 4.08 | −0.016 | −0.118 | 0.488 |
| OCT-thickness change in RNFL (μm) | ||||
| Temporal superior quadrant | −37.40 ± 31.70 | 0.007 | 0.363 | 0.032 |
| Temporal inferior quadrant | −47.74 ± 29.22 | −0.030 | −0.151 | 0.388 |
| Baseline IOP (mmHg) | 15.78 ± 2.84 | −0.040 | −0.203 | 0.228 |
| CCT (μm) | 525.74 ± 26.03 | 0.002 | 0.083 | 0.657 |
*Pearson correlation test. 1 mmHg = 0.133 kPa. CCT: Central corneal thickness; icVEP: Isolated-check visual evoked potential; IOP: Intraocular pressure; MD: Mean deviation; OCT: Optical coherence tomography; RNFL: Retinal nerve fiber layer; SAP: Standard automated perimetry (HFA 30-2 SITA); SNR: Signal-to-noise ratio; HFA: Humphrey Field Analyzer; SD: Standard deviation.
Table 3.
Correlations between icVEP-SNR and abnormalities in the central 11° visual field of SAP of OAG patients
| Numbers of abnormal test points | Mean ± SD (n = 37) | r | Statistical value* | P |
|---|---|---|---|---|
| P<5% | 4.08 ± 2.70 | −0.057 | −0.273 | 0.103 |
| P<2% | 2.86 ± 2.42 | −0.075 | −0.324 | 0.050 |
| P<1% | 2.11 ± 2.17 | −0.077 | −0.297 | 0.074 |
| P<0.5% | 1.46 ± 1.84 | −0.107 | −0.348 | 0.035 |
*Pearson correlation test. icVEP: Isolated-check visual evoked potential; SAP: Standard automated perimetry; SNR: Signal-to-noise ratio; SD: Standard deviation; OAG: Open-angle glaucoma.
Furthermore, differences between POAG and NTG patients were analyzed [Table 4]. Age, sex, right/left eye, BCVA, spherical equivalent, and pupil diameters were not significantly different between POAG and NTG patients. In addition, SAP and OCT parameters were also similar between these two groups (P > 0.05). Moreover, SNR and sensitivity of icVEP were not significantly different between POAG and NTG patients (P > 0.05).
Table 4.
Comparison of clinical characteristics between POAG and NTG patients
| Variables | POAG patients (n = 24) | NTG patients (n = 13) | Statistical value | P |
|---|---|---|---|---|
| Age (years) | 51.46 ± 12.04 | 48.23 ± 13.39 | 0.749* | 0.459 |
| Gender (male/female), n | 16/8 | 8/5 | NA | 0.515‡ |
| Right eyes/left eyes, n | 11/13 | 5/8 | 0.187† | 0.468 |
| BCVA (logMAR) | 0.05 ± 0.07 | 0.04 ± 0.07 | NA | 0.766§ |
| Spherical equivalent (D) | −1.90 ± 2.31 | −2.13 ± 2.15 | NA | 0.814§ |
| Pupil diameters (mm) | 3.42 ± 0.50 | 3.54 ± 0.52 | NA | 0.561§ |
| SAP-MD (dB) | −3.91 ± 1.18 | −3.73 ± 1.44 | NA | 0.695§ |
| SAP-MD of the other eye (dB) | −5.27 ± 4.50 | −5.04 ± 3.35 | NA | 0.626§ |
| OCT-thickness change in RNFL (μm) | ||||
| Temporal superior quadrant | −42.78 ± 32.35 | −27.08 ± 28.93 | NA | 0.085§ |
| Temporal inferior quadrant | −49.78 ± 28.14 | −43.83 ± 32.08 | NA | 0.668§ |
| Baseline IOP (mmHg) | 15.38 ± 3.08 | 16.54 ± 2.26 | NA | 0.404§ |
| CCT (μm) | 530.05 ± 30.24 | 517.91 ± 13.79 | NA | 0.197§ |
| icVEP-SNR | 0.92 ± 0.53 | 0.84 ± 0.64 | NA | 0.519§ |
| Sensitivity of icVEP | 15/24 | 8/13 | NA | 0.613‡ |
*Independent-sample t-test, †Chi-square test, ‡Fisher’s exact test, §Mann–Whitney U-test. 1 mmHg = 0.133 kPa. BCVA: Best-corrected visual acuity; CCT: Central corneal thickness; icVEP: Isolated-check visual evoked potential; IOP: Intraocular pressure; logMAR: Logarithm of the minimum angle of resolution; MD: Mean deviation; OCT: Optical coherence tomography; NTG: Normal-tension glaucoma; POAG: Primary open-angle glaucoma; RNFL: Retinal nerve fiber layer; SAP: Standard automated perimetry (HFA 30-2 SITA); SNR: Signal-to-noise ratio; HFA: Humphrey Field Analyzer; NA: Not available.
DISCUSSION
The findings of the present study indicated that the sensitivity and specificity of the icVEP were 62.2% and 92.3%, respectively, for detecting abnormities in early OAG eyes based on an SNR criterion of 1. Approximately 3/5 early-stage OAG eyes were detected by the icVEP, and the SNR of the patients differed greatly from that of normal participants. Greenstein et al. reported that under conditions of high temporal frequency (15 Hz) luminance contrast of icVEP (16% positive contrast), 15 OAG patients and 14 normal observers had a sensitivity of 73.3% and a specificity of 100%,[17] but one half of the patients had advanced OAG, including juvenile and pigmentary OAG. Therefore, for early-stage POAG and NTG, the sensitivity could not be estimated because the sample was too small. Tsai's group suggested that the sensitivity of the icVEP at 15% positive contrast and 10 Hz temporal modulation was 78% and the specificity was 100% with an accuracy of 94% based on the ROC curve. Nevertheless, their study included fewer than 11 early-stage OAG patients among 18 glaucoma patients (17 open angle, 1 angle closure) and 16 controls.[8] In our study, the OAG patients were those only in the early stage and the sample was almost twice as large, suggesting that the icVEP was useful in detecting OAG at a very early stage. Chen and Zhao reported that under conditions of high temporal frequency (10 Hz) luminance contrast of the icVEP (15% positive contrast), 49 early POAG eyes and 133 ocular hypertension eyes showed a sensitivity of 53.1% and a specificity of 84.2% when the optic disc photograph grader and the Moorfields regression analysis classifier were used as the diagnostic standard.[19] The sensitivity and specificity were slightly lower than in our study, because we used a combination of GON and glaucomatous visual loss as a diagnostic standard between early OAG patients and healthy controls, which is more accurate. Chen and Zhao also reported that the sensitivity of the icVEP in 15% positive contrast and 10 Hz temporal modulation was 80% and the specificity was 90% for diagnosing early POAG, but they defined GON as a cup-disc ratio ≥0.6 or vertical cup/disc diameter ratio asymmetry ≥0.2 and did not analyze the MD of the visual field test.[20] With different GON criterion, the sensitivity of the icVEP was 62.5% and the specificity was 92.3% for diagnosing early POAG in the current study, which might be due to the smaller MD of the visual field test.
Furthermore, Liang's group suggested that the icVEP has good diagnostic accuracy (high sensitivity and moderate specificity) for distinguishing early POAG patients from healthy participants,[21] which is slightly higher sensitivity and lower specificity compared with the current study. The reason was they used Contrast Program (spatial pattern was a 10 × 10 array-subtended 10° visual field, test distance of 70 cm) with different conditions by the icVEP in an attempt to find the best parameters (16% positive contrast in their study) to diagnose POAG, which was totally different from the current study in which we selected the classic Screening Program (spatial pattern was a 24 × 24 array-subtended 11° visual field, test distance of 114 cm) of the icVEP (15% positive contrast). In the present study, age, sex, BCVA, spherical equivalent, and pupil size were similar between early OAG and healthy participants, whereas in Liang's study, the BCVA of early POAG patients was significantly worse than both healthy participants and our patients, and the spectacle correction was not mentioned for the icVEP test, which might increase the risk of false-positive error. We also noticed that according to the ROC curve, an SNR criterion of 0.93 was optimal for discriminating early-stage OAG patients from controls in the current study. An SNR >1 indicated a significant response at the 0.05 level, which implies normal electrophysiologic activity of the optic nerve. An SNR criterion of 0.93 might fit the severity of GON in the early-stage OAG patients in the current study.
In early glaucomatous neuropathy of OAG eyes, damage of RNFL and rim of the optic disk mostly occurs in the temporal inferior and temporal superior quadrants.[27,28,29] The present study showed that the SNR was significantly correlated with thinning of the RNFL in the temporal superior quadrant but not in temporal inferior quadrant. The reason for this is unclear and might be related to the small sample size of this study. In any case, the findings suggested that the icVEP-SNR correlated with the severity of the GON.
Moreover, early glaucoma characteristic damage of the arch fibers of the retinal nerve usually results in paracentral scotoma or nasal step in the upper and the lower Bjerrum areas (5°–25°) or nasal peripheral areas. Usually, the visual field of the macula (central 5°) is not involved because the paracentral scotoma does not extend to the center or the whole Bjerrum area is not damaged until the disease progresses to the middle or late stage. Recent SD-OCT studies, however, suggest that the retinal ganglion cells in the macular region are damaged even in early-stage glaucoma.[30,31,32] The central 16-test point analysis in the current study on the pattern deviation of HFA corresponded to the 5°–10° of the Bjerrum area where almost half of the magnocellular cells are distributed.[9,10,11,12] In the present study, the number of abnormal test points for each possible criterion negatively correlated with the SNR (negative r value), even though the correlation was significant at only for P < 0.5%, and the correlation tended to be significant at P < 2%. These findings suggested that the icVEP could detect functional abnormalities and reflect the severity of central visual field loss in early-stage OAG.
Previous studies suggested that POAG eyes have more severe disturbances of the magnocellular pathway than NTG eyes, and frequency-doubling technology could be therefore more sensitive for POAG than NTG.[33,34] Similarly, could the icVEP also be more sensitive for POAG than NTG? The current study failed to find significant difference on SAP, OCT, and icVEP parameters between POAG and NTG groups (P > 0.05).
A limitation of the present study is that the icVEP test requires a BCVA better than 0.3, spherical refraction within −6 to +3 diopters, and transparent ocular media, that is, the study only showed the usefulness of the icVEP for early-stage OAG eyes with better visual acuity. Therefore, further studies are needed to generate more discrete stimulations and determine better criteria for OAG eyes with poor visual acuity, to determine if the icVEP might serve as a functional test to discriminate glaucoma suspects, preperimetrical stage, and early-stage OAG, and to improve it for use in follow-up. Another limitation is that this is a cross-sectional study with a small sample at a single center, so further multiple center studies with a larger sample are also needed to confirm the accuracy of this diagnostic test, and also, the test procedure is expected to be simplified in the future.
In conclusion, the icVEP detected glaucomatous visual function abnormalities in approximately 3/5 of early-stage OAG patients with a specificity >90%, demonstrating a correlation with both the severity of the central 11° visual field loss of SAP and the decreased RNFL thickness detected by OCT.
Financial support and sponsorship
Nil.
Conflicts of interest
There are no conflicts of interest.
Footnotes
Edited by: Li-Shao Guo
REFERENCES
- 1.Quigley HA, Dunkelberger GR, Green WR. Chronic human glaucoma causing selectively greater loss of large optic nerve fibers. Ophthalmology. 1988;95:357–63. doi: 10.1016/s0161-6420(88)33176-3. doi: 10.1016/S0161-6420(88)33176-3. [DOI] [PubMed] [Google Scholar]
- 2.Quigley HA, Dunkelberger GR, Green WR. Retinal ganglion cell atrophy correlated with automated perimetry in human eyes with glaucoma. Am J Ophthalmol. 1989;107:453–64. doi: 10.1016/0002-9394(89)90488-1. doi: 10.1016/0002-9394(89)90488-1. [DOI] [PubMed] [Google Scholar]
- 3.Bjerre A, Grigg JR, Parry NR, Henson DB. Test-retest variability of multifocal visual evoked potential and SITA standard perimetry in glaucoma. Invest Ophthalmol Vis Sci. 2004;45:4035–40. doi: 10.1167/iovs.04-0099. doi: 10.1167/iovs.04-0099. [DOI] [PubMed] [Google Scholar]
- 4.Klistorner A, Graham SL. Objective perimetry in glaucoma. Ophthalmology. 2000;107:2283–99. doi: 10.1016/s0161-6420(00)00367-5. doi: 10.1016/S0161-6420(00)00367-5. [DOI] [PubMed] [Google Scholar]
- 5.Graham SL, Klistorner AI, Goldberg I. Clinical application of objective perimetry using multifocal visual evoked potentials in glaucoma practice. Arch Ophthalmol. 2005;123:729–39. doi: 10.1001/archopht.123.6.729. doi: 10.1001/archopht.123.6.729. [DOI] [PubMed] [Google Scholar]
- 6.Porciatti V, Ventura LM. Normative data for a user-friendly paradigm for pattern electroretinogram recording. Ophthalmology. 2004;111:161–8. doi: 10.1016/j.ophtha.2003.04.007. doi: 10.1016/j.ophtha.2003.04.007. [DOI] [PMC free article] [PubMed] [Google Scholar]
- 7.Ventura LM, Porciatti V, Ishida K, Feuer WJ, Parrish RK., 2nd Pattern electroretinogram abnormality and glaucoma. Ophthalmology. 2005;112:10–9. doi: 10.1016/j.ophtha.2004.07.018. doi: 10.1016/j.ophtha.2004.07.018. [DOI] [PMC free article] [PubMed] [Google Scholar]
- 8.Zemon V, Tsai JC, Forbes M, Al-Aswad LA, Chen CM, Gordon J, et al. Novel electrophysiological instrument for rapid and objective assessment of magnocellular deficits associated with glaucoma. Doc Ophthalmol. 2008;117:233–43. doi: 10.1007/s10633-008-9129-6. doi: 10.1007/s10633-008-9129-6. [DOI] [PubMed] [Google Scholar]
- 9.Gupta N, Ang LC, Noël de Tilly L, Bidaisee L, Yücel YH. Human glaucoma and neural degeneration in intracranial optic nerve, lateral geniculate nucleus, and visual cortex. Br J Ophthalmol. 2006;90:674–8. doi: 10.1136/bjo.2005.086769. doi: 10.1136/bjo.2005.086769. [DOI] [PMC free article] [PubMed] [Google Scholar]
- 10.Hartline HK. The discharge of impulses in the optic nerve of pecten in response to illumination of the eye. J Cell Comp Physiol. 1938;2:465–78. doi: 10.1002/jcp.1030110311. [Google Scholar]
- 11.Schiller PH, Sandell JH, Maunsell JH. Functions of the ON and OFF channels of the visual system. Nature. 1986;322:824–5. doi: 10.1038/322824a0. doi: 10.1038/322824a0. [DOI] [PubMed] [Google Scholar]
- 12.Kaplan E, Shapley RM. The primate retina contains two types of ganglion cells, with high and low contrast sensitivity. Proc Natl Acad Sci U S A. 1986;83:2755–7. doi: 10.1073/pnas.83.8.2755. doi: 10.1073/pnas.83.8.2755. [DOI] [PMC free article] [PubMed] [Google Scholar]
- 13.Dacey DM, Petersen MR. Dendritic field size and morphology of midget and parasol ganglion cells of the human retina. Proc Natl Acad Sci U S A. 1992;89:9666–70. doi: 10.1073/pnas.89.20.9666. doi: 10.1073/pnas.89.20.9666. [DOI] [PMC free article] [PubMed] [Google Scholar]
- 14.Fan X, Wu LL, Ma ZZ, Xiao GG, Liu F., Jr Usefulness of frequency-doubling technology for perimetrically normal eyes of open-angle glaucoma patients with unilateral field loss. Ophthalmology. 2010;117:1530, 1530–7. doi: 10.1016/j.ophtha.2009.12.034. 1537.e1-2 doi: 10.1016/j.ophtha.2009.12.034. [DOI] [PubMed] [Google Scholar]
- 15.Zemon V, Gordon J, Welch J. Asymmetries in ON and OFF visual pathways of humans revealed using contrast-evoked cortical potentials. Vis Neurosci. 1988;1:145–50. doi: 10.1017/s0952523800001085. doi: 10.1017/S0952523800001085. [DOI] [PubMed] [Google Scholar]
- 16.Zemon V, Eisner W, Gordon J, Grose-Fifer J, Tenedios F, Shoup H, et al. Contrast-dependent responses in the human visual system: Childhood through adulthood. Int J Neurosci. 1995;80:181–201. doi: 10.3109/00207459508986100. doi: 10.3109/00207459508986100. [DOI] [PubMed] [Google Scholar]
- 17.Greenstein VC, Seliger S, Zemon V, Ritch R. Visual evoked potential assessment of the effects of glaucoma on visual subsystems. Vision Res. 1998;38:1901–11. doi: 10.1016/s0042-6989(97)00348-9. doi: 10.1016/S0042-6989(97)00348-9. [DOI] [PubMed] [Google Scholar]
- 18.Zemon V, Gordon J. Luminance-contrast mechanisms in humans: Visual evoked potentials and a nonlinear model. Vision Res. 2006;46:4163–80. doi: 10.1016/j.visres.2006.07.007. doi: 10.1016/j.visres.2006.07.007. [DOI] [PubMed] [Google Scholar]
- 19.Chen XW, Zhao YX. Comparison of isolated-check visual evoked potential and standard automated perimetry in early glaucoma and high-risk ocular hypertension. Int J Ophthalmol. 2017;10:599–604. doi: 10.18240/ijo.2017.04.16. doi: 10.18240/ijo.2017.04.16. [DOI] [PMC free article] [PubMed] [Google Scholar]
- 20.Chen X, Zhao Y. Diagnostic performance of isolated-check visual evoked potential versus retinal ganglion cell-inner plexiform layer analysis in early primary open-angle glaucoma. BMC Ophthalmol. 2017;17:77. doi: 10.1186/s12886-017-0472-9. doi: 10.1186/s12886-017-0472-9. [DOI] [PMC free article] [PubMed] [Google Scholar]
- 21.Xu LJ, Zhang L, Li SL, Zemon V, Virgili G, Liang YB. Accuracy of isolated-check visual evoked potential technique for diagnosing primary open-angle glaucoma. Doc Ophthalmol. 2017;135:107–19. doi: 10.1007/s10633-017-9598-6. doi: 10.1007/s10633-017-9598-6. [DOI] [PubMed] [Google Scholar]
- 22.Kamantigue ME, Joson PJ, Chen PP. Prediction of visual field defects on standard automated perimetry by screening C-20-1 frequency doubling technology perimetry. J Glaucoma. 2006;15:35–9. doi: 10.1097/01.ijg.0000196621.41991.ff. doi: 10.1097/01.ijg.0000196621.41991.ff. [DOI] [PubMed] [Google Scholar]
- 23.Mills RP, Budenz DL, Lee PP, Noecker RJ, Walt JG, Siegartel LR, et al. Categorizing the stage of glaucoma from pre-diagnosis to end-stage disease. Am J Ophthalmol. 2006;141:27. doi: 10.1016/j.ajo.2005.07.044. doi: 10.1016/j.ajo.2005.07.044. [DOI] [PubMed] [Google Scholar]
- 24.Brandt JD, Beiser JA, Kass MA, Gordon MO. Central corneal thickness in the Ocular Hypertension Treatment Study (OHTS) Ophthalmology. 2001;108:1779–88. doi: 10.1016/s0161-6420(01)00760-6. doi: 10.1016/S0161-6420(01)00760-6. [DOI] [PubMed] [Google Scholar]
- 25.Medeiros FA, Sample PA, Weinreb RN. Frequency doubling technology perimetry abnormalities as predictors of glaucomatous visual field loss. Am J Ophthalmol. 2004;137:863–71. doi: 10.1016/j.ajo.2003.12.009. doi: 10.1016/j.ajo.2003.12.009. [DOI] [PubMed] [Google Scholar]
- 26.Zhang Y, Wu LL, Yang YF. Potential of stratus optical coherence tomography for detecting early glaucoma in perimetrically normal eyes of open-angle glaucoma patients with unilateral visual field loss. J Glaucoma. 2010;19:61–5. doi: 10.1097/IJG.0b013e31819c486b. doi: 10.1097/IJG.0b013e31819c486b. [DOI] [PubMed] [Google Scholar]
- 27.Jonas JB, Fernández MC, Stürmer J. Pattern of glaucomatous neuroretinal rim loss. Ophthalmology. 1993;100:63–8. doi: 10.1016/s0161-6420(13)31694-7. doi: 10.1016/S0161-6420(13)31694-7. [DOI] [PubMed] [Google Scholar]
- 28.Wollstein G, Garway-Heath DF, Poinoosawmy D, Hitchings RA. Glaucomatous optic disc changes in the contralateral eye of unilateral normal pressure glaucoma patients. Ophthalmology. 2000;107:2267–71. doi: 10.1016/s0161-6420(00)00352-3. doi: 10.1016/S0161-6420(00)00352-3. [DOI] [PubMed] [Google Scholar]
- 29.El Beltagi TA, Bowd C, Boden C, Amini P, Sample PA, Zangwill LM, et al. Retinal nerve fiber layer thickness measured with optical coherence tomography is related to visual function in glaucomatous eyes. Ophthalmology. 2003;110:2185–91. doi: 10.1016/S0161-6420(03)00860-1. doi: 10.1016/S0161-6420(03)00860-1. [DOI] [PubMed] [Google Scholar]
- 30.Hood DC, Raza AS, de Moraes CG, Odel JG, Greenstein VC, Liebmann JM, et al. Initial arcuate defects within the central 10 degrees in glaucoma. Invest Ophthalmol Vis Sci. 2011;52:940–6. doi: 10.1167/iovs.10-5803. doi: 10.1167/iovs.10-5803. [DOI] [PMC free article] [PubMed] [Google Scholar]
- 31.Hood DC, Raza AS, de Moraes CG, Johnson CA, Liebmann JM, Ritch R. The nature of macular damage in glaucoma as revealed by averaging optical coherence tomography data. Transl Vis Sci Technol. 2012;1:3. doi: 10.1167/tvst.1.1.3. doi: 10.1167/tvst.1.1. [DOI] [PMC free article] [PubMed] [Google Scholar]
- 32.Hood DC, Slobodnick A, Raza AS, de Moraes CG, Teng CC, Ritch R. Early glaucoma involves both deep local, and shallow widespread, retinal nerve fiber damage of the macular region. Invest Ophthalmol Vis Sci. 2014;55:632–49. doi: 10.1167/iovs.13-13130. doi: 10.1167/iovs.13-13130. [DOI] [PMC free article] [PubMed] [Google Scholar]
- 33.Kogure S, Toda Y, Crabb D, Kashiwagi K, Fitzke FW, Tsukahara S, et al. Agreement between frequency doubling perimetry and static perimetry in eyes with high tension glaucoma and normal tension glaucoma. Br J Ophthalmol. 2003;87:604–8. doi: 10.1136/bjo.87.5.604. doi: 10.1136/bjo.87.5.604. [DOI] [PMC free article] [PubMed] [Google Scholar]
- 34.Murata H, Tomidokoro A, Matsuo H, Tomita G, Araie M. Frequency doubling technology perimetry in open-angle glaucoma eyes with hemifield visual field damage: Comparison of high-tension and normal-tension groups. J Glaucoma. 2007;16:9–13. doi: 10.1097/01.ijg.0000243478.90403.84. doi: 10.1097/01.ijg.0000243478.90403.84. [DOI] [PubMed] [Google Scholar]