

Abstract
In this work, we introduce an asymmetric membrane as a simple and robust nanofluidic platform for digital detection of single pathogenic bacteria directly in 10 mL of unprocessed environmental water samples. The asymmetric membrane, consisting of uniform micropores on one side and a high density of vertically aligned nanochannels on the other side, was prepared within 1 min by a facile method. The single membrane covers all the processing steps from sample concentration, purification, and partition to final digital loop-mediated isothermal amplification (LAMP). By simple filtration, bacteria were enriched and partitioned inside the micropores, while inhibitors typically found in the environmental samples (i.e., proteins, heavy metals, and organics) were washed away through the nanochannels. Meanwhile, large particles, indigenous plankton, and positively charged pollutants in the samples were excluded by using a sacrificial membrane stacked on top. After initial filtration, modified LAMP reagents, including NaF and lysozyme, were loaded onto the membrane. Each pore in the asymmetric membrane functioned as an individual nanoreactor for selective, rapid, and efficient isothermal amplification of single bacteria, generating a bright fluorescence for direct counting. Even though high levels of inhibitors were present, absolute quantification of Escherichia coli and Salmonella directly in an unprocessed environmental sample (seawater and pond water) was achieved within 1 h, with sensitivity down to single cell and a dynamic range of 0.3–10000 cells/mL. The simple and low-cost analysis platform described herein has an enormous potential for the detection of pathogens, exosomes, stem cells, and viruses as well as single-cell heterogeneity analysis in environmental, food, and clinical research.
Keywords: asymmetric membrane, nanofluidics, pathogen detection, digital LAMP, single-molecule counting
Intestinal parasitic infections and diarrheal diseases, which are caused by waterborne pathogens, have become a leading cause of morbidity and mortality, owing to insufficient hygiene and poor sanitation.1,2 More than 2.2 million people die each year because of waterborne pathogen infections, with a resulting economic loss of nearly 12 billion U.S. dollars annually worldwide.3 Given the low infectious dose of many waterborne pathogens, the presence of even a single bacterium in the environment may pose a serious health risk.4 According to the U.S. Environmental Protection Agency (EPA), the concentration of Escherichia coli (E. coli) and Enterococci in environmental recreational samples should be less than 1.26 and 0.35 CFU/mL, respectively.5 These strict standards require a detection method that is not only ultrasensitive but also quantitative and precise.
Culture-based methods remain the “gold standard” for bacteria identification and titration, although they require days to obtain the results and hardly differentiate bacteria at the species levels.6 Quantitative real-time polymerase chain reactions (PCR) can shorten the time to several hours, but it requires expensive instrumentation and is poorly suited for absolute quantification.7 Droplet-based microfluidics have emerged as promising methods for digital cell quantification, as well as single-cell heterogeneity analysis.8,9 In this case, each cell is encapsulated into an individual droplet, and the specific cell information (e.g., specific DNA,10−18 RNA,19−23 proteins,24−26 enzymes,27 metabolism,28,29 and antibodies30,31) will be converted to a fluorescence signal and thus enable direct counting.32 This “digital format” allows simple, rapid, and multiplexed detection of specific cell strains in the samples from commensal ones.33 However, the concentration of pathogenic bacteria in environmental samples is typically beyond the detection limit of most microfluidic devices due to their limitation to microliter samples. To detect bacteria less than 1 cell per mL, at least several milliliters of samples have to be analyzed, no matter how sensitive the detection method is. For most chips, it would take several hours or days for bulk sample loading (even more for nanofluidics), which is not only a waste of time and precious bioreagents but also inactivate biochemical reaction.34,35 In addition, multiple sample pretreatment steps are still required for crude samples to remove inhibitors, exclude particles, enrich bacteria, or extract DNA before ultimate analysis. Furthermore, accessing microfluidics, especially nanofluidics, typically calls for elaborate chip fabrication and sophisticated fluid control (e.g., pump, vacuum, centrifuge, or valve), limiting their accessibility to users without related expertise and instruments.36
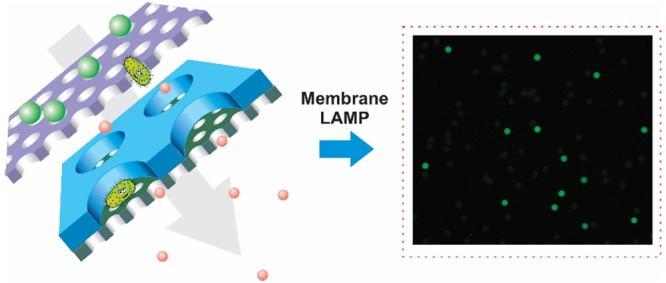
In this work, instead of using conventional micro/nanofluidic chips, we report on the use of a membrane for the digital detection of single bacteria in 10 mL of unprocessed environmental water samples within 1 h. The complete heterogeneous membrane system is composed of a sacrificial prefilter and an asymmetric micro/nanochannel membrane, as illustrated in Figure 1. The asymmetric membrane, containing highly ordered micropores (25 μm) on the top and a high density of vertically aligned nanochannels (400 nm) on the bottom, was prepared within 1 min by glass-transition-induced bonding. The strong sealing and vertical orientation of nanochannels ensure the perfect isolation of each pore without cross-contamination. During the filtration, large particles and positively charged pollutants are removed by the sacrificial prefilter on the top, while bacterial cells can pass through and then concentrate inside the micropores. Meanwhile, small inhibitors typically found in environmental samples, such as proteins, humic acids, organics, and heavy metals, passed through the nanochannels and washed away. After initial filtration, modified loop-mediated isothermal amplification (LAMP) or reverse transcription-LAMP (RT-LAMP) reagents, including NaF and lysozyme, are loaded into the asymmetric membrane for direct, rapid, and efficient amplification of a single bacterium within the isolated pores. By direct counting of positive pores, absolute quantification of E. coli and Salmonella in unprocessed seawater and pond water samples was achieved within 1 h, with a dynamic range from 0.3 to 10000 cells/mL. In contrast, direct bacteria detection in these environmental samples by conventional methods completely failed. Furthermore, the membranes are inexpensive (less than 0.1 U.S. dollar) and easily prepared on a large scale. Therefore, they can be thrown away (disposable) after each use, avoiding subsequent LAMP contamination.
Figure 1.

Schematic illustration of heterogeneous membrane for digital bacteria detection from complex environmental samples.
Results and Discussion
Asymmetric Membrane Preparation
The asymmetric membrane with large micropores on one side and high-density nanochannel arrays on the other side is the key component of the complete heterogeneous membrane system. To function as a nanofluidic system for digital bacteria counting, the asymmetric membrane should share the following features: (i) All the uniform micro/nanochannels should be vertically aligned without interconnection. (ii) The micropores on one side of membrane should be large enough (>20 μm) for visual counting, and the nanochannels on other side should be smaller than 400 nm for bacteria capture. (iii) A strong bonding is necessary between the microchannels and nanochannels. (iv) To enable rapid manual filtration, a high density of nanochannels was required to lower the applied pressure and increase the flow rate. (v) The membrane should possess excellent mechanical/chemical/thermal stability.
Track-etching technique has become the main route for preparing symmetric membranes containing numerous vertically aligned nanochannels.37 To obtain asymmetric membranes, many strategies have been employed, such as asymmetric etching,38,39 asymmetric modification,40,41 or asymmetric combination.42,43 However, most preparation processes are complicated and not suitable for conventional laboratories. Herein, we report a simple and robust method for the preparation of asymmetric membranes utilizing conventional symmetric track-etched membranes. Two symmetric track-etched polycarbonate (PC) membranes (commercially available) are stacked together and then heated at 165 °C on a hot plate for 1 min (see schematic illustration in Figure S1 and details in the Experimental Section). After the short heating duration, the two membranes are irreversibly bonded together. Figure 2a shows a photograph of an asymmetric membrane with perfect sealing. We attribute the bonding mechanism to the glass transition properties of the thermoplastic material. The polycarbonate has a glass transition temperature of ∼150 °C.44 Above this temperature, the membranes undergo a transition from a glassy state to a rubbery state, where they become soft while the micro/nanostructure remains unchanged. The long-range motion of the polymer chains in the rubbery state facilitates the tight adhesion of two membranes. Figure 2b shows a top-view scanning electron microscopy (SEM) image of the asymmetric membrane, confirming the presence of uniform micropores on its top surface. The pore size was measured to be 25 μm, and the pore density was about 104 pores/cm2. The pore size was uniform, as confirmed by the size distribution results (see Figure S2). Magnification of the images reveals the high density of nanochannels, with diameters of 400 nm, within each micropore (Figure 2c). Compared to the original membranes, the morphology of micropores and nanochannels has not changed after the heat treatment (see detailed characterization in Figure S3). The cross-sectional view SEM image of the asymmetric membrane also demonstrates the presence of micropores on the top and vertically aligned nanochannels at the bottom, as shown in Figure 2d. The two membranes were indeed bonded tightly without any gap. It should be noted that, in these experiments, a strong bonding is crucial for the asymmetric membrane to prevent it from splitting during filtration with applied pressure. The successful sealing and parallel perpendicular nanochannels ensure the isolation of each pore and prevent cross-contamination. In addition to the mentioned size and materials, the asymmetric membranes combined with other pore size (range from 200 nm to 30 μm) and other materials (polyester) could also be successfully prepared, as shown in Figure 2e–h and Figure S4.
Figure 2.

(a) Photograph of the asymmetric membrane. (b) SEM top-view image of the asymmetric membrane. (c) High-magnification top-view SEM image of one micropore. The inset shows the magnified image with a scale bar of 1 μm. (d) Cross-sectional SEM image of the asymmetric membrane. The inset shows the magnified image of the vertically aligned nanochannels. (e–h) Top-view SEM images of asymmetric membranes with other pore size combinations, 10 μm/200 nm (e), 25 μm/1 μm (f), 25 μm/2 μm (g), and 25 μm/8 μm (h). The scale bars are 5 μm. (i) Fluorescence microscope image of an asymmetric membrane after sample loading.
The wettability of membranes before and after thermal treatments was also tested, as shown in Table S1. The contact angle of LAMP solution on PC membranes increased slightly after thermal bonding, from 40 ± 3 to 50 ± 2° for membranes with 25 μm pore size and from 47 ± 3 to 54 ± 4° for membranes with 400 nm pore size. The low contact angles indicate that solutions can easily enter the micropores and nanochannels. Reagents could be loaded into each pore of the prepared asymmetric membrane, as illustrated in Figure S5 (see also the Experimental Section for details). Twenty-five microliters of sample was added onto the asymmetric membrane. Due to the capillary forces, the pores were easily wetted. The wetted membrane was then sealed between two polydimethylsiloxane (PDMS) films to remove residual reagents from the membrane surface. In order to prevent water evaporation, the top piece of PDMS was peeled off, followed by addition of mineral oil to cover the whole membrane. As shown in the fluorescence image (Figure 2i), each pore was filled with 13 pL of sample solution. A wide-view image is also shown in Figure S6, illustrating the successful loading and partitioning of the sample. To verify that no cross-contamination exists between pores, photobleaching tests were conducted.12 Membranes loaded with fluorescent solution were exposed to UV light for 3 min, resulting in a patterned area with relatively weak fluorescence (see Figure S7). If cross-contamination occurred, dye molecules would diffuse between pores and the bleached pattern would vanish with time. However, in our case, the pattern did not change after the illumination and an extended period of observation. We repeated these experiments several times, using different membranes at different positions, and similar results were obtained. The perfect isolation of pores can also be proven by the following LAMP experiments on asymmetric membranes, as discussed later, at low bacteria concentration (see Figure S8).
Filtration
The asymmetric membrane was applied for the filtration of an E. coli sample using a syringe pushed by hand. Due to the high density of microchannels and nanochannels, water passed through the membrane rapidly, and a 1 mL sample was filtered within 5 s. The air in the syringe behind the solution could push all the sample out of the filter without a dead volume. Meanwhile, the numerous parallel nanochannels in the membrane also alleviated clogging, as the occlusion of any single nanopore resulted in the diversion of the flow to nearby pores.45 After filtration, E. coli were randomly captured inside each micropore, whereas proteins, organics, nucleic acid, ions, and other small molecules passed through the nanochannels and were washed away.46,47Figure 3a shows stained E. coli (green dots) within the circular micropores. All the bacteria were captured and distributed randomly inside the micropores. No bacteria were found outside the pores, even if a relatively high concentration was used (Figure S9). At this concentration, an average of 2.2 E. coli were trapped in a single pore, and the statistic number of E. coli in each pore was also fit well with Poisson distribution (see Figure 3b). To test the capture efficiency, we measured the concentration of E. coli in the original sample, as well as in the filtrate, by standard bacteria culture and fluorescence enumeration (see Experimental Section). Results show that nearly 99.9% of E. coli were captured on the membrane (Figure S10). This excellent capture efficiency resulted from the outstanding size exclusion and electrostatic repulsion of the nanochannels, even under high flow rates.
Figure 3.

Bacteria capture, purification, and partition by sample filtration. (a) E. coli capture images. Green dots represent the stained E. coli, and the circles are the micropores. (b) Comparison between theoretical Poisson distribution and experimental E. coli distribution results in each pore. (c) E. coli permeation rate versus pore size. The blue points refer to PC membranes, and the green and brown points refer to PES and Nylon membranes, respectively. (d) Numerical simulation of fluidic flow profile inside the filter through the asymmetric membrane. (e) Simulated flow rate at each x position of the asymmetric membrane. Each peak represents the flow rate through one micropore. (f) Simulated statistical number of particles at each x position of the asymmetric membrane.
In addition to bacterial enrichment, the membrane also provides an easy way for sample purification. During filtration, small inhibitors or interference molecules in the samples could be washed away through the nanochannels. However, for complex environmental samples, the presence of various large particles and organisms would easily block the asymmetric membrane or inhibit the following enzyme-driven nucleic acid amplification processes. To solve this challenge, a sacrificial track-etched PC membrane with uniform microchannels and negatively charged channel surface was introduced and stacked above the asymmetric membrane for sample prefiltration. The function of this sacrificial layer was to exclude all large particles and adsorb positively charged matters but not to obstruct the passage of target bacteria. Therefore, we tested the E. coli permeation rate through the prefilter. As shown in Figure 3c (blue circles), the track-etched PC membranes exhibit a nearly 100% permeation rate for E. coli, even when their pore size was only 2 μm, which was only slightly larger than the size of E. coli (∼1 μm). Upon further decrease of the pore size to 1 μm, the permeation of E. coli was significantly decreased to 5%, exhibiting a perfect cutoff curve for bacterial sieving. This sharp cutoff property was indeed a characteristic behavior of isoporous membranes (membranes with highly ordered channels),48 as track-etched PC membranes have ideal cylinder channel arrays and well-defined pore sizes. In contrast, conventional nylon membranes and PES membranes, which have irregular and intercrossed pore structures, show a poor cutoff performance. Bacteria were easily trapped within the pore networks of the nylon and PES membranes even when 5 μm pore size membranes were used (see Figure 3c). The sharp cutoff provided by PC membranes also offers the opportunity to collect bacteria/viruses/exosomes at different layers if membranes with different channel sizes were to be connected in sequence.49
For digital single-cell detection and analysis, the cells should be dispersed homogeneously on the entire asymmetric membrane. To verify this, we conducted finite element analysis, using COMSOL to compute the flow field, as well as particle trajectories when a solution passes through the asymmetric membrane. Figure 3d shows the flow profile inside the filter. The fluidic flow was dispersed before being passed through the asymmetric membrane. To quantitatively investigate the transmembrane flow, the flow rates across the membrane were recorded at each position. As shown in Figure 3e, a pulse-shaped curve was found, which can be attributed to the water flow through the porous membrane. Each peak represents the flow rate through one micropore. It can be seen that the fluidic flow rate through all the pores was found to be equal. However, other than water or small molecules, the cells in the fluid are subject to additional drag force and inertial force, resulting in different cell motion profiles. Therefore, particle trajectories were also simulated. The size of particles was set to 1 μm, and density was 1100 kg/m3, similar to the parameters of E. coli.50 After particles were introduced at the inlet, they dispersed well under the flow profile and were captured inside the micropores (see Movie S1). The particle counts along the membrane are almost constant, indicating uniform distribution (Figure 3f). All of the results above demonstrate that the micro/nanochannel membrane can be applied for bacterial capture, concentration, purification, and homogeneous partition via one-step simple filtration. In typical droplet-based assays, cell encapsulation requires several hours, especially for large sample volumes, causing cell sedimentation, protein inactivation, or cell damage.34 The membrane filtration here was completed within 5 s, which significantly reduces the waiting time and circumvents these problems.
Digital Single Bacteria LAMP
After initial one-step filtration, the prefilter was thrown away, and a LAMP reagent mix (25 μL) was loaded inside each pore of the asymmetric membrane as discussed above for in situE. coli LAMP (see Experimental Section). During 65 °C incubation, each pore of the asymmetric membrane functioned as an individual nanoreactor for template amplification, generating a bright fluorescence if a target bacterium was inside. We chose LAMP because it is fast and robust, without the need for thermal cycling.51,52 However, as opposed to PCR, which applies a preheating (95 °C) step to denature proteins or lyse cells, the Bst polymerase used in the LAMP cannot withstand high temperature. Therefore, single E. coli LAMP in an ultrasmall nanoreactor was easily inhibited (Figure S11). Herein, we report a modified assay for one-step single bacteria LAMP within each pore.
To investigate in detail, we performed real-time LAMP experiments in a tube, followed by polyacrylamide gel electrophoresis. In order to mimic the concentration of bacteria inside the pores, samples with high concentrations of 108 cells/mL were used. As seen in Figure 4a, the reaction for E. coli shows a very weak fluorescence, similar to that of the negative control background. However, the gel electrophoresis results indicate the target E. coli DNA was indeed successfully amplified (Figure S12). A similar phenomenon was also observed when attempting to detect Salmonella (Figure 4a). Thus, false-negative results were likely caused by inhibitors in the bacterial lysate, which attenuates the fluorescence signal. In our current LAMP assay, a calcein-Mn2+ indicator was employed for fluorescence reading because of its high signal-to-background ratio. Before amplification, the calcein dye was quenched by the Mn2+ and a weak fluorescence was observed. After successful amplification, a large amount of DNA was synthesized, yielding a substantial pyrophosphate as a byproduct. The pyrophosphate ions cause the precipitation of Mn2+ and the subsequent release of calcein, thus generating a bright fluorescence. We suppose that the false-negative results were attributed to the pyrophosphatase found in bacteria. The pyrophosphatase is a ubiquitous enzyme existing in most organisms for energy metabolism.53 It is capable of hydrolyzing pyrophosphate ions to phosphate ions, and thus Mn2+ will no longer be precipitated.54 Therefore, the fluorescence of calcein was always quenched. This assumption was confirmed by the observation that no turbidity was observed for bacteria LAMP, although its DNA was successfully amplified. The activity of pyrophosphatase can be inhibited by fluoride ions.55 As shown in Figure 4a, fluorescence was restored for E. coli and Salmonella samples after including 2 mM NaF into the LAMP reaction, which is nearly 10-fold higher compared to the nontemplate negative control.
Figure 4.

Single bacteria LAMP. (a) Fluorescence intensity after LAMP reaction in tube with different targets. Positive control used purified E. coli DNA, and negative control had no template. (b) Real-time fluorescence measurements of the LAMP reaction in a tube with E. coli or extracted DNA (by bead beating). Lysozyme was included in this reaction with a concentration of 0.1 mg/mL. (c) End-point fluorescence image of membrane after LAMP using modified reagents.
Robust single bacteria LAMP also requires efficient cell lysis. Lysozyme is known for its ability to degrade the peptidoglycans of the bacteria cell wall.56 However, the presence of lysozyme in the reaction inhibits the PCR process and should be removed before amplification.57 By including lysozyme into the LAMP reaction, the bacterial lysis proceed simultaneously during the isothermal amplification. Effective lysis was proved by the real-time fluorescence results, which shows a coincident amplification curve and the same time-to-detection value for E. coli and its extracted DNA when lysozyme was included (Figure 4b). Meanwhile, the fluorescence enumeration results also demonstrate that almost all of the E. coli disappeared after incubation with lysozyme in the tube at 65 °C (see Figure S13). However, for the sample containing lower bacterial concentration, lysozyme may not work well and lysis efficiency decreased (Figure S14). This issue can be addressed by the membrane system, as each single bacterium encapsulated inside a small pore has an ultrahigh concentration, regardless of the bulk bacteria concentration.
The modified LAMP mix including 2 mM NaF and 0.1 mg/mL lysozyme was loaded onto the asymmetric membrane for digital E. coli LAMP. As shown in Figure 4c, LAMP was successfully performed on the membrane. The pores with target bacteria inside generated a bright fluorescence, whereas those without target bacteria showed a weak background signal. The concentration of target bacteria in the sample can be obtained by direct counting of the positive pores and calibrated by Poisson distribution. The success rate for single E. coli LAMP was as high as 97% (Figure S15). Nucleic acid amplification in an ultrasmall chamber, especially with nanoporous structures, is particularly challenging due to severe adsorption of macromolecules or DNA.12 However, digital nucleic acid amplification was still successfully performed in our nanofluidic partitioned system with a high density of nanochannels. As the bacteria were captured inside the pores first and LAMP reagents were loaded subsequently, the lysis process is restricted to each isolated pore, avoiding prerelease of cell information. All these results demonstrate the successful one-step single bacteria LAMP within each pore using a modified LAMP mixture.
Anti-inhibition and Performance in Unprocessed Samples
Raw environmental samples typically contain a variety of complex chemical and biological components that will affect the LAMP process. Direct detection of trace amounts of bacteria in these unprocessed samples is difficult and challenging. Herein, we attempted to detect and quantify an extremely low concentration of spiked E. coli in a 10 mL environmental sample directly, using the asymmetric membrane LAMP system (mLAMP). Seawater samples were collected from the Pacific Ocean near Santa Monica, CA. When the sample was analyzed by mLAMP, the large particles, sand, and planktons in the sample were retained by the prefilter on top of the asymmetric membrane (Figure S16), whereas the small inhibitory molecules were washed away through the underlying nanochannels. Meanwhile, the trace amounts of E. coli were concentrated in the micropores. Successful quantification of the spiked E. coli in seawater was achieved by mLAMP with a high recovery rate of 95%, as shown in Figure 5a (mLAMP column). The high recovery rate is attributed to full integration of the entire procedure on a membrane system, which minimizes potential sample loss. Meanwhile, no inhibition from the complex seawater matrix was observed, as there were no significant differences for E. coli quantification in seawater or in distilled water (p > 0.05). For comparison, conventional digital LAMP was also performed for E. coli quantification in seawater. In this case, 22.5 μL of LAMP reagent was mixed with 2.5 μL of the seawater sample first and then loaded inside the pores of the membrane for digital amplification. As seen in Figure 5a (digital LAMP column), the LAMP reaction was completely inhibited, and not a single positive pore was observed. This effect may be due to the presence of high levels of inhibitors (heavy metals or organic matters) in seawater. It should be noted that, in this case, the concentration of inhibitors was already diluted 10 times by the LAMP reagents. The inhibition effect is still significant when a further diluted seawater sample (10 times dilution, abbreviated as 0.1×) was used. Only 50% of pores show successful single bacteria LAMP, and the observed final fluorescence was lower than normal. A severe inhibition pattern was also observed for real-time LAMP performed in a tube. Due to the poor sensitivity of real-time LAMP, a high concentration of E. coli (5 × 10⁴ cells/mL) was spiked in the sample. However, the LAMP reaction was still totally inhibited when raw seawater was used (Figure 5a, real-time LAMP column). When a 10-fold diluted seawater sample was used, the fluorescence appeared but with a significant time delay. This delayed amplification resulted in an increased time-to-detection value and, therefore, underestimated the target concentration in the sample. All of these results demonstrate the excellent performance of our mLAMP in terms of anti-inhibition for direct digital bacteria detection in complex samples.
Figure 5.

mLAMP performance in unprocessed environmental seawater samples. (a) Recovery of E. coli for different quantification methods in DI water, seawater, or 10× diluted seawater. Recovery was defined as the percentage of E. coli detected in comparison to the originally spiked concentration. The concentration of spiked E. coli in the sample was 50 cells/mL for mLAMP and digital LAMP, whereas that for real-time LAMP was 5 × 10⁴ cells/mL. (b) Comparison of measured E. coli concentrations to the spiked concentrations. The black points were measured using 10 mL of seawater, and the blue point was obtained using only 1 mL of seawater. (c–g) End-point fluorescence images of membranes after mLAMP analysis of seawater with a series of spiked E. coli concentrations. All the scale bars are 0.5 mm.
mLAMP exhibits excellent performance toward absolute quantification of E. coli at extremely low concentrations, ranging from 0.3 to 10000 cells/mL, in seawater, with single-cell sensitivity. As shown in Figure 5b–g, with more E. coli in the sample, the membrane shows more positive pores. A good linear correlation was observed between the detected absolute number of E. coli and the actual number of cells spiked into the sample. Because there is a large error for preparing a single cell in the sample, the lower detection limit (LDL) is defined as the concentration which would have a 95% chance of having at least one bacterium in the sample and equals the concentration of three bacteria per sample.58 The LDL in our case was 0.3 cells/mL. At this concentration, there were around three positive pores visible on the whole membrane, corresponding to 3 bacteria in the 10 mL sample (see Figure S17).
In addition, the detection of pathogenic Salmonella in turtle pond water was also demonstrated by membrane-based RT-LAMP (mRT-LAMP). Reptiles, like turtles, may carry Salmonella bacteria, which cause diarrhea, stomach pain, nausea, vomiting, fever, and headaches.59 Indeed, the multistate outbreak of Salmonella in the United State during 2015 and 2017 was linked to contact with turtles carrying Salmonella.60 We collected the sample from the California Institute of Technology (Caltech) turtle pond. The turtle pond water was more turbid with suspended green algae and mud. These particles were successfully removed by the prefilter and nanochannels (see Figure S16). Primers specific to the gene marker STY1607 were used to detect the corresponding mRNA as well as DNA.61 Due to the variations of mRNA copies from cell to cell, it is hard to quantify target cells by detecting the number of mRNAs. However, mRT-LAMP circumvents these difficulties as each Salmonella bacterium was encapsulated inside a single pore, and thus, the contained nucleic acids, no matter how many, were amplified, resulting in a bright fluorescence. Absolute quantification of spiked Salmonella in pond water was realized for 3–10000 cells/mL, as shown in Figure S18.
Conclusion
In this work, we present the rapid, sensitive, and precise quantification of single pathogenic bacteria in milliliters of unprocessed environmental samples on an asymmetric membrane through simple filtration and LAMP amplification. An asymmetric membrane with micropores on one side and nanochannels on the other side was prepared within 1 min without the need for specialized equipment or harsh conditions. The membrane was capable of bacteria capture, concentration, purification, partition, lysis, and digital LAMP without off-membrane sample treatments. Even in unprocessed environmental sea and pond water with a high level of inhibitors, direct quantification of E. coli and Salmonella was realized with a sensitivity down to single cell and dynamic range of 0.3–10000 cells/mL.
Compared with other digital single-cell detection methods, the membrane LAMP system, mLAMP, exhibits many advantages: (i) Ten milliliter samples can be processed on the membrane within seconds, while still keeping minimum consumption of precious bioreagents. (ii) All assay steps including bacteria capture, concentration, purification, partition, and digital LAMP were integrated onto a piece of membrane without the need for off-membrane sample treatments. This significantly reduces potential sample loss and simplified the entire procedure. (iii) With the modified assay, mLAMP could quantify bacteria at concentrations down to 0.3 cells/mL in unprocessed environmental samples within 1 h, even though a relatively high level of inhibitors was present. (iv) All experiments were performed on low-cost and disposable commercial membranes without requiring elaborate chip fabrication or material design. (v) No pump, vacuum, centrifuge, or other laboratory hardware is required for field analysis.
We believe this simple membrane system offers many promising opportunities for laboratories, even without microfabrication facilities, to perform digital quantification, single-cell analysis, and other biochemical assays with high throughput. In the future, membranes could be directly sealed by an adhesive film and imaged by a smartphone to increase the system simplicity for point-of-care diagnostics.62,63 In addition, advanced micro/nanochannel membranes with novel functions could also be integrated into the digital membrane system, like nanopore-based DNA sequencing, DNA translocation, molecular exchange, cell electroporation, or cell lysis.64 Furthermore, the asymmetric membrane could be paired with paper-based analytical devices for complex sample manipulation and detection.62,65 We believe the heterogeneous membrane can serve as an ideal low-cost and simple platform for the rapid detection and analysis of any markers in biological samples, including nucleic acids, bacteria, circulating tumor cells, stem cells, exosomes, viruses, and proteins.
Experimental Section
Chemicals and Materials
All LAMP reagents were purchased from New England Biolabs (Ipswich, MA), and all primers were ordered from Integrated DNA Technologies (Coralville, IA), unless otherwise mentioned. Calcein, MnCl2, as well as acids were purchased from Sigma-Aldrich (St. Louis, MO). Lysozyme, SYBR Green, and culture media were obtained from ThermoFisher Scientific (San Jose, CA). Track-etched PC membranes, PES membranes, and Nylon membranes were purchased from Sterlitech Corporation (Kent, WA). Sylgard 184 silicon elastomer kit, consisting of a prepolymer base and a curing agent, was obtained from Dow Corning (Midland, MI).
Cell Culture
All bacterial strains were purchased from the American Type Culture Collection (ATCC, Manassas, VA). E. coli (ATCC 10798) was cultivated in Luria–Bertani broth in the shaking incubator for ∼14 h at 37 °C. Salmonella typhi (CVD 909) was cultivated in tryptic soy broth with 1 mg/L of 2,3-dihydroxybenzoate in the incubator for ∼14 h at 35 °C. The concentration of used bacteria suspensions was measured by fluorescence enumeration or standard bacteria culture. For fluorescence enumeration, a bacterial sample was first stained with 1× SYBR Green for 30 min, followed by filtration through a commercial PC membrane with a 0.2 μm pore size. The cell number was then counted under a fluorescence microscope (Leica DMi8). For bacteria culture assays, bacteria concentrations were quantified by spreading 20 μL of samples on corresponding agar plates, incubating them for 12 h at the respective temperature, and counting the colony-forming units (CFU). DNA extraction was performed using a commercial bead beating tube (GeneRite, NJ, USA) or using the PureLink DNA extraction kit (ThermoFisher Scientific) following their instructions.
Preparation of Asymmetric Membranes
To prepare the asymmetric membrane, two symmetric track-etched PC membranes with channel size sizes of 25 μm and 400 nm were stacked and then placed on the top of a thin PDMS film, as illustrated in Figure S1. After being heated at 165 °C on a hot plate for 1 min, these two membranes were irreversibly bonded together. The PDMS films were used to prevent thermal deformation of the membranes at high temperature. PDMS films were prepared by mixing their precursor and curing agent in a ratio of 10:1 and heating the mixture to 75 °C for 1.5 h.
Some commercial PC membranes were coated with polyvinylpyrrolidone (PVP). This hydrophilic coating must be removed first because it affects the LAMP reaction. PVP removal was accomplished by dipping membranes in 10% acetic acid for 60 min, followed by heating to 120 °C for 30 min.66
LAMP Assay
The 25 μL of modified LAMP mix for digital single bacteria LAMP contained 1× isothermal buffer, 6 mM total MgSO4, 1.4 mM dNTP, 640 U/mL Bst 2.0 WarmStart polymerase, 1.6 μM FIB and BIP, 0.2 μM F3 and B3, 0.8 μM LF and LB, 1.5 mg/mL BSA, 50 μM calcein, 1 mM MnCl2, 2 mM NaF, and 0.1 mg/mL lysozyme. For RT-LAMP, WarmStart RTx reverse transcriptase was also added to a final concentration of 300 U/mL. The primers for E. coli were designed to be specific to a conserved region on the malB gene,67 whereas primers for Salmonella were specific to gene marker STY1607.61 Their sequence is shown in the Supporting Information. Primer specificity has already been demonstrated and published.61,67 Thus, no selectivity tests (toward other bacteria) were conducted in this study.
Digital Single Bacteria Detection on Membranes
The asymmetric membrane with a sacrificial PC membrane (2 μm pore size) on top was put into a commercial filter holder (Swinnex, Kent, WA), and 1–10 mL of environmental sample with spiked bacteria was filtered through it using a syringe pushed manually. After filtration, the sacrificial prefilter membrane was thrown away, and 25 μL of modified LAMP mix was added on the top of asymmetric membrane. The wetted membrane was then sealed between two pieces of PDMS film. Subsequently, the top PDMS was peeled off, followed by adding mineral oil and a frame-seal (Bio-Rad, Hercules, CA) to cover the whole membrane. The membranes were incubated at 65 °C on a hot plate (MJ Research PTC-100, Watertown, MA) for 40 min. After amplification, the fluorescence images of the membrane were taken by a fluorescence microscope (Leica DMi8) using a 4× objective. Positive pores were counted using ImageJ (NIH) software and calibrated by Poisson distribution. The total number of pores can also be counted using ImageJ because the negative one also shows a weak fluorescence. However, in this study, the total number of pores was simply estimated based on porosity (1 × 10⁴ pores/cm2). Each sample was tested at least three times.
For real-time LAMP performance in the tube, the LAMP assay was premixed with 2.5 μL of seawater first and incubated at 65 °C using an Eppendorf RealPlex2. Fluorescence intensity of the reaction was monitored every minute for 60 min. For conventional digital LAMP, the LAMP assay mixture (premixed with a 2.5 μL seawater sample) was loaded into each pore of the asymmetric membrane and incubated at 65 °C for 40 min for digital LAMP analyses.
Environmental Samples
Seawater samples were collected from the Santa Monica beach in California. Cultured E. coli samples were spiked with a final concentration of 0.3 to 1 × 10⁴ cells/mL and allowed to equilibrate for 1 h before analysis. The turtle pond water was collected from the turtle pond at the California Institute of Technology (Caltech), and cultured Salmonella was spiked in with a final concentration of 3 to 1 × 10⁴ cells/mL.
Characterization
Top-view and cross-sectional view SEM images were obtained with a ZEISS 1550VP field-emission scanning electron microscope. Before analysis, samples were sputtered with 10 nm Pd. Wettability of the membrane was measured using a contact angle goniometer equipped with an AmScope microscope camera model MU300. A drop of LAMP mix was placed on the surface of the membranes. After 10 s, the image was captured and then analyzed using ImageJ.
COMSOL Simulation
Finite element modeling was carried out using the commercial software COMSOL Multiphysics (COMSOL Inc., Burlington, MA). In our simulations, the fluid flows were considered as water with a density of 1 × 10³ kg/m3 and a dynamic viscosity μ of 1 × 10⁻³ Pa·s. The fluid geometry during sample filtration was represented by a 2D model. The fluid flow passing through the asymmetric membrane was represented by two layers, each with a thickness of 25 μm and diameter of 13 mm. The diameter and center-to-center distance of the micropores in the upper layer were 25 and 225 μm, respectively. The diameter and center-to-center distance of the nanochannels in the bottom layer were 400 nm and 2 μm, respectively. The velocity of fluid at the inlet was set to 0.0318 m/s. The steady-state laminar flow profile throughout the fluid geometry was calculated first using the Navier–Stokes equation. Subsequently, a fixed amount of 1 μm particles was placed at the sample inlet for calculations of their trajectories using a particle tracing model. The density of the particles was set to 1100 kg/m3, similar to that of E. coli. The trajectories of the particles were calculated, and thus the distribution of particles along the membrane was measured.
Acknowledgments
The authors acknowledge the financial support provided by the Bill and Melinda Gates Foundation (Grant No. OPP1111252).
Supporting Information Available
The Supporting Information is available free of charge on the ACS Publications website at DOI: 10.1021/acsnano.8b05384.
COMSOL simulated movie showing the trajectories of particles under filtration flow through the asymmetric membrane (AVI)
Primer sequences, contact angle results, fabrication schemes, pore size distributions, detailed SEM characterization, additional fluorescence images, gel electrophoresis results, bacterial lysis results, and Salmonella quantification (PDF)
The authors declare no competing financial interest.
Supplementary Material
References
- Shannon M. A.; Bohn P. W.; Elimelech M.; Georgiadis J. G.; Marinas B. J.; Mayes A. M. Science and Technology for Water Purification in the Coming Decades. Nature 2008, 452, 301–310. 10.1038/nature06599. [DOI] [PubMed] [Google Scholar]
- Bridle H.; Miller B.; Desmulliez M. P. Application of Microfluidics in Waterborne Pathogen Monitoring: A Review. Water Res. 2014, 55, 256–271. 10.1016/j.watres.2014.01.061. [DOI] [PubMed] [Google Scholar]
- Ramirez-Castillo F. Y.; Loera-Muro A.; Jacques M.; Garneau P.; Avelar-Gonzalez F. J.; Harel J.; Guerrero-Barrera A. L. Waterborne Pathogens: Detection Methods and Challenges. Pathogens 2015, 4, 307–334. 10.3390/pathogens4020307. [DOI] [PMC free article] [PubMed] [Google Scholar]
- Zhao X.; Hilliard L. R.; Mechery S. J.; Wang Y.; Bagwe R. P.; Jin S.; Tan W. A Rapid Bioassay for Single Bacterial Cell Quantitation Using Bioconjugated Nanoparticles. Proc. Natl. Acad. Sci. U. S. A. 2004, 101, 15027–15032. 10.1073/pnas.0404806101. [DOI] [PMC free article] [PubMed] [Google Scholar]
- United States Environmental Protection Agency. Recreational Water Quality Criteria; https://www.epa.gov/sites/production/files/2015-10/documents/rwqc2012.pdf (accessed June 2018).
- Zhang D.; Bi H.; Liu B.; Qiao L. Detection of Pathogenic Microorganisms by Microfluidics Based Analytical Methods. Anal. Chem. 2018, 90, 5512–5520. 10.1021/acs.analchem.8b00399. [DOI] [PubMed] [Google Scholar]
- Heyries K. A.; Tropini C.; Vaninsberghe M.; Doolin C.; Petriv O. I.; Singhal A.; Leung K.; Hughesman C. B.; Hansen C. L. Megapixel Digital PCR. Nat. Methods 2011, 8, 649–651. 10.1038/nmeth.1640. [DOI] [PubMed] [Google Scholar]
- Joensson H. N.; Andersson Svahn H. Droplet Microfluidics - a Tool for Single-Cell Analysis. Angew. Chem., Int. Ed. 2012, 51, 12176–12192. 10.1002/anie.201200460. [DOI] [PubMed] [Google Scholar]
- Ven K.; Vanspauwen B.; Perez-Ruiz E.; Leirs K.; Decrop D.; Gerstmans H.; Spasic D.; Lammertyn J. Target Confinement in Small Reaction Volumes Using Microfluidic Technologies: A Smart Approach for Single-Entity Detection and Analysis. ACS Sens 2018, 3, 264–284. 10.1021/acssensors.7b00873. [DOI] [PubMed] [Google Scholar]
- Yen T. M.; Zhang T.; Chen P.-W.; Ku T.-H.; Chiu Y.-J.; Lian I.; Lo Y.-H. Self-Assembled Pico-Liter Droplet Microarray for Ultrasensitive Nucleic Acid Quantification. ACS Nano 2015, 9, 10655–10663. 10.1021/acsnano.5b03848. [DOI] [PubMed] [Google Scholar]
- Novak R.; Zeng Y.; Shuga J.; Venugopalan G.; Fletcher D. A.; Smith M. T.; Mathies R. A. Single-Cell Multiplex Gene Detection and Sequencing with Microfluidically Generated Agarose Emulsions. Angew. Chem., Int. Ed. 2011, 50, 390–395. 10.1002/anie.201006089. [DOI] [PMC free article] [PubMed] [Google Scholar]
- Men Y.; Fu Y.; Chen Z.; Sims P. A.; Greenleaf W. J.; Huang Y. Digital Polymerase Chain Reaction in an Array of Femtoliter Polydimethylsiloxane Microreactors. Anal. Chem. 2012, 84, 4262–4266. 10.1021/ac300761n. [DOI] [PubMed] [Google Scholar]
- Zhu Z.; Zhang W.; Leng X.; Zhang M.; Guan Z.; Lu J.; Yang C. J. Highly Sensitive and Quantitative Detection of Rare Pathogens through Agarose Droplet Microfluidic Emulsion PCR at the Single-Cell Level. Lab Chip 2012, 12, 3907–3913. 10.1039/c2lc40461c. [DOI] [PubMed] [Google Scholar]
- Tadmor A. D.; Ottesen E. A.; Leadbetter J. R.; Phillips R. Probing Individual Environmental Bacteria for Viruses by Using Microfluidic Digital PCR. Science 2011, 333, 58–62. 10.1126/science.1200758. [DOI] [PMC free article] [PubMed] [Google Scholar]
- Wang Y.; Southard K. M.; Zeng Y. Digital PCR Using Micropatterned Superporous Absorbent Array Chips. Analyst 2016, 141, 3821–3831. 10.1039/C6AN00164E. [DOI] [PMC free article] [PubMed] [Google Scholar]
- Yeh E. C.; Fu C. C.; Hu L.; Thakur R.; Feng J.; Lee L. P. Self-Powered Integrated Microfluidic Point-of-Care Low-Cost Enabling (Simple) Chip. Sci. Adv. 2017, 3, e1501645. 10.1126/sciadv.1501645. [DOI] [PMC free article] [PubMed] [Google Scholar]
- Rodriguez-Manzano J.; Karymov M. A.; Begolo S.; Selck D. A.; Zhukov D. V.; Jue E.; Ismagilov R. F. Reading out Single-Molecule Digital RNA and DNA Isothermal Amplification in Nanoliter Volumes with Unmodified Camera Phones. ACS Nano 2016, 10, 3102–3013. 10.1021/acsnano.5b07338. [DOI] [PMC free article] [PubMed] [Google Scholar]
- Schoepp N. G.; Schlappi T. S.; Curtis M. S.; Butkovich S. S.; Miller S.; Humphries R. M.; Ismagilov R. F. Rapid Pathogen-Specific Phenotypic Antibiotic Susceptibility Testing Using Digital LAMP Quantification in Clinical Samples. Sci. Transl. Med. 2017, 9, eaal3693. 10.1126/scitranslmed.aal3693. [DOI] [PMC free article] [PubMed] [Google Scholar]
- White A. K.; VanInsberghe M.; Petriv O. I.; Hamidi M.; Sikorski D.; Marra M. A.; Piret J.; Aparicio S.; Hansen C. L. High-Throughput Microfluidic Single-Cell RT-qPCR. Proc. Natl. Acad. Sci. U. S. A. 2011, 108, 13999–14004. 10.1073/pnas.1019446108. [DOI] [PMC free article] [PubMed] [Google Scholar]
- Kim S. C.; Clark I. C.; Shahi P.; Abate A. R. Single-Cell RT-PCR in Microfluidic Droplets with Integrated Chemical Lysis. Anal. Chem. 2018, 90, 1273–1279. 10.1021/acs.analchem.7b04050. [DOI] [PMC free article] [PubMed] [Google Scholar]
- Hu Y.; Xu P.; Luo J.; He H.; Du W. Absolute Quantification of H5-Subtype Avian Influenza Viruses Using Droplet Digital Loop-Mediated Isothermal Amplification. Anal. Chem. 2017, 89, 745–750. 10.1021/acs.analchem.6b03328. [DOI] [PubMed] [Google Scholar]
- Gong Y.; Ogunniyi A. O.; Love J. C. Massively Parallel Detection of Gene Expression in Single Cells Using Subnanolitre Wells. Lab Chip 2010, 10, 2334–2337. 10.1039/c004847j. [DOI] [PMC free article] [PubMed] [Google Scholar]
- Zhang H.; Jenkins G.; Zou Y.; Zhu Z.; Yang C. J. Massively Parallel Single-Molecule and Single-Cell Emulsion Reverse Transcription Polymerase Chain Reaction Using Agarose Droplet Microfluidics. Anal. Chem. 2012, 84, 3599–3606. 10.1021/ac2033084. [DOI] [PubMed] [Google Scholar]
- Kang D. K.; Ali M. M.; Zhang K.; Huang S. S.; Peterson E.; Digman M. A.; Gratton E.; Zhao W. Rapid Detection of Single Bacteria in Unprocessed Blood Using Integrated Comprehensive Droplet Digital Detection. Nat. Commun. 2014, 5, 5427. 10.1038/ncomms6427. [DOI] [PMC free article] [PubMed] [Google Scholar]
- Ali M. M.; Aguirre S. D.; Lazim H.; Li Y. Fluorogenic Dnazyme Probes as Bacterial Indicators. Angew. Chem., Int. Ed. 2011, 50, 3751–3754. 10.1002/anie.201100477. [DOI] [PubMed] [Google Scholar]
- Li Z. Y.; Huang M.; Wang X. K.; Zhu Y.; Li J. S.; Wong C. C. L.; Fang Q. Nanoliter-Scale Oil-Air-Droplet Chip-Based Single Cell Proteomic Analysis. Anal. Chem. 2018, 90, 5430–5438. 10.1021/acs.analchem.8b00661. [DOI] [PubMed] [Google Scholar]
- Juul S.; Nielsen C. J.; Labouriau R.; Roy A.; Tesauro C.; Jensen P. W.; Harmsen C.; Kristoffersen E. L.; Chiu Y.-L.; Frøhlich R.; et al. Droplet Microfluidics Platform for Highly Sensitive and Quantitative Detection of Malaria-Causing Plasmodium Parasites Based on Enzyme Activity Measurement. ACS Nano 2012, 6, 10676–10683. 10.1021/nn3038594. [DOI] [PMC free article] [PubMed] [Google Scholar]
- Avesar J.; Rosenfeld D.; Truman-Rosentsvit M.; Ben-Arye T.; Geffen Y.; Bercovici M.; Levenberg S. Rapid Phenotypic Antimicrobial Susceptibility Testing Using Nanoliter Arrays. Proc. Natl. Acad. Sci. U. S. A. 2017, 114, E5787–E5795. 10.1073/pnas.1703736114. [DOI] [PMC free article] [PubMed] [Google Scholar]
- Wu H.; Chen X.; Gao X.; Zhang M.; Wu J.; Wen W. High-Throughput Generation of Durable Droplet Arrays for Single-Cell Encapsulation, Culture, and Monitoring. Anal. Chem. 2018, 90, 4303–4309. 10.1021/acs.analchem.8b00048. [DOI] [PubMed] [Google Scholar]
- Love J. C.; Ronan J. L.; Grotenbreg G. M.; van der Veen A. G.; Ploegh H. L. A Microengraving Method for Rapid Selection of Single Cells Producing Antigen-Specific Antibodies. Nat. Biotechnol. 2006, 24, 703–707. 10.1038/nbt1210. [DOI] [PubMed] [Google Scholar]
- Ogunniyi A. O.; Story C. M.; Papa E.; Guillen E.; Love J. C. Screening Individual Hybridomas by Microengraving to Discover Monoclonal Antibodies. Nat. Protoc. 2009, 4, 767–782. 10.1038/nprot.2009.40. [DOI] [PMC free article] [PubMed] [Google Scholar]
- Paunescu D.; Mora C. A.; Querci L.; Heckel R.; Puddu M.; Hattendorf B.; Günther D.; Grass R. N. Detecting and Number Counting of Single Engineered Nanoparticles by Digital Particle Polymerase Chain Reaction. ACS Nano 2015, 9, 9564–9572. 10.1021/acsnano.5b04429. [DOI] [PubMed] [Google Scholar]
- Zhong Q.; Bhattacharya S.; Kotsopoulos S.; Olson J.; Taly V.; Griffiths A. D.; Link D. R.; Larson J. W. Multiplex Digital PCR: Breaking the One Target Per Color Barrier of Quantitative PCR. Lab Chip 2011, 11, 2167–2174. 10.1039/c1lc20126c. [DOI] [PubMed] [Google Scholar]
- Mazutis L.; Gilbert J.; Ung W. L.; Weitz D. A.; Griffiths A. D.; Heyman J. A. Single-Cell Analysis and Sorting Using Droplet-Based Microfluidics. Nat. Protoc. 2013, 8, 870–891. 10.1038/nprot.2013.046. [DOI] [PMC free article] [PubMed] [Google Scholar]
- Lyu F.; Xu M.; Cheng Y.; Xie J.; Rao J.; Tang S. K. Quantitative Detection of Cells Expressing Blac Using Droplet-Based Microfluidics for Use in the Diagnosis of Tuberculosis. Biomicrofluidics 2015, 9, 044120. 10.1063/1.4928879. [DOI] [PMC free article] [PubMed] [Google Scholar]
- Kaminski T. S.; Scheler O.; Garstecki P. Droplet Microfluidics for Microbiology: Techniques, Applications and Challenges. Lab Chip 2016, 16, 2168–2187. 10.1039/C6LC00367B. [DOI] [PubMed] [Google Scholar]
- Guo W.; Tian Y.; Jiang L. Asymmetric Ion Transport through Ion-Channel-Mimetic Solid-State Nanopores. Acc. Chem. Res. 2013, 46, 2834–2846. 10.1021/ar400024p. [DOI] [PubMed] [Google Scholar]
- Zhang H.; Tian Y.; Hou J.; Hou X.; Hou G.; Ou R.; Wang H.; Jiang L. Bioinspired Smart Gate-Location-Controllable Single Nanochannels: Experiment and Theoretical Simulation. ACS Nano 2015, 9, 12264–12273. 10.1021/acsnano.5b05542. [DOI] [PubMed] [Google Scholar]
- Li C. Y.; Wu Z. Q.; Yuan C. G.; Wang K.; Xia X. H. Propagation of Concentration Polarization Affecting Ions Transport in Branching Nanochannel Array. Anal. Chem. 2015, 87, 8194–8202. 10.1021/acs.analchem.5b01016. [DOI] [PubMed] [Google Scholar]
- Li C.-Y.; Ma F.-X.; Wu Z.-Q.; Gao H.-L.; Shao W.-T.; Wang K.; Xia X.-H. Solution-Ph-Modulated Rectification of Ionic Current in Highly Ordered Nanochannel Arrays Patterned with Chemical Functional Groups at Designed Positions. Adv. Funct. Mater. 2013, 23, 3836–3844. 10.1002/adfm.201300315. [DOI] [Google Scholar]
- Yang Q.; Lin X.; Wang Y.; Su B. Nanochannels as Molecular Check Valves. Nanoscale 2017, 9, 18523–18528. 10.1039/C7NR05924H. [DOI] [PubMed] [Google Scholar]
- Zhang Z.; Kong X. Y.; Xiao K.; Liu Q.; Xie G.; Li P.; Ma J.; Tian Y.; Wen L.; Jiang L. Engineered Asymmetric Heterogeneous Membrane: A Concentration-Gradient-Driven Energy Harvesting Device. J. Am. Chem. Soc. 2015, 137, 14765–14772. 10.1021/jacs.5b09918. [DOI] [PubMed] [Google Scholar]
- Zhang Z.; Wen L.; Jiang L. Bioinspired Smart Asymmetric Nanochannel Membranes. Chem. Soc. Rev. 2018, 47, 322–356. 10.1039/C7CS00688H. [DOI] [PubMed] [Google Scholar]
- Tsao C.-W.; DeVoe D. L. Bonding of Thermoplastic Polymer Microfluidics. Microfluid. Nanofluid. 2009, 6, 1–16. 10.1007/s10404-008-0361-x. [DOI] [Google Scholar]
- Ko J.; Bhagwat N.; Yee S. S.; Ortiz N.; Sahmoud A.; Black T.; Aiello N. M.; McKenzie L.; O’Hara M.; Redlinger C.; Romeo J.; Carpenter E. L.; Stanger B. Z.; Issadore D. Combining Machine Learning and Nanofluidic Technology to Diagnose Pancreatic Cancer Using Exosomes. ACS Nano 2017, 11, 11182–11193. 10.1021/acsnano.7b05503. [DOI] [PubMed] [Google Scholar]
- Chen W.; Jin B.; Hu Y. L.; Lu Y.; Xia X. H. Entrapment of Protein in Nanotubes Formed by a Nanochannel and Ion-Channel Hybrid Structure of Anodic Alumina. Small 2012, 8, 1001–1005. 10.1002/smll.201102117. [DOI] [PubMed] [Google Scholar]
- Wang C.; Li S. J.; Wu Z. Q.; Xu J. J.; Chen H. Y.; Xia X. H. Study on the Kinetics of Homogeneous Enzyme Reactions in a Micro/Nanofluidics Device. Lab Chip 2010, 10, 639–646. 10.1039/B915762J. [DOI] [PubMed] [Google Scholar]
- Lin X.; Yang Q.; Ding L.; Su B. Ultrathin Silica Membranes with Highly Ordered and Perpendicular Nanochannels for Precise and Fast Molecular Separation. ACS Nano 2015, 9, 11266–11277. 10.1021/acsnano.5b04887. [DOI] [PubMed] [Google Scholar]
- Liu F.; Vermesh O.; Mani V.; Ge T. J.; Madsen S. J.; Sabour A.; Hsu E. C.; Gowrishankar G.; Kanada M.; Jokerst J. V.; Sierra R. G.; Chang E.; Lau K.; Sridhar K.; Bermudez A.; Pitteri S. J.; Stoyanova T.; Sinclair R.; Nair V. S.; Gambhir S. S.; et al. The Exosome Total Isolation Chip. ACS Nano 2017, 11, 10712–10723. 10.1021/acsnano.7b04878. [DOI] [PMC free article] [PubMed] [Google Scholar]
- Martinez-Salas E.; Martin J.; Vicente M. Relationship of Escherichia coli Density to Growth Rate and Cell Age. J. Bacteriol. 1981, 147, 97–100. [DOI] [PMC free article] [PubMed] [Google Scholar]
- Tomita N.; Mori Y.; Kanda H.; Notomi T. Loop-Mediated Isothermal Amplification (LAMP) of Gene Sequences and Simple Visual Detection of Products. Nat. Protoc. 2008, 3, 877–882. 10.1038/nprot.2008.57. [DOI] [PubMed] [Google Scholar]
- Kong J. E.; Wei Q.; Tseng D.; Zhang J.; Pan E.; Lewinski M.; Garner O. B.; Ozcan A.; Di Carlo D. Highly Stable and Sensitive Nucleic Acid Amplification and Cell-Phone-Based Readout. ACS Nano 2017, 11, 2934–2943. 10.1021/acsnano.6b08274. [DOI] [PubMed] [Google Scholar]
- Josse J. Constitutive Inorganic Pyrophosphatase of Escherichia Coli I. Purification and Catalytic Properties. J. Biol. Chem. 1966, 241, 1938–1947. [PubMed] [Google Scholar]
- Mori Y.; Nagamine K.; Tomita N.; Notomi T. Detection of Loop-Mediated Isothermal Amplification Reaction by Turbidity Derived from Magnesium Pyrophosphate Formation. Biochem. Biophys. Res. Commun. 2001, 289, 150–154. 10.1006/bbrc.2001.5921. [DOI] [PubMed] [Google Scholar]
- Baykov A. A.; Artjukov A. A.; Avaeva S. M. Fluoride Inhibition of Inorganic Pyrophosphatase I. Kinetic Studies in a Mg2+-Ppi System Using a New Continuous Enzyme Assay. Biochim. Biophys. Acta 1976, 429, 982–992. 10.1016/0005-2744(76)90343-0. [DOI] [PubMed] [Google Scholar]
- Zhu K.; Jin H.; He Z.; Zhu Q.; Wang B. A Continuous Method for the Large-Scale Extraction of Plasmid DNA by Modified Boiling Lysis. Nat. Protoc. 2007, 1, 3088–3093. 10.1038/nprot.2006.452. [DOI] [PMC free article] [PubMed] [Google Scholar]
- Abolmaaty A.; El-Shemy M.; Khallaf M.; Levin R. Effect of Lysing Methods and Their Variables on the Yield of Escherichia Coli O157: H7 DNA and Its PCR Amplification. J. Microbiol. Methods 1998, 34, 133–141. 10.1016/S0167-7012(98)00084-0. [DOI] [Google Scholar]
- Kreutz J. E.; Munson T.; Huynh T.; Shen F.; Du W.; Ismagilov R. F. Theoretical Design and Analysis of Multivolume Digital Assays with Wide Dynamic Range Validated Experimentally with Microfluidic Digital PCR. Anal. Chem. 2011, 83, 8158–8168. 10.1021/ac201658s. [DOI] [PMC free article] [PubMed] [Google Scholar]
- Winter S. E.; Thiennimitr P.; Winter M. G.; Butler B. P.; Huseby D. L.; Crawford R. W.; Russell J. M.; Bevins C. L.; Adams L. G.; Tsolis R. M.; Roth J. R.; Baumler A. J. Gut Inflammation Provides a Respiratory Electron Acceptor for Salmonella. Nature 2010, 467, 426–429. 10.1038/nature09415. [DOI] [PMC free article] [PubMed] [Google Scholar]
- Gambino-Shirley K.; Stevenson L.; Concepción-Acevedo J.; Trees E.; Wagner D.; Whitlock L.; Roberts J.; Garrett N.; Van Duyne S.; McAllister G. Flea Market Finds and Global Exports: Four Multistate Outbreaks of Human Salmonella Infections Linked to Small Turtles, United States—2015. Zoonoses Public Health 2018, 65, 560. 10.1111/zph.12466. [DOI] [PubMed] [Google Scholar]
- Fan F.; Yan M.; Du P.; Chen C.; Kan B. Rapid and Sensitive Salmonella Typhi Detection in Blood and Fecal Samples Using Reverse Transcription Loop-Mediated Isothermal Amplification. Foodborne Pathog. Dis. 2015, 12, 778–786. 10.1089/fpd.2015.1950. [DOI] [PubMed] [Google Scholar]
- Xu G.; Nolder D.; Reboud J.; Oguike M. C.; van Schalkwyk D. A.; Sutherland C. J.; Cooper J. M. Paper-Origami-Based Multiplexed Malaria Diagnostics from Whole Blood. Angew. Chem., Int. Ed. 2016, 55, 15250–15253. 10.1002/anie.201606060. [DOI] [PMC free article] [PubMed] [Google Scholar]
- Huang X.; Lin X.; Urmann K.; Li L.; Xie X.; Jiang S.; Hoffmann M. R. A Smartphone Based in-Gel Loop Mediated Isothermal Amplification (gLAMP) System Enables Rapid Coliphage Ms2 Quantification in Environmental Waters. Environ. Sci. Technol. 2018, 52, 6399. 10.1021/acs.est.8b00241. [DOI] [PMC free article] [PubMed] [Google Scholar]
- Experton J.; Wilson A. G.; Martin C. R. Low-Voltage Flow-through Electroporation in Gold-Microtube Membranes. Anal. Chem. 2016, 88, 12445–12452. 10.1021/acs.analchem.6b03820. [DOI] [PubMed] [Google Scholar]
- Liu M.; Hui C. Y.; Zhang Q.; Gu J.; Kannan B.; Jahanshahi-Anbuhi S.; Filipe C. D.; Brennan J. D.; Li Y. Target-Induced and Equipment-Free DNA Amplification with a Simple Paper Device. Angew. Chem., Int. Ed. 2016, 55, 2709–2713. 10.1002/anie.201509389. [DOI] [PubMed] [Google Scholar]
- Cheng I. F.; Martin C. R. Ultramicrodisk Electrode Ensembles Prepared by Incorporating Carbon Paste into a Microporous Host Membrane. Anal. Chem. 1988, 60, 2163–2165. 10.1021/ac00170a038. [DOI] [Google Scholar]
- Hill J.; Beriwal S.; Chandra I.; Paul V. K.; Kapil A.; Singh T.; Wadowsky R. M.; Singh V.; Goyal A.; Jahnukainen T.; Johnson J. R.; Tarr P. I.; Vats A. Loop-Mediated Isothermal Amplification Assay for Rapid Detection of Common Strains of Escherichia Coli. J. Clin. Microbiol. 2008, 46, 2800–2804. 10.1128/JCM.00152-08. [DOI] [PMC free article] [PubMed] [Google Scholar]
Associated Data
This section collects any data citations, data availability statements, or supplementary materials included in this article.