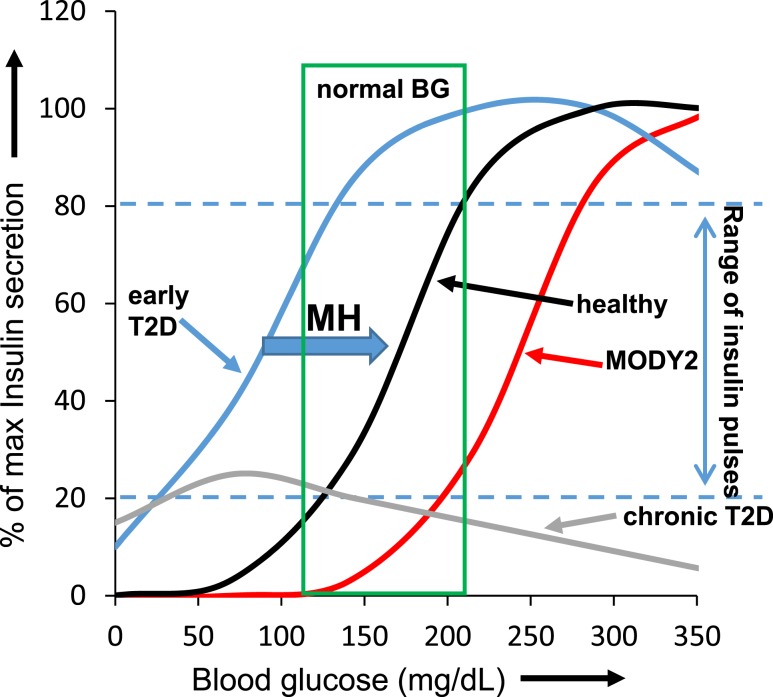
Figure 9.
Model of the range of blood glucose concentrations promoting insulin pulsatility. Normal nonfasted blood glucose range (for mice) boxed in green. Dashed blue lines indicate the range of pulsatile insulin release. Normal insulin release (black curve within the green box) is largely within the pulsatile range (between blue dashed lines). In early T2D, the curve (blue) is shifted: pulsatile insulin occurs at lower than normal glucose levels to the left of the green box, but maximum secretory capacity is still intact. However, this shift in glucose sensing results in excess insulin release with low glucose and a loss of pulsatility in normal postprandial glucose levels, which might further contribute to hepatic insulin resistance. Loss-of-function glucokinase mutations such as MODY2 in the most severe cases result in the opposite effect. Insulin pulsatility begins for MODY2 (red curve) in hyperglycemic conditions to the right of the green box. Chronic T2D (gray curve) results in substantial deterioration of insulin secretory capacity across all glucose levels. Note that the blood glucose concentrations are more closely related to the mouse; however, the curves also apply conceptually to humans.

