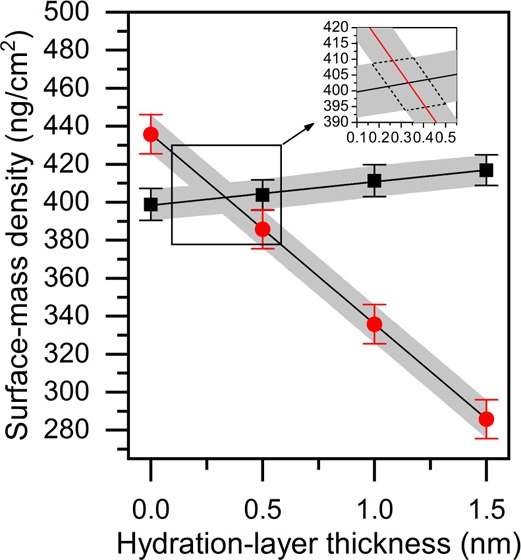
Figure 2.

Hydration-layer modeling (surface-mass density, ng/cm2, as a function of hydration-layer thickness, nm) of the SPR (black squares) and QCM-Z data (red circles) for a DOPC bilayer. Gray areas depict the standard errors of the mean for both measurement techniques. The inset shows more closely the cross-section of the two data sets. Dotted lines surrounding the cross-section in the inset were used as error boundaries for surface-mass density, hydration-layer thickness, and the other measured parameters derived from these two (presented in Table 2).
