

Abstract
Phytochemical investigation of the aerial parts of Cytisus villosus Pourr. resulted in the isolation and characterization of a new isoflavan, (3S, 4S)-2′,4′-dihydroxy-3′-methoxy-6,7-methylenedioxyisoflavan- 4-ol (1), and a new monoterpene, (4R,6S)-4-hydroxy-2,2,6-trimethyl-9-oxabicyclo [4.2.1] non-1(8)-en-7-one (2), together with four known flavonoids: geinstein (3), chrysin (4), chrysin -7-O-β-D-glucopyranoside (5) and 2″-O-α-L-rhamnosylorientin (6). The structures of the new compounds were elucidated on the basis of extensive spectroscopic analysis, including 1D, 2D NMR (1H, 13C, COSY, TOCSY, HMBC and HSQC) and HRESIMS. The absolute configurations of 1 and 2 were established by the comparison of experimental and calculated electronic circular dichroism (ECD) spectra.
Keywords: Cytisus villosus, Isoflavonoids, Monoterpenoids, ECD
Graphical abstract
1. Introduction
The Cytisus genus (Fabaceae) has been used in folk medicine as a diuretic and in the treatment of mild hypertension, heart failure and cardiac edema (Bhakuni et al., 1969; Siegel, 1976; Weiss, 1988). It has been also reported as; anti-diabetic, hypnotic, sedative, antioxidant, hepatoprotective, antispasmodic, hypotensive and estrogenic agent (Jalili et al., 2013; Nirmal et al., 2008; Pereira et al., 2012). The therapeutic properties, particularly the antioxidant activity, of the different Cytisus species are related to their high concentration of phenolic compounds (Luís et al., 2009). The major compounds isolated from this genus include the lupin alkaloids: sparteine, lupanine and isosparteine (Iwu, 2014). Other important metabolites found in aerial part of this genus are tyramine, epinine, salsolidine, genisteine, quercetin, and their glycosides, and caffeic acid (Sundararajan and Koduru, 2014). Eugenol, phenol, cresol, isovaleric acid, benzoic acid, benzylalcohol, cis-3-hexen-1-ol and 1-octen-3-ol are the predominant compounds found in the seed-essential oil of several Cytisus species (Sundararajan and Koduru, 2014). The flavone 6″-O-acetyl-scoparin, the flavonols kaempferol, rutin, quercetin, quercitrin and isorhamnetin, and the isoflavones genistein and sarothamnoside have been found in Cytisus scoparius (Sundararajan and Koduru, 2014), while Cytisus nigrians and Cytisus albus contain the isoflavones ononin and genistein (Hanganu et al., 2010a; Hanganu et al., 2010b).
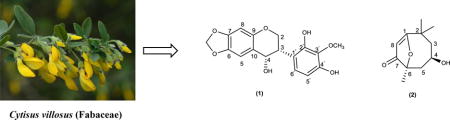
Cytisus villosus Pourr. is a Shrub of 1–2 m high with erect stems that spread into many twigs. Young twigs are angular and covered with long white hairs. The flowering takes place in April-May. The flowers are large, yellow streaked with papilionaceous corolla. C. villosus frequently grows in Algeria, France, Italy, Spain, Portugal, and Tunisia. In Algeria, it is common in the region of the Tell Algéro-Constantinois (Quezel et al., 1962) and locally known as “elugua.” To the best of our knowledge, no phytochemical work on this species has been reported. As a part of our continuing study of Algerian medicinal plants (Larit et al., 2017), we have investigated an aqueous-ethanol extract of the aerial part of C. villosus, leading to the isolation of five flavonoids (1, 3–6) including the new isoflavan-4-ol (1) and a new monoterpene (2) (Fig.3). The structures of the known compounds were confirmed through the comparison of their spectroscopic properties with the published data.
Fig 3.
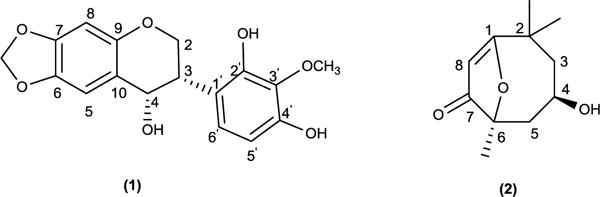
Structures of compounds 1 and 2
2. Results and discussion
Dried powdered aerial parts (1 Kg) of C. villosus were macerated at room temperature with EtOH–H2O (80:20, v/v) for 24 h, three times. The filtered crude extracts were combined and evaporated under vacuum at 40 °C to yield 25 g of extract. The dried crude extract was suspended in water (800 mL) and partitioned with chloroform (CHCl3), ethyl acetate (EtOAc) and n-butanol (n-but), yielding 500 mg (CHCl3), 5g (EtOAc) and 10g (n-butanol) fractions, respectively. Chromatographic separation of the fractions led to the isolation of the isoflavan (1) and the monoterpene (2) along with four known flavonoids: genistein (3) (Coward et al., 1993), chrysin (4) (Mouffok et al., 2012), chrysin -7-O-β-D-glucopyranoside (5) (Antri et al., 2004) and 2″-O-α-L-rhamnosylorientin (6) (Kumamoto et al., 1985). Their chemical structures were elucidated using spectroscopic methods including 1D and 2D NMR experiments, and HRESIMS. Compound 6 was isolated from Cytisus genus for the first time.
Compound 1 was obtained as a white amorphous powder, the UV spectrum of 1 showed absorption maxima at 201.0 nm and 310.0 nm suggesting a flavonoid skeleton (Mabry et al., 1970). Its negative HRESIMS spectrum showed a peak at m/z 313.0734 [M-H2O-H]− indicating the loss of H2O from the molecular ion 332.0896. The molecular formula could be deduced as C17H16O7. The 13C NMR spectrum of 1 (Table 1) showed signals for 17 carbons. The DEPT spectra indicated the presence of a methylene carbon at δC 66.4, one methylenedioxy group at δC 101.5 ppm, two methine carbon at δC 40.0 and 78.5 ppm, one methoxy group at δC 60.6 ppm, four aromatic methine carbons at δC 93.6, 105.8, 110.3 and 126.0 ppm, and eight quaternary carbons. The 1H NMR spectrum (Table1) showed an oxygenated methylene signals at δH 4.30 ppm (m, H-2b) and 3.59 ppm (d br, J = 3.1 Hz, H-2a), a methine proton signal at δH 5.52 ppm (d, J = 6.8 Hz, H-4) and an aliphatic methine at δH 3.56 ppm (H-3), suggesting an 4-hydroxyisoflavan skeleton (Bojase et al., 2001). The 1H NMR also showed signals for an ortho-coupled aromatic at δH 6.55 and 7.00 (J = 8.0 Hz), as well as, the presence of one methylenedioxy group δH 5.93 (d, J = 8.0 Hz, 2H). The COSY experiment (Fig. 4) disclosed a partial structure, CH2CHCH corresponding to the C-2, C-3 and C-4 fragment. HMBC correlations between the proton at δH 6.52 (H-8) with the signals at δC 141.5 (C-6), 147.9 (C-7), and correlations between the proton at δH 6.98 (H-5) with the signals at δC 141.5 (C-6), 147.9 (C-7), and 78.5 (C-4), as well as, the correlations of the methylemedioxy signal at δH 5.93 with C-6 and C-7 assisted the placement of the methylendioxy group at the ring A of the isoflavan. The correlation of the methoxy signal at δH 3.56 with the carbon at δC 136.0 (C-3′), helped to position the methoxy group at the ring B. Consequently, structure 1 was determined to be 2′,4′-dihydroxy-3′-methoxy-6,7-methylenedioxyisoflavan-4-ol. The absolute configuration of 1 was elucidated using electronic circular dichroism (ECD) calculations. Compound 1 possess two stereogenic centers (C-3, C-4) and was optically active ([α]25D= −24). Circular dichroism spectrum was taken to determine the absolute configuration at carbons C-3 and C-4 in the molecule. The calculated and experimental ECD spectra were compared for all possible stereoisomers (Fig. 1). The (S, S) isomer showed perfect fit with a negative cotton effect at λmax ~200 nm. Only 34 conformers were obtained for the (S, S) and 12 of them contributed more than 90% in the Boltzmann distribution (Fig. 5). The intramolecular hydrogen bonds play significant role in ligand stabilization. Thus, the structure of 1 was determined as (3S, 4S)-2′,4ʹ-dihydroxy-3ʹ-methoxy-6,7-methylenedioxyisoflavan-4-ol.
Table 1.
1H NMR and 13C NMR data of 1 (δ in ppm, in DMSO-d6, 400 and 100 MHz).
| Position | δH | δC |
|---|---|---|
| 2 | 3.59, d, 3.1, 1H 4.30, m, 1H |
66.4 |
| 3 | 3.50, m, 1H | 40.0 |
| 4 | 5.52, d, 6.8, 1H | 78.5 |
| 5 | 6.98, s, 1H | 105.8 |
| 6 | – | 141.5 |
| 7 | – | 147.9 |
| 8 | 6.52, s, 1H | 93.6 |
| 9 | – | 154.1 |
| 10 | – | 118.8 |
| 1′ | – | 113.0 |
| 2′ | – | 149.9 |
| 3′ | – | 136.0 |
| 4′ | – | 151.4 |
| 5′ | 6.55, d, 8.0,1H | 110.3 |
| 6′ | 7.00, d, 8.0, 1H | 126.0 |
| 3′-OCH3 | 3.65, s, 3H | 60.6 |
| -O-CH2-O- | 5.93, d, 8.0, 2H | 101.5 |
| OH-4′ | 9.36, br s, 1H | 151.4 |
Fig. 4.
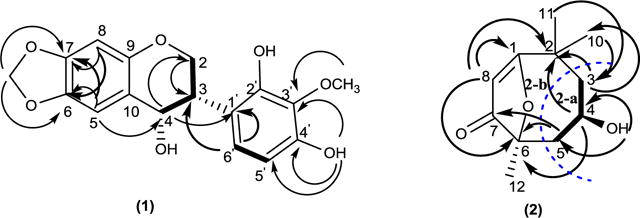
Key HMBC (H→C) and COSY (Bold bond) correlations for compounds 1 and 2
Fig. 1.
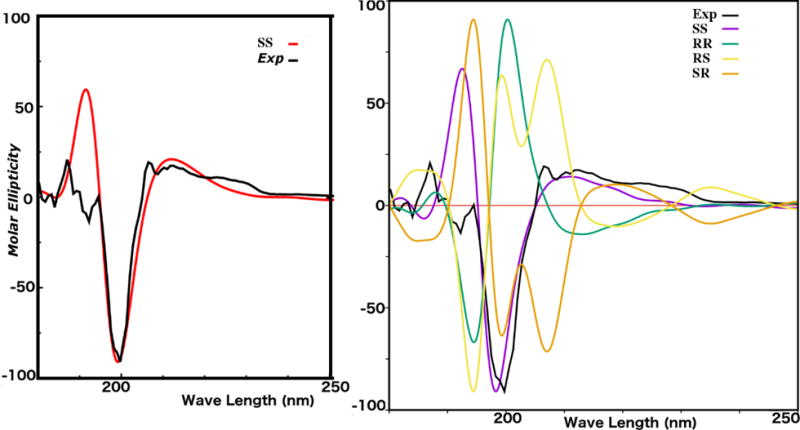
The calculated and experimental ECD spectra of compound 1
Fig. 5.
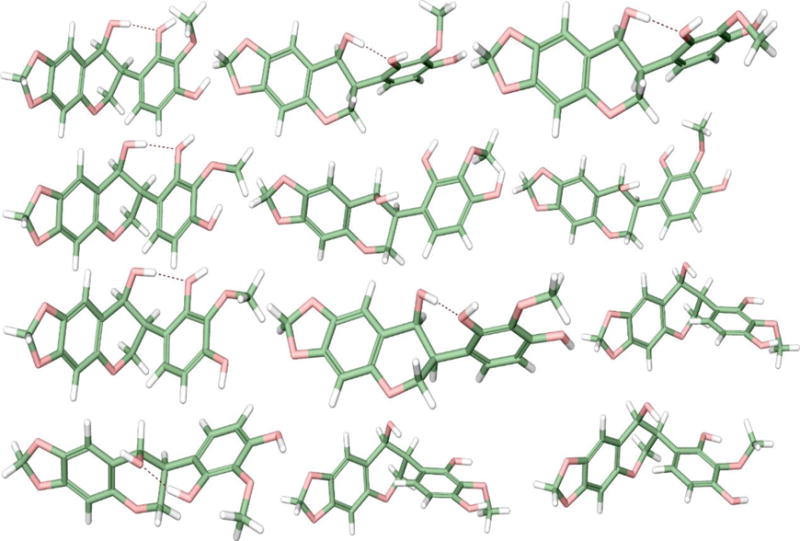
The most abundant conformers of the (S, S) isomer of compound 1. Hydrogen bonds are shown as dotted lines
Compound 2 was obtained as a yellowish white amorphous powder. Its molecular formula was revealed as C11H16O3 with four degree of unsaturation, on the base of its positive HREISMS data m/z 197.122 ([M+H]+ calcd. 197.120). The 1H NMR spectrum (Table 2) showed three methyl singlets at δH 1.19, 1.38, and 1.67 ppm. The 13C NMR and DEPT spectra (Table 2) of 2 disclosed 11 carbons including one carbonyl carbon at δC 183.5, one trisubstituted double bond at δC 171.5, one vinyl proton at δC 112.5, one oxygenated quaternary carbon at δC 86.9, one oxygenated methine at δC 65.3, one aliphatic quaternary carbon at δC 36.1, two methylene at δC 45.7, 47.0, and three tertiary methyl at δC 27.3, 26.6, 30.9 ppm. Extensive 2D NMR experiments allowed us to define the molecular connectivity. Thus, COSY experiment (Fig. 4) showed cross peak correlations of H2-3 with H-4 and of H2-5, revealing a -CH2–CH-CH2- fragment 2a. HMBC experiment (Fig. 4) of 2 disclosed correlations of δH 1.38 (CH3-10) and δC 47.0 (C-3); the signal at δH 1.19 (CH3-11) with C-3; the proton at δH 5.79 (H-8), with the signals at δC 86.9 (C-6), 171.5 (C-1) and 36.1 (C-2), suggested the partial structure 2b. The placement of the hydroxyl group in C-4 was deduced from its correlation in the COSY experiment (Fig. 4) with H-4 together with the HMBC (Fig.4) experiment which showed correlations of the hydroxyl proton at δH 5.00 with C-4 and C-5. Additional HMBC correlations of H2-5 with C-6 and C-7; H-4 with C-2 and C-6; and H2-3 with C-2 and CH3-10, required direct connections of C-3 to C-2, and of C-6 to C-5, respectively, so that 2a and 2b must be joined in the planar structure for 2. These observations, in combination with the molecular formula, indicate one carbonyl, double bond and a ring, accounted three unsaturated degrees in 2. The remaining one degree of unsaturation suggests the presence of an additional ring, the relatively downfield shifted of the 13C NMR data at δC 171.5 (C-1) and the downfield shifted of the oxygenated quaternary carbon C-6 at δC 86.9, demonstrated the presence of an ether bridge between C-6 and C-1 (Li et al., 2013). Hence, the structure of compound 2 was established as the new compound 4-hydroxy-2,2,6-trimethyl-9-oxabicyclo [4.2.1] non-1(8)-en-7-one. The absolute configuration of 2 was elucidated using electronic circular dichroism (ECD) calculations. The new compound 2 possess two stereogenic centers (C-4, C-6) and was optically active ([α]25D = −88). Circular dichroism spectra were taken to determine the absolute configuration at carbons C-4 and C-6 in the molecule. The calculated and experimental ECD spectra were compared for all possible stereoisomers. Compound 2 contains two stereogenic centers. It is highly rigid structure. It showed three conformers for the (R, S) and (S, R) isomers, and one conformer for the (R, R) and (S, S) isomers. The calculated ECD spectra of all possible isomers were compared with the experimental one (Fig. 2). The (R, S) isomer matched well the experimental results. The ECD exhibited a negative cotton effect at λmax ~ 200 nm. Thus, the gross structure of 2 established as (4R,6S)-4-hydroxy-2,2,6-trimethyl-9-oxabicyclo [4.2.1] non-1(8)-en-7-one.
Table 2.
1H NMR and 13C NMR data of 2 (δ in ppm, in DMSO-d6, 400 and 100 MHz).
| Position | δH | δC |
|---|---|---|
| 1 | – | 171.5 |
| 2 | – | 36.1 |
| 3 | 1.42, dd, 14.2, 3.7, 1H 1.87, dt, 14.1, 2.5, 1H |
47.0 |
| 4 | 4.08, dq, 6.3, 3.4, 1H | 65.3 |
| OH-C- | 5.00, d, 3.2 Hz, 1H. | 65.3 |
| 4 | 1.63, dd, 13.4, 4.0, 1H | |
| 5 | 2.29, dt, 13.2, 2.5, 1H | 45.7 |
| 6 | – | 86.9 |
| 7 | – | 183.5 |
| 8 | 5.79, s, 1H | 112.5 |
| 10 | 1.38, s, 3H | 26.6 |
| 11 | 1.19, s, 3H | 30.9 |
| 12 | 1.67, s, 3H | 27.3 |
Fig. 2.
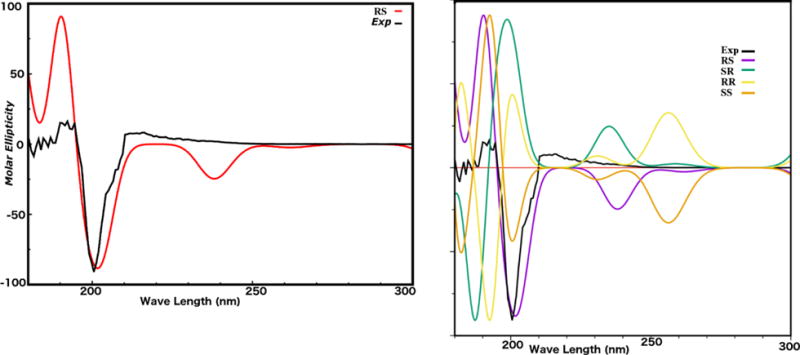
The calculated and experimental ECD of compound 2
3. Experimental
3.1. General experimental procedures
Optical rotations were recorded using a Rudolph Research Analytical Autopol V Polarimeter. UV was obtained using a Perkin-Elmer Lambda 3B UV/vis-spectrophotomer. 1H and 13C NMR spectra were obtained on Bruker model AMX 500 and 400 NMR spectrometers with standard pulse sequences, operating at 500 and 400 MHz in 1H and 125 and 100 MHz in 13C, respectively. Coupling constants were recorded in Hertz (Hz). Standard pulse sequences were used for COSY, HMQC, HMBC, NOESY and DEPT. All spectra were run at 25 °C. Chemical shifts are expressed in ppm relative to the solvent peaks serving as an internal standard. High-resolution mass spectra (HRMS) were measured on a Micromass Q-Tof Micro mass spectrometer with a lock spray source. Column chromatography was carried out on silica gel (70–230 mesh, Merck, Germany), C18 SPE (500 mg Bed, Thermo scientific, USA), Diaion HP-20 (Sorbetch technologies, Norcross, USA) and sephadex LH-20 (Sorbetch technologies, Norcross, USA). TLC (silica gel 60 F254) was used to monitor fractions from column chromatography. Preparative TLC was carried out on silica gel 60 PF254+366 plates (20 × 20 cm, 1 mm thick). Visualization of the TLC plates was achieved with a UV lamp (λ = 254 and 365 nm) and anisaldehyde/acid spray reagent (MeOH-acetic acid-anisaldehyde-sulfuric acid, 85:9:1:5).
3.2. Plant material
The aerial parts of Cytisus villosus (Pourr.) were collected from Collo region, in Northeastern Algeria during its flowering stage in April 2010. A voucher specimen (UM-10232015) has been deposited in the culture collection of the Department of BioMolecular Sciences, University of Mississippi.
3.3. Extraction and isolation
Dried powdered aerial parts (1Kg) of C. villosus were macerated at room temperature with EtOH–H2O (80:20, v/v) for 24 h, three times. The filtered crude extracts were combined and concentrated under reduced pressure to afford a 25 g of extract, which was suspended in distilled water (800 mL) and successively partitioned with chloroform (CHCl3), ethyl acetate (EtOAc) and n-butanol (n-but), yielding 500 mg (CHCl3), 5g (EtOAc) and 10g (n-butanol) fractions, respectively. The chloroform fraction (500 mg) was subjected to silica gel column chromatography (230–400 mesh) using a step-gradient elution with a nonpolar solvent (n-hexane) and the gradient increased with polar solvents (EtOAc and MeOH). The eluate was collected in subfractions (20 ml each). Each subfraction was monitored by silica gel analytical TLC (elution systems CH2Cl2-EtOAc (9:1), n-hexane-EtOAc (7:3)). Similar subfractions were combined together and concentrated under reduced pressure to afford six subfractions (C-I to C-VI). Subfraction C-II (n-hexane-acetate; 8:2) (75 mg) was subjected to Sephadex LH-20 column eluting with CH2Cl2-MeOH (1:1). Similar subfractions were combined to give subfraction C-II-1, C-II-2 and C-II-3. Subfraction C-II-1 (10 mg) was further purified by preparative TLC using CH2Cl2-EtOAc (9:1) to yield compound 1 (2 mg) as a white amorphous powder. Subfraction C-III (hexane-acetate (7:3) (50 mg) was subjected to Sephadex LH-20 column chromatography using CH2Cl2-MeOH (1:1) as eluent and further purified by preparative TLC using CH2Cl2-EtOAc (9:1) to yield compound 2 (2 mg) as a yellowish white amorphous powder. The ethyl acetate fraction (5 g) was subjected to silica gel column eluted initially with CH2Cl2-MeOH (95:5) then gradient elution with CH2Cl2-MeOH (90:10), (85:15), (80:20), (50:50), (20:80), and finally with 100% MeOH. Each subfraction was monitored by TLC on silica gel using CHCl3-EtOAc–HCOOH (5:4:1) and CH2Cl2-MeOH (1:1) systems. Similar subfractions were combined together and concentrated under reduced pressure to yield seven main subfractions (E-I to E-VII). Subfraction E-II (170 mg) was subjected to Sephadex LH-20 column using MeOH as solvent to afford compound 3 (5mg) (genistein) as light yellow needles. Subfraction E-III (161 mg) was subjected to Sephadex LH-20 using MeOH as an eluent to yield compound 4 (4 mg) as a yellow amorphous powder. Subfraction E-V (250 mg) was subjected to Sephadex LH-20 using MeOH-CH2Cl2 (1:1) as an eluent to give compound 5 (3mg) as a yellowish amorphous powder. The n-BuOH fraction (10g) was subjected to Diaion HP-20 column chromatography and eluted with distilled H2O then MeOH to give two main subfractions, the aqueous subfraction B-I (6 g) and the methanolic subfraction B-II (4 g). The methanolic subfraction B-II (4 g) was subjected to MN-polyamide-SC-6 (150 g) column chromatography which was eluted with water then with water-methanol systems gradient decreased polarities to afford eight subfractions (B-II-1 to B-II-8). Subfraction B-II-3 (250 mg) was rechromatographed on Sephadex LH-20 column eluted with MeOH-CH2Cl2 (1:1) to yield compound 6 (6 mg) as yellow crystals.
3.3.1. (3S, 4S)-2′,4′-dihydroxy-3′-methoxy-6,7-methylenedioxyisoflavan-4-ol 1
White amorphous powder; [α]D20 −24 (c 0.01, MeOH); UV (MeOH) λmax nm (log ε): 201.0 (4.29), 310.0 (3.17); CD (MeOH, c = 1.59×10⁻³mol L−1); HRESIMS: m/z 313.0734 [M-H2O-H]− (calcd. 313.0712) for formula C17H16O7; 1H and 13C NMR see Table 1.
3.3.2. (4R,6S)-4-hydroxy-2,2,6-trimethyl-9-oxabicyclo [4.2.1] non-1(8)-en-7-one 2
Yellowish White amorphous powder. [α]D20−88.0 (c = 0.01, MeOH); UV (MeOH) λmax nm (log ε): 208 (4.97), 260(3.79); CD (MeOH, c = 2.28×10⁻³mol L−1); HRESIMS: m/z 197.122 [M+H]+ (calcd. 197.120), m/z 219.104 [M+Na]+ (calcd. 219.100) for formula C11H16O3; 1H and 13C NMR see Table 2.
3.4 ECD calculations
The compounds were sketched and energy minimized in Maestro 10.2.010 (Schrödinger, 2015a). The mixed torsional/low-mode sampling method of MacroModel with OPLS3 force field was used for the conformational search step (Schrödinger, 2015b). All generated conformers were Boltzmann weighted and geometry optimized using density functional theory (DFT) at 31-6G** level in Gaussian 09 (Frisch et al., 2009). The ECD spectra were then calculated using the time-dependent DFT (TDDFT) at 31-6G** level. The calculated and experimental spectra were compared using SpecDis 1.64 (Bruhn et al., 2014).
Supplementary Material
Fig. 6.
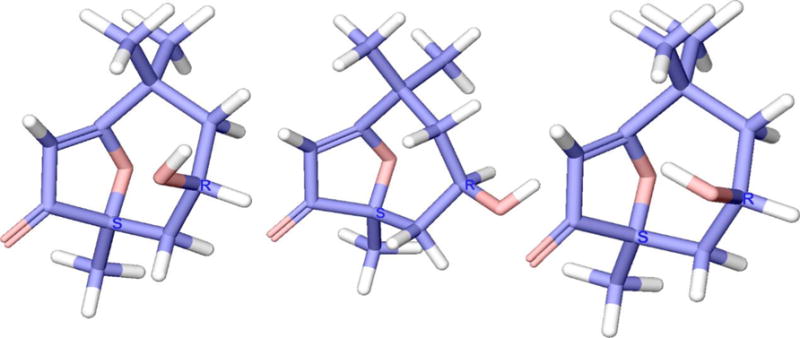
The most abundant conformers of the (R, S) isomer of compound 2
Highlights.
-
■
Two new metabolites with four known compounds were isolated from Cytisus villosus
-
■
Their structures were determined by NMR and HREIMS spectra.
-
■
The absolute configuration of compounds (1) and (2) were established by calculation ECD.
Acknowledgments
We are grateful to the Algerian Ministry of Higher Education and Scientific Research and the University of Mississippi, School of Pharmacy, Mississippi, USA for their financial support. The project described was partially supported by grant number P20GM104932 from the National Institute of General Medical Sciences (NIGMS) a component of the National Institutes of Health (NIH). The content is solely the responsibility of the authors and does not necessarily represent the official views of the NIGMS or the NIH. Furthermore, this investigation was conducted in a facility constructed with support from research facilities improvement program C06RR14503 from the NIH National Center for Research Resources (NCRR).
Appendix A. Supplementary data
Supplementary data associated with this article can be found, in the online version, at
Footnotes
Publisher's Disclaimer: This is a PDF file of an unedited manuscript that has been accepted for publication. As a service to our customers we are providing this early version of the manuscript. The manuscript will undergo copyediting, typesetting, and review of the resulting proof before it is published in its final citable form. Please note that during the production process errors may be discovered which could affect the content, and all legal disclaimers that apply to the journal pertain.
References
- Antri AE, Messouri I, Tlemçani RC, Bouktaib M, El Alami R, El Bali B, Lachkar M. Flavone Glycosides from Calycotome villosa subsp intermedia. Molecules. 2004;9:568–573. doi: 10.3390/90700568. [DOI] [PMC free article] [PubMed] [Google Scholar]
- Bhakuni DS, Dhar M, Dhar M, Dhawan B, Mehrotra B. Screening of Indian plants for biological activity: Part II. Indian J Exp Biol. 1969;7:250–262. [PubMed] [Google Scholar]
- Bojase G, Wanjala CC, Majinda RR. Flavonoids from the stem bark of Bolusanthus speciosus. Phytochemistry. 2001;56:837–841. doi: 10.1016/s0031-9422(01)00009-7. [DOI] [PubMed] [Google Scholar]
- Bruhn T, Schaumlöffel A, Hemberger Y, Bringmann G. SpecDis version 1.62. University of Wuerzburg; Germany: 2014. p. 2014. [Google Scholar]
- Coward L, Barnes NC, Setchell KD, Barnes S. Genistein, daidzein, and their beta-glycoside conjugates: antitumor isoflavones in soybean foods from American and Asian diets. J Agric and Food Chem. 1993;41:1961–1967. [Google Scholar]
- Frisch M, Trucks G, Schlegel HB, Scuseria G, Robb M, Cheeseman J, Scalmani G, Barone V, Mennucci B, Petersson G. Gaussian 09, revision a. 02. gaussian. Inc.; Wallingford, CT: 2009. p. 200. [Google Scholar]
- Hanganu D, Vlase L, Neli O. Phytochemical analysis of isoflavons from some Fabaceae species extracts. Not Bot Horti Agrobot Cluj-Napoca. 2010a;38:57. [Google Scholar]
- Hanganu D, Vlase L, Olah N. LC/MS analysis of isoflavones from Fabaceae species extracts. Farmacia. 2010b;58:177–183. [Google Scholar]
- Iwu MM. Handbook of African medicinal plants. CRC press; 2014. [Google Scholar]
- Jalili J, Askeroglu U, Alleyne B, Guyuron B. Herbal products that may contribute to hypertension. Plast Reconstr Surg. 2013;131:168–173. doi: 10.1097/PRS.0b013e318272f1bb. [DOI] [PubMed] [Google Scholar]
- Kumamoto H, Matsubara Y, Iizuka Y, Okamoto K, Yokoi K. Structure and hypotensive effect of flavonoid glycosides in kinkan (Fortunella japonica) peelings. Agric Biol Chem. 1985;49:2613–2618. [Google Scholar]
- Larit F, León F, Chaurasiya ND, Tekwani BL, Benyahia S, Benayache S, Cutler SJ. A New Phloroglucinol Derivative Isolated from Hypericum afrum, a Plant Endemic to Algeria. Rec Nat Prod. 2017;11:77–81. [Google Scholar]
- Li S, Wang P, Deng G, Yuan W, Su Z. Cytotoxic compounds from invasive giant salvinia (Salvinia molesta) against human tumor cells. Bioorg Med Chem Lett. 2013;23:6682–6687. doi: 10.1016/j.bmcl.2013.10.040. [DOI] [PubMed] [Google Scholar]
- Luís A, Domingues F, Gil C, Duarte AP. Antioxidant activity of extracts of Portuguese shrubs: Pterospartum tridentatum, Cytisus scoparius and Erica spp. J Med Plants Res. 2009;3:886–893. [Google Scholar]
- Mabry TJ, Markham KR, Thomas MB. Reagents and procedures for the ultraviolet spectral analysis of flavonoids, The systematic identification of flavonoids. Springer; 1970. pp. 35–40. [Google Scholar]
- Mouffok S, Haba H, Lavaud C, Long C, Benkhaled M. Chemical constituents of Centaurea omphalotricha. Coss & Durieu ex Batt & Trab Rec Nat Prod. 2012;6:292–295. [Google Scholar]
- Nirmal J, Babu CS, Harisudhan T, Ramanathan M. Evaluation of behavioural and antioxidant activity of Cytisus scoparius Link in rats exposed to chronic unpredictable mild stress. BMC Complementary Altern Med. 2008;8:15. doi: 10.1186/1472-6882-8-15. [DOI] [PMC free article] [PubMed] [Google Scholar]
- Pereira OR, Perez MJ, Macias RI, Domingues MR, Silva A, Marín JJ, Cardoso SM. Cytisus multiflorus: source of antioxidant polyphenols. 11° Encontro Química dos Alimentos; 16-19 Sept; Braganca, Portugal. 2012. [Google Scholar]
- Quezel P, Santa S, Schotter O. Nouvelle flore de l’Algerie et des regions desertiques meridionales-v. 1962:1–2. [Google Scholar]
- Schrödinger. MS Jaguar. Schrödinger, LLC; New York, NY: 2015a. [Google Scholar]
- Schrödinger. Release 2015-2: MacroModel. Schrödinger, LLC; New York, NY: 2015b. [Google Scholar]
- Siegel RK. Herbal intoxication: Psychoactive effects from herbal cigarettes, tea, and capsules. JAMA, J Am Med Assoc. 1976;236:473–476. doi: 10.1001/jama.236.5.473. [DOI] [PubMed] [Google Scholar]
- Sundararajan R, Koduru R. Cytisus scoparius: A review of ethnomedical, phytochemical and pharmacological information. Indo Am J Pharm Res. 2014;4:2151–2169. [Google Scholar]
- Weiss R. Herbal Medicine, translated by Meuss AR from the 6th German Edition of Lehrbuch der Phytotherapie. Gothenburg, AB Arcanum; Sweden: 1988. [Google Scholar]
Associated Data
This section collects any data citations, data availability statements, or supplementary materials included in this article.