Supplemental Digital Content is available in the text
Keywords: breast cancer, diffuse optical spectroscopy, neoadjuvant chemotherapy, pathologic response, prognosis
Abstract
Background:
This study aimed to investigate the potential of diffuse optical spectroscopy (DOT) for monitoring the responses of patients with breast cancer to neoadjuvant chemotherapy (NAC).
Methods:
We searched PubMed, EMBASE, Cochrane Database of Systematic Reviews, and Web of Science for relevant studies. Data were extracted for pooled analysis, heterogeneity testing, threshold effect testing, sensitivity analysis, publication bias analysis, and subgroup analysis.
Results:
The pooled meta-analysis of the 10 eligible studies that included 422 patients indicated the high performance of DOT for monitoring total patient responses to NAC (OR = 14.78, 95% CI: 8.23–26.54, P < .001), with low significant heterogeneity (I2 = 7.2%, P = .375). DOT possessed an area under the curve of 0.84 (95% CI: 0.81–0.87) to distinguish total patient responses to NAC. Subgroup analysis showed that the pooled sensitivity of DOT for monitoring pathologic complete response to NAC was 87%, and the pooled specificity was 70%. Meanwhile, the pooled sensitivity of DOT for monitoring pathologic complete and partial responses to NAC was 82%, and the pooled specificity was 82%. Although Begg's funnel plot (P = .049) indicated the presence of publication bias among the included studies, trim-and-fill method verified the stability of the pooled outcomes.
Conclusion:
Our meta-analysis of available published data indicated that DOT can be potentially used to predict and monitor patient responses to NAC. A larger study population is needed to fully assess the use of DOT for guiding therapies and predicting responses of individual subjects to NAC.
1. Introduction
In recent years, neoadjuvant chemotherapy (NAC) has become an important treatment modality for patients diagnosed with locally advanced inoperable breast cancer because it can reduce the tumor burden and allow rapid assessment of drug susceptibility preoperatively. Patients with pathological complete response (pCR) to NAC are considered to have longer disease-free survival than those without pCR.[1] Physical examination, mammography, ultrasound (US) scanning, and magnetic resonance imaging (MRI) are used to measure tumor size; however, the tumor size only changes at least after 3 cycles of therapy, and MRI is influenced by the histologic subtype and type of NAC.[2] All of these methods show low correlation with postsurgery pathological assessment of response. In a study of 41 patients, Schott et al[3] demonstrated that physical examination, mammography, US scanning, and MRI had sensitivities of 50%, 50%, 25%, and 25% when detecting pCR.
Diffuse optical spectroscopy (DOT) is a new diagnostic method that detects functional abnormalities and tissue activities by measuring the absorption and scattering of near-infrared light; in contrast to X-ray mammography, DOT is a nonionized, noninvasive, cost-effective technique that does not require breast compression or low breast compression. DOT can detect changes in tumor absorption within the first days after the treatment and thus could characterize breast tumor response to NAC at an earlier time than other modalities.[4–6] Previous studies[6–15] showed that DOT is a promising technique for identifying pathologic complete response (pCR) to NAC. However, the diagnostic performance of DOT varies, and it has not been subjected to multicenter studies with large samples. In the present study, we performed a meta-analysis based on current evidence to assess the potential of DOT for monitoring the responses of patients with breast cancer to NAC and establish an evidence-based recommendation for clinical practice.
2. Materials and methods
This study was conducted and reported according to the general guidelines recommended by the Primary Reporting Items for Systematic Reviews and Meta-analyses (PRISMA) Statement.[16] Protocol review and informed consent from the patient were unnecessary because publicly available tabular data were analyzed. The study was registered in PROSPERO, an international registry for systematic reviews (Protocol number: PROSPERO 2018:CRD42018093266). A PRISMA checklist that indicates all items reported is found in Supplementary Table S1.
2.1. Search strategy
We searched PubMed, EMBASE, Cochrane Database of Systematic Reviews, and Web of Science computerized databases by using the following search terms: “diffuse optical spectroscopy” AND “breast cancer” AND “neoadjuvant chemotherapy.” The search included all relevant studies and did not impose time limits or language restrictions. Two researchers (LBX and YB) independently screened studies for eligibility by reviewing their titles and abstracts by using predefined eligibility criteria. If the inclusion or exclusion criteria could not be decided based on the title and abstract, then full-text articles were retrieved and used to make decisions accordingly. Articles that were excluded were recorded with their corresponding characteristics and justification for exclusion. Full-text articles were searched for relevant references to include as additional studies. The inclusion of potential studies was validated by a second reviewer. Any disagreement was resolved by discussion among the reviewers. In addition, we manually searched the reference lists of relevant articles, reviews, and meta-analysis papers. The search was updated to include articles published until April 6, 2018.
2.2. Eligibility criteria for study selection
The full texts of articles were reviewed by 2 independent authors (YYF and ZBY). Articles were included if they met the following criteria: subjects who underwent DOT for monitoring responses to NAC, and studies that provided sufficient data to determine odds ratios (ORs) with 95% confidence intervals (CIs).
The following studies were excluded: nonoriginal research (e.g., reviews, comments, letters, and case reports), animal experimental studies, and duplication of same publications.
2.3. Data extraction
Two investigators (LBX and YFY) extracted data separately and compared the results. If divergence existed, then discussion with a third investigator was conducted to obtain final decision. After identifying overlapping reports on the same trial, we analyzed data from the most comprehensive report. The following data were extracted: authors, publication year, study design, setting, number of eligible patients, tumor subtypes, matched factors, adjusted confounding factors, methodologic quality of the study, confounding factors, percentage of patients achieving pCR or responses to NAC, NAC regimen, adjuvant chemotherapy, and clinical TNM stage. All mandatory data were extracted to fit cross-tabulations with true positives (TP)/false positives (FP)/true negatives (TN)/false negatives (FN) of the DOT results.
2.4. Quality assessment
The methodologic quality of the observational study was independently assessed by 2 reviewers (YFY and BYZ) according to the Quality Assessment of Diagnostic Accuracy Studies 2 tool (QUADAS-2)[17] for patient selection, index result, reference standard, and flow and timing of the study. The risk of bias was judged as follows: “low” if the answers to all signal questions for a domain were “yes”; “high” if any signal question in a domain was “no;” or “unclear” if insufficient information was provided. Concern about applicability was evaluated as “low,” “high,” or “unclear” with similar criteria.
2.5. Statistical analysis
All statistical analyses were conducted using STATA version 14.0 (Stata Corporation, College Station, TX). Pooled ORs with 95% CIs were calculated as summary statistic for dichotomous variables. Heterogeneity in each study was evaluated based on Cochran's Q statistic and I2 index. The random-effects model (DerSimonian and Laird method) was applied when P < .10 and/or I2 index > 50%. Otherwise, the combined estimates were shown with the fixed-effects model. Heterogeneity was quantified using I2 and classified as low (I2 < 25%), moderate (I2 25%–50%), high (I2 50%–75%), or extreme (I2 > 75%). The sensitivity, specificity, positive likelihood ratio (PLR), negative likelihood ratio (NLR), and diagnostic odds ratio (DOR) were pooled to estimate the prediction power of DOT for monitoring the responses of patients with breast cancer to NAC. To evaluate the influence of single studies on the pooled ORs, we performed a sensitivity analysis by estimating the average OR in the absence of each study. We assumed pretest probabilities of 25%, 50%, and 75% and calculated the corresponding positive and negative posttest probabilities. Publication bias was qualitatively assessed by visual inspection of the funnel plot asymmetry and quantitatively assessed by Begg's funnel plot. Trim-and-fill method was used to determine the effect of potential publication bias on the pooled estimates. All reported probabilities were 2-sided, and values at P < .05 were considered statistically significant.
3. Results
3.1. Study selection
A complete flow diagram of study selection is provided in Fig. 1. A total of 542 relevant studies were retrieved from the search. After evaluation, 3 duplicate studies were excluded and 512 studies were excluded due to lack of eligible abstracts. Twenty-six full-text studies were retrieved for further assessment, and 16 were excluded because of ineligible date. Finally, 10 studies were included in the systematic review.
Figure 1.
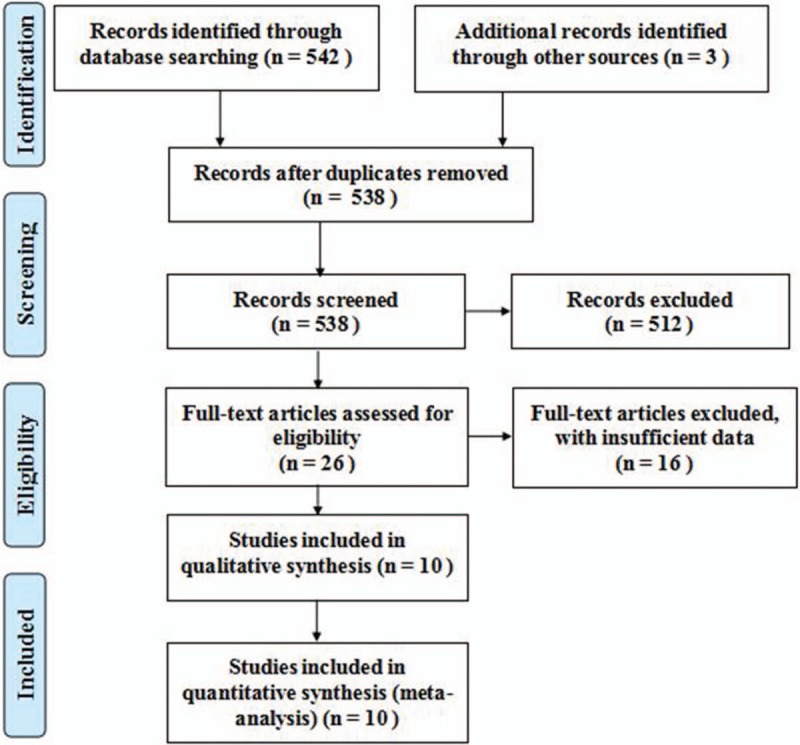
Flow diagram of studies identified in the systematic review.
3.2. Characteristics of the included studies and patients
The baseline characteristics of the included studies and patients are presented in Tables 1 and 2, respectively. Of the 10 included studies, seven were performed in North America and 3 were conducted in Asia. Four studies used total hemoglobin concentration, 3 studies used deoxygenated hemoglobin, one study used oxygenated hemoglobin, one study used oxygen saturation, and one study used blood content for measurement of patient response to NAC. The number of patients ranged from 14 to 88, with a total of 422 patients.
Table 1.
Study characteristics.

Table 2.
Key parameters extracted from the included studies.

3.3. Quality assessment
The distribution of QUADAS-2 scores of the methodologic quality (i.e., risk of bias and concerns regarding applicability) of every included study is presented in Supplemental Fig. S1. The majority of the studies were assessed as having a low risk of bias and minimal concerns regarding applicability. Common weaknesses related to uncertainties regarding consecutive sample of the patients were considered.
3.4. Pooled measures of diffuse optical tomography for monitoring patient response to NAC
The pooled data showed that DOT exhibited high predictive performance for monitoring NAC (OR = 14.78, 95% CI: 8.23–26.54, P < .001), with low heterogeneity (I2 = 7.2%, P = .375; Fig. 2). The pooled sensitivity and specificity were 0.84 (95% CI: 0.77–0.88) and 0.77 (95% CI: 0.63–0.87), respectively (Fig. S2). In addition, the pooled PLR, NLR, and DOR for NAC were 3.6 (95% CI: 2.1–6.1), 0.21 (95% CI: 0.15–0.31), and 17 (95% CI: 8–37), respectively. The area under the hierarchical SROC curve was 0.84 (95% CI: 0.81–0.87), which indicated high predictive accuracy (Fig. 3).
Figure 2.
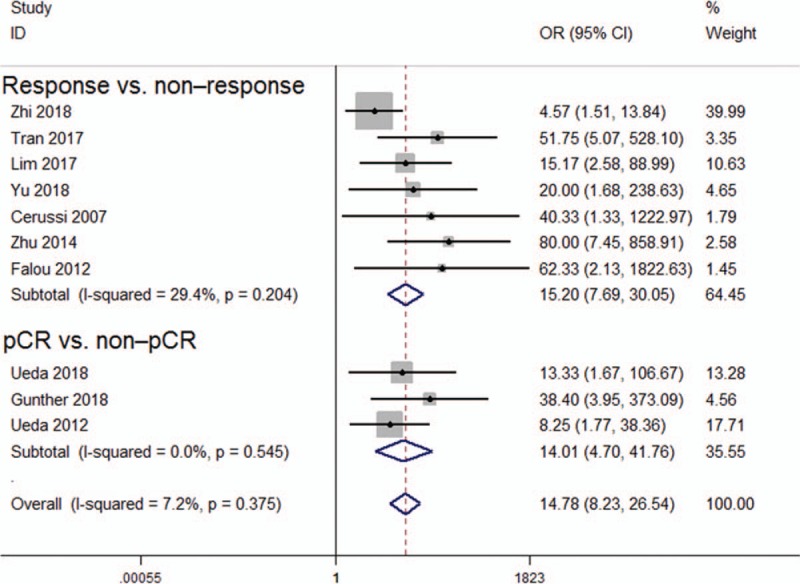
Forest plot of the association between diffuse optical spectroscopy and responses.
Figure 3.
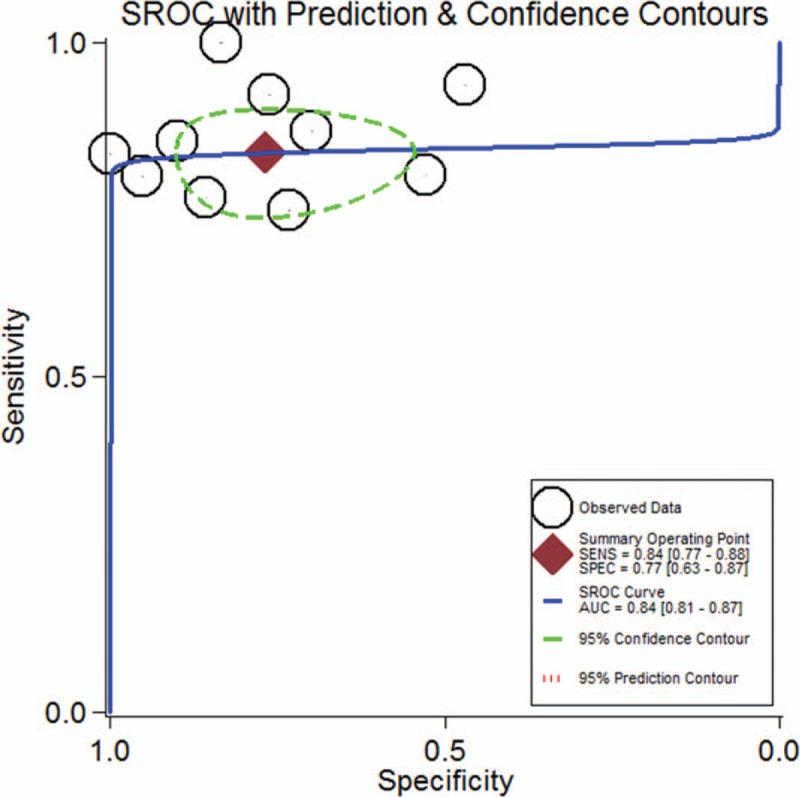
Summary ROC curve for the 10 included studies. Numbers in brackets are 95% CIs. AUC = area under ROC curve, SENS = sensitivity, SPEC = specificity.
Subgroup analysis showed that the pooled sensitivity of DOT for monitoring pCR to NAC was 87%, and the pooled specificity was 70%. The pooled sensitivity of DOT for monitoring pCR and partial response to NAC was 82%, and the pooled specificity was 82%.
All studies were sequentially removed to evaluate the effect of an individual study on the pooled ORs (Fig. 4). The pooled ORs of the sensitivity analyses varied from 15.00 (95% CI: 8.26–27.25) to 21.58 (95% CI: 10.35–45.01) for prognostic value of DOT for monitoring total response to NAC. Hence, the pooled ORs were not significantly affected by individual study.
Figure 4.
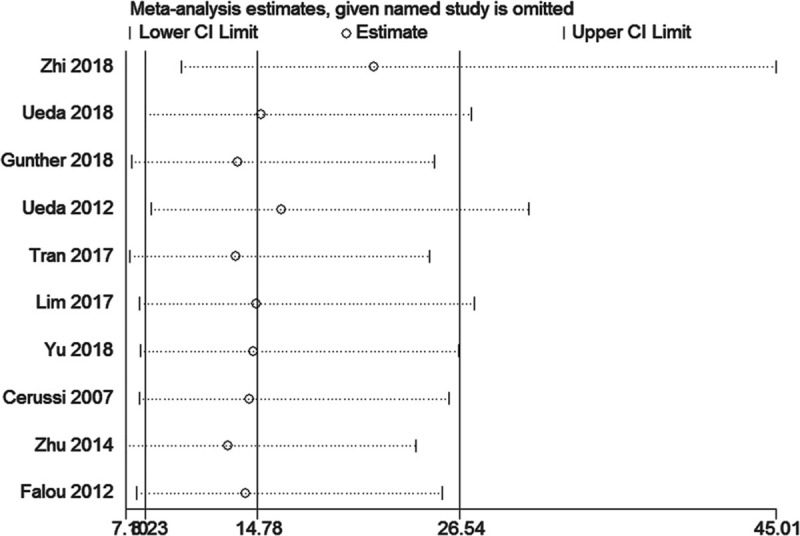
Sensitivity analysis of the relationship between diffuse optical spectroscopy and responses.
Likelihood ratios and posttest probabilities are relevant for clinicians. The Fagan plot analysis demonstrated that when pretest probabilities were 25%, 50%, and 75%, the positive posttest probabilities were 55%, 78%, and 92%, respectively, and the negative posttest probabilities were 7%, 18%, and 39%, respectively (Fig. 5).
Figure 5.
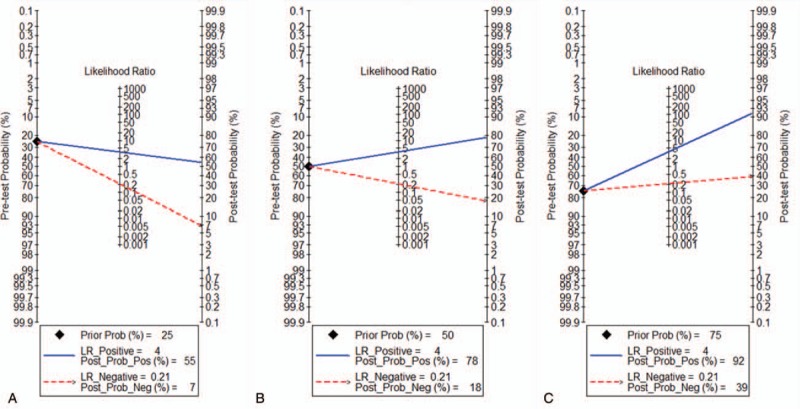
Fagan plot to evaluate the clinical efficacy utility of diffuse optical spectroscopy for monitoring the responses of patients. (A) Pretest probability = 25%; (B) pretest probability = 50%; (C) pretest probability = 75%. Each Fagan plot contains a vertical axis on the left for the pretest probability, an axis in the middle that represents the likelihood ratio, and a vertical axis on the right that represents the posttest probability. NLR = negative likelihood ratio, PLR = positive likelihood ratio.
3.5. Assessment for publication bias
The Begg test funnel plot asymmetry test indicated slight asymmetric distribution of publication bias (P = .049; Fig. 6 A). “trim-and-fill method” was then used to elucidate the possible effects of bias on the pooled analysis. As shown in Fig. 6B, the imputed analyses generated a symmetrical funnel plot after filling 5 hypothetical missing studies.
Figure 6.
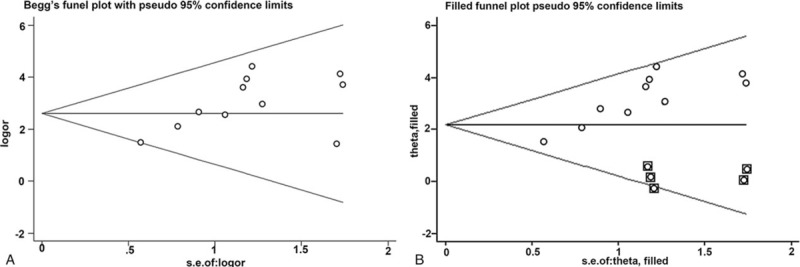
Funnel plot of the publication bias test for diffuse optical spectroscopy and the responses. (A) Begg test, and (B) trim-and-fill method.
The adjusted fixed-effects pooled OR of 8.119 (95% CI: 4.725–13.951, P < .001) calculated using trim-and-fill method was consistent with the original analysis (OR = 14.78, 95% CI: 8.23–26.54, P < .001).
4. Discussion
In this meta-analysis, we obtained all published papers that evaluated the prognostic ability of DOT for monitoring the responses of patients with breast cancer to NAC. The meta-analysis of the available published data indicated the high predictive performance of DOT for monitoring total patient response to NAC (OR = 14.78, 95% CI: 8.23–26.54, P < .001) and its low significant heterogeneity (I2 = 7.2%, P = .375).
The estimated sensitivity was 84% (and range of 73.7–100% for the component studies) for patient response to NAC. Hence, DOT could be a suitable and sensitive alternative to pathological examination when necessary. However, the pooled estimate of specificity was 77%, and the homogeneity test of specificity indicated notable heterogeneity (I2 = 74.13%, P < .001). The differences in the choice of a diagnostic threshold for a positive test result might be a source of heterogeneity. Most studies included in the present analysis set a threshold but did not pre-specify it; as such, radiologists possibly reported the equivocal findings as positive (to maximize sensitivity). Given this threshold effect, ROC curve and AUC analyses are more insightful approaches than evaluation of pooled sensitivity and pooled specificity. The area under the hierarchical SROC curve was 0.84 (95% CI: 0.81–0.87), which indicated high predictive accuracy.
In this study, Fagan plot analysis was used to explore the clinical application of DOT for monitoring patients’ responses to NAC. At a pre-test probability for responses of 25% (low clinical suspicion), the posttest probability of malignancy with a negative DOT result was 7%, which could be considered sufficient to rule out responses to NAC. At a pre-test probability for responses of 50% (worst-case scenario), the posttest probabilities of the responses with positive and negative DOT results were 78% and 18%, respectively, which indicated the usefulness of the test. At a pretest probability for responses of 75% (high clinical suspicion), the posttest probability of the responses with a positive DOT result was 92%. A positive DOT result could be considered sufficient for predicting existing responses. Therefore, DOT measurements possessed a good rule-in value and a moderate rule-out value for predicting patients’ responses to NAC.
Measured optical properties can be converted into tissue microstructure and biochemical composition parameters, such as oxygenated hemoglobin (ctO2Hb), deoxygenated hemoglobin (ctHHb), relative oxygen saturation, relative oxygen desaturation, water percentage (ctH2O), lipid percentage, scattering power, scattering amplitude, and tissue optical index. Cerussi et al[7] quantitatively measured the concentrations of ctHHb, ctO2Hb, (ctH2O), and lipids in centimeter-thick tissues. The best single predictor of therapeutic response 1 week posttreatment was ctHHb (83% sensitivity, 100% specificity), and the discrimination analysis based on combined ctHHb and ctH2O changes classified responders versus nonresponders with 100% sensitivity and specificity. However, the major drawback was that the measured optical parameters differed across studies. As such, the result has not been prospectively validated in an independent cohort.
The Begg test funnel plot asymmetry test indicated significant publication bias among the studies, suggesting that the findings should be interpreted cautiously. The small number of included studies and with the low numbers of patients within some of the studies may have resulted not only in large CIs but also in publication bias. Future large-scale studies are required to evaluate the prediction efficacy of DOT for monitoring patient responses to NAC.
Our meta-analysis presents several limitations. First, similar to other meta-analysis and systematic reviews, the conclusions drawn from the data are subject to the limitations of the included original articles themselves. These study designs possess inherent strengths and weaknesses that affect the interpretation of the results. Second, publication bias exists in our study. Although we chose to include all the data from the full-text studies and abstracts and even used trim-and-fill method to confirm the results, some negative data that were possibly omitted may have influenced the results. Third, heterogeneity could not be fully eliminated in the analysis and was found in tumor stage, age distribution, and cut-off value of the NLR.
5. Conclusion
In summary, this meta-analysis demonstrates that DOT has adequate and clinically acceptable predictive values for detection of patient responses to NAC.
Author contributions
Conceptualization: Yong Hong Liu, Ling Bo Xue, Bu Yong Zhang, Jie Li.
Writing—review & editing: Yong Hong Liu, Jie Li.
Methodology: Ling Bo Xue, Yan Fang Yang.
Software: Yang Bai.
Writing—original draft: Yang Bai, Yan Fang Yang.
Project administration: Yan Fang Yang, Bu Yong Zhang.
Formal analysis: Tian Jiao Zhao.
Resources: Tian Jiao Zhao.
Supervision: Bu Yong Zhang.
Jie Li orcid: 0000-0002-0216-4995
Supplementary Material
Footnotes
Abbreviations: CI = confidence interval, DOT = diffuse optical spectroscopy, FN = false-negative result, FP = false-positive result, NAC = neoadjuvant chemotherapy, OR = odds ratio, pCR = pathological complete response, TN = true-negative result, TP = true-positive result.
Supplemental Digital Content is available for this article.
The authors have no conflicts of interest to disclose.
References
- [1].Groheux D, Mankoff D, Espié M, et al. 18F-FDG PET/CT in the early prediction of pathological response in aggressive subtypes of breast cancer: review of the literature and recommendations for use in clinical trials. Eur J Nucl Med Mol Imaging 2016;43:983–93. [DOI] [PubMed] [Google Scholar]
- [2].Pickles MD, Lowry M, Manton DJ, et al. Prognostic value of DCE-MRI in breast cancer patients undergoing neoadjuvant chemotherapy: a comparison with traditional survival indicators. Eur Radiol 2015;25:1097–106. [DOI] [PubMed] [Google Scholar]
- [3].Schott AF, Roubidoux MA, Helvie MA, et al. Clinical and radiologic assessments to predict breast cancer pathologic complete response to neoadjuvant chemotherapy. Breast Cancer Res Treat 2005;92:231–8. [DOI] [PubMed] [Google Scholar]
- [4].Shah N, Gibbs J, Wolverton D, et al. Combined diffuse optical spectroscopy and contrast-enhanced magnetic resonance imaging for monitoring breast cancer neoadjuvant chemotherapy: a case study. J Biomed Opt 2005;10:051503. [DOI] [PubMed] [Google Scholar]
- [5].Jakubowski DB, Cerussi AE, Bevilacqua F, et al. Monitoring neoadjuvant chemotherapy in breast cancer using quantitative diffuse optical spectroscopy: a case study. J Biomed Opt 2004;9:230–8. [DOI] [PubMed] [Google Scholar]
- [6].Zhi W, Liu G, Chang C, et al. Predicting treatment response of breast cancer to neoadjuvant chemotherapy using ultrasound-guided giffuse optical tomography. Transl Oncol 2018;11:56–64. [DOI] [PMC free article] [PubMed] [Google Scholar]
- [7].Cerussi A, Hsiang D, Shah N, et al. Predicting response to breast cancer neoadjuvant chemotherapy using diffuse optical spectroscopy. Proc Natl Acad Sci U S A 2007;104:4014–9. [DOI] [PMC free article] [PubMed] [Google Scholar]
- [8].Falou O, Soliman H, Sadeghi-Naini A, et al. Diffuse optical spectroscopy evaluation of treatment response in women with locally advanced breast cancer receiving neoadjuvant chemotherapy. Transl Oncol 2012;5:238–46. [DOI] [PMC free article] [PubMed] [Google Scholar]
- [9].Ueda S, Roblyer D, Cerussi A, et al. Baseline tumor oxygen saturation correlates with a pathologic complete response in breast cancer patients undergoing neoadjuvant chemotherapy. Cancer Res 2012;5:4318–28. [DOI] [PMC free article] [PubMed] [Google Scholar]
- [10].Zhu Q, Wang L, Tannenbaum S, et al. Pathologic response prediction to neoadjuvant chemotherapy utilizing pretreatment near-infrared imaging parameters and tumor pathologic criteria. Breast Cancer Res 2014;16:456. [DOI] [PMC free article] [PubMed] [Google Scholar]
- [11].Lim EA, Gunther JE, Kim HK, et al. Diffuse optical tomography changes correlate with residual cancer burden after neoadjuvant chemotherapy in breast cancer patients. Breast Cancer Res Treat 2017;162:533–40. [DOI] [PMC free article] [PubMed] [Google Scholar]
- [12].Tran WT, Gangeh MJ, Sannachi L, et al. Predicting breast cancer response to neoadjuvant chemotherapy using pretreatment diffuse optical spectroscopic texture analysis. Br J Cancer 2017;116:1329–39. [DOI] [PMC free article] [PubMed] [Google Scholar]
- [13].Gunther JE, Lim EA, Kim HK, et al. Dynamic diffuse optical tomography for monitoring neoadjuvant chemotherapy in patients with breast cancer. Radiology 2018;161041. [DOI] [PMC free article] [PubMed] [Google Scholar]
- [14].Ueda S, Yoshizawa N, Shigekawa T, et al. Near-infrared diffuse optical imaging for early prediction of breast cancer response to neoadjuvant chemotherapy: a comparative study using FDG-PET/CT. J Nucl Med 2016;57:1189–95. [DOI] [PubMed] [Google Scholar]
- [15].Yu YH, Zhu X, Mo QG, et al. Prediction of neoadjuvant chemotherapy response using diffuse optical spectroscopy in breast cancer. Clin Transl Oncol 2018;20:524–33. [DOI] [PMC free article] [PubMed] [Google Scholar]
- [16].Liberati A, Altman DG, Tetzlaff J, et al. The PRISMA statement for reporting systematic reviews and meta-analyses of studies that evaluate health care interventions: explanation and elaboration. Ann Intern Med 2009;151:W65–94. [DOI] [PubMed] [Google Scholar]
- [17].Whiting PF, Rutjes AW, Westwood ME, et al. QUADAS-2: a revised tool for the quality assessment of diagnostic accuracy studies. Ann Intern Med 2011;155:529–36. [DOI] [PubMed] [Google Scholar]
Associated Data
This section collects any data citations, data availability statements, or supplementary materials included in this article.


