

Abstract
The folding of the human cerebral cortex is highly complex and variable across individuals, but certain common major patterns of cortical folding do exist. Mining such common patterns of cortical folding is of great importance in understanding the inter‐individual variability of cortical folding and their relationship with cognitive functions and brain disorders. As primary cortical folds are mainly genetically influenced and are well established at term birth, neonates with minimal exposure to the complicated postnatal environmental influences are ideal candidates for mining the major patterns of cortical folding. In this paper, we propose a sulcal‐pit‐based method to discover the major sulcal patterns of cortical folding. In our method, first, the sulcal pattern is characterized by the spatial distribution of sulcal pits, which are the locally deepest points in cortical sulci. Since deep sulcal pits are genetically related, relatively consistent across individuals, and also stable during brain development, they are well suited for representing and characterizing the sulcal patterns. Then, the similarity between the distributions of sulcal pits is measured from the spatial, geometrical, and topological points of view. Next, a comprehensive similarity matrix is constructed for the whole dataset by adaptively fusing these measurements together, thus capturing both their common and complementary information. Finally, leveraging the similarity matrix, a hierarchical affinity propagation algorithm is used to group similar sulcal folding patterns together. The proposed method has been applied to 677 neonatal brains, and revealed multiple distinct and meaningful sulcal patterns in the central sulcus, superior temporal sulcus, and cingulate sulcus.
Keywords: cortical surface, neonatal brain, sulcal folding pattern, sulcal pit
1. INTRODUCTION
The highly‐convoluted cortical folding is a characteristic morphology of the human brain. Although cortical folding exhibits high variability across individuals, certain common folding patterns do exist in some specific cortical regions (Ono, Kubik, & Abernathey, 1990), based on a preliminary study of visual examination of 25 autopsy specimen adult brains. However, given its small sample size and subjective categorization, it still remains unclear how many major folding patterns are present in each region, as well as the morphology and biological meaning of each folding pattern. Mining major patterns of cortical folding from the large‐scale neuroimaging datasets is thus of great importance in understanding the inter‐individual variability of cortical folding and their relationship with cognitive functions and brain disorders. The hypothesis that sulcal patterns are related to the organization and connections of cortical function areas has been discussed in many works (Cachia et al., 2016; Im et al., 2013; Klyachko & Stevens, 2003; O'Leary, Chou, & Sahara, 2007; Shi et al., 2012; Sun & Hevner, 2014). For example, it has been reported that left‐handed and right‐handed people have different central sulcus patterns (Sun et al., 2012); and the significantly atypical sulcal patterns are found in left parieto‐temporal and occipito‐temporal regions in children with developmental dyslexia (Im et al., 2016). More interestingly, there is controversy on the significance of cortical folding patterns in the brains of normal and exceptional individuals. One famous example is how Einstein's cortical folding patterns are different from normal brains (Colombo, 2018). Some studies suggest that Einstein's cortical folding pattern is unique (e.g., lacking of the asymmetry of parietal gyri, absent parietal opercula, and expended inferior parietal lobules) and related to his intellectual strengths and weaknesses (Witelson, Kigar, & Harvey, 1999); while other studies argue that Einstein's cortical folding pattern is not significantly different at all (Falk, Lepore, & Noe, 2013). Such arguments are difficult to settle unless the major categories of cortical folding patterns are discovered based on a large number of subjects.
Therefore, discovered cortical sulcal folding patterns will be useful in the following applications. First, they can be used to help build multiple folding‐pattern‐specific cortical atlases, which will lead to boosted accuracy in cortical surface registration and subsequent analysis, just as using region‐specific atlas to boost accuracy in brain MRI segmentation (Shi et al., 2010). Second, they can help examine the relationship between folding patterns and cognitive functions or genders. For example, one can study whether a specific sulcal pattern correlates with distinct cognitive abilities and behaviors. Third, they can also be used to examine whether a specific sulcal pattern is highly correlated with specific neurodevelopmental disorders, thus severing as biomarkers.
Mining the major cortical folding patterns is very challenging. First, a large‐scale dataset is required, as small datasets may not be able to sufficiently cover all kinds of major cortical patterns and may lead to biased results. However, it may take many years to collect enough subjects to build a large‐scale dataset. Second, the morphology of the cerebral cortex is so complex and variable across individuals that it is quite difficult to quantitatively and comprehensively characterize the folding patterns. Some geometric metrics such as mean curvature, sulcal depth (Li et al., 2014b; Van Essen, 2005), local gyrification index (Li et al., 2014c; Schaer et al., 2012), shape index (Koenderink & van Doorn, 1992), and surface complexity index (Kim et al., 2016) have been widely used to quantitatively measure the folding shapes and folding degree. These geometric metrics are good at capturing local detailed traits of cortical surfaces, but they are very sensitive to the minor folding and shallow sulcal variance, without encoding high‐level contextual information, thus making them inapplicable for identifying the major folding patterns.
To investigate the patterns of cortical folding using MRI, a cortical folding clustering approach has been proposed (Sun, Riviere, Poupon, Regis, & Mangin, 2007), which used 3D moment invariants to represent each sulcus and used the agglomerative clustering algorithm to group major sulcal patterns in 150 adult brains. To overcome the limited representation capability of 3D moment invariants, a more representative descriptor was proposed in (Sun, Perrot, Tucholka, Riviere, & Mangin, 2009), where the similarity between the corresponding sulci of two individuals were defined by their geometric distance after they were aligned by the affine registration. This method was applied to a dataset of 62 adult brains, and found three patterns in the left superior temporal sulcus, four patterns in the left cingulate region, and three patterns in the left inferior frontal gyrus. However, since this method highly relies on the affine registration, using the distance between two aligned cortical sulci as a similarity metric is very sensitive to the shape of cortices. Later on, an atlas‐based method was proposed to study the folding patterns in the left inferior frontal sulcus (Coulon, Fonov, Mangin, & Collins, 2012). Specifically, this method used the nonlinear registration to align the cortical surfaces and measured their similarity based on six reference points, which were manually selected on the cortical surface atlas. This method was applied to a dataset of 151 brains and detected five major sulcal patterns in the left inferior frontal sulcus. But the usage of the atlas may introduce biases, and the six manually selected reference points are too simple to comprehensively characterize the folding patterns.
Recently, sulcal pit‐based methods were proposed to study the cortical folding variability (Auzias, Brun, Deruelle, & Coulon, 2015; Im et al., 2010; Im et al., 2011; Im et al., 2013; Lohmann, von Cramon, & Colchester, 2008; Meng, Li, Lin, Gilmore, & Shen, 2014; Regis et al., 2005) and achieved meaningful results. Sulcal pits are the locally deepest points on the cerebral cortex, as shown in Figure 1. Sulcal pits have been suggested to be genetically influenced and closely related to the functional areas (Im et al., 2010; Lohmann et al., 2008; Regis et al., 2005), and proposed to be the first occurrences of cortical folds during the cortical folding development (Im et al., 2011). Although sulcal folding is highly variable across individuals, the spatial distribution of sulcal pits is relatively consistent, so sulcal pits are well suited to be reliable landmarks for characterizing sulcal folds. However, sulcal pits have not been adopted for discovering cortical folding patterns.
Figure 1.
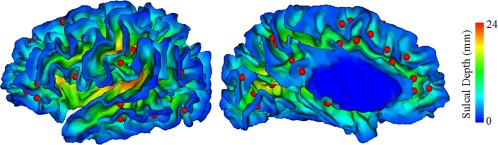
Sulcal pits are displayed as small red balls. The cortical surface is color‐coded by the value of sulcal depth [Color figure can be viewed at http://wileyonlinelibrary.com]
Inspired by these studies, this paper proposes a novel method to leverage reliable deep sulcal pits and their spatial connections to characterize the cortical folding for discovering the major sulcal patterns from a large‐scale dataset of neonatal brains (N = 677). To the best of our knowledge, this is the first time to mine major sulcal patterns from a large neonatal dataset. The motivation of using a neonatal dataset is that all primary cortical folding is genetically determined and has been established at term birth (Hill et al., 2010; Li et al., 2013); hence, neonates, which are minimally affected by the complicated postnatal environmental factors, are the ideal candidates for discovering the major folding patterns. This is very important for better understanding the biological relationships between cortical folding and brain functional development or neurodevelopmental disorders rooted during infancy.
In the proposed method, first, sulcal pits are extracted using a modified watershed algorithm based on sulcal depth (Meng et al., 2014) and then represented using a sulcal graph. Second, the difference between sulcal pit distributions of any two cortices was computed based on six complementary measurements, that is, sulcal pit position, sulcal pit depth, ridge point depth, sulcal basin area, sulcal basin boundary, and sulcal pit local connection, thus resulting in six complementary matrices. Third, these six matrices were further converted to six similarity matrices, and then adaptively fused as one comprehensive similarity matrix using a similarity network fusion technique (Wang et al., 2014a), to preserve their common information and also capture their complementary information. Finally, based on the fused similarity matrix, a hierarchical affinity propagation clustering algorithm was performed to group sulcal graphs into different clusters. The proposed method was applied to 677 neonatal brains, which, to our best knowledge, is the largest dataset in all existing studies of cortical folding patterns. Experimental results revealed multiple distinct and meaningful folding patterns in several cortical regions, including the central sulcus, superior temporal sulcus, and cingulate sulcus.
2. MATERIALS AND METHODS
2.1. Subjects and MR image acquisition
This study was approved by the Institutional Review Board of the University of North Carolina (UNC) School of Medicine. The pregnant mothers were recruited at UNC hospitals during their second trimesters of pregnancy, with the informed consents obtained from all parents. Subjects were excluded if the fetal ultrasound was abnormal or the mother had major medical diseases or psychiatric illness. The subjects in the study did not have any congenital anomaly, metabolic disease or focal lesion. Before scanning, the infants were fed, swaddled, and fitted with ear protection, and none of them was sedated. This study uses 677 term‐born neonates, including 52% males and 48% females. The basic demographic information can be seen in Table 1. More information of this study cohort can be found in (Gilmore et al., 2012).
Table 1.
Demographic information of the subjects
| Number | Gestational age at birth (days) | Gestational age at MRI (days) | |
|---|---|---|---|
| Female | 325 | 258.3 ± 20.7 | 293.8 ± 14.1 |
| Male | 352 | 257.0 ± 19.5 | 291.0 ± 13.2 |
| All | 677 | 257.5 ± 20.2 | 292.3 ± 13.7 |
Both T1‐weighted and T2‐weighted brain MR images from 677 term‐born neonates were acquired on a Siemens head‐only 3T scanner with a circular polarized head coil. T1‐weighted MR images with 160 sagittal slices were acquired with a 3D magnetization‐prepared rapid gradient echo (MPRAGE) sequence, using the parameters: TR = 1,820 ms, TE = 4.38 ms, inversion time = 1,100 ms, flip angle = 7°, and resolution = 1 × 1 × 1 mm3. T2‐weighted MR images with 70 transverse slices were acquired with the turbo spin‐echo (TSE) sequences, using the parameters: TR = 7,380 ms, TE = 119 ms, flip angle = 150°, and resolution = 1.25 × 1.25 × 1.95 mm3.
2.2. Image processing and cortical surface mapping
All MR images were processed by the UNC Infant Cortical Surface Pipeline (Li et al., 2015, Li et al., 2018). First, skull, cerebellum and brain stem were automatically stripped and removed (Shi et al., 2012). Second, the intensity inhomogeneity of MR images was corrected using N3 method (Sled, Zijdenbos, & Evans, 1998). Third, each image was rigidly aligned to the neonatal brain atlas (Shi et al., 2011). Fourth, tissue segmentation of MR images was performed by an infant‐specific level‐sets method (Wang et al., 2014b). Fifth, non‐cortical structures were automatically masked and filled, and each brain was further separated into left and right hemispheres.
To reconstruct cortical surfaces, first, for each hemisphere, topology defects of white matter were automatically corrected (Hao, Li, Wang, Meng, & Shen, 2016), and the cerebrospinal fluid in tight sulcal regions was recovered by an anatomically consistent enhancement method (Han et al., 2004). Second, the inner surface was reconstructed by tessellating the corrected white matter as a triangular mesh. Third, the outer surface was reconstructed by deforming the inner surface outwards while keeping its initial topology and spatially‐adaptive smoothness (Li et al., 2014a). Fourth, the sulcal depth of each vertex was computed as the shortest distance from the vertex to the cerebral hull surface (Li et al., 2014b). Fifth, all cortical surfaces were mapped onto a standard sphere using FreeSurfer (Dale, Fischl, & Sereno, 1999; Fischl, 2012). All spherical cortical surfaces were nonlinearly registered onto the UNC 4D Infant Cortical Surface Atlas (https://www.nitrc.org/projects/infantsurfatlas) using Spherical Demons (Yeo et al., 2010). Each registered spherical surface was resampled using a standard mesh tessellation with 163,842 vertices, thus a vertex‐to‐vertex correspondence was built between any two cortical surfaces. Note that, for our neonatal studies, tissue segmentation, cortical surface reconstruction and analysis are mainly based on T2w images, as T2w images have much better tissue contrast than T1w images.
2.3. Discovery of major sulcal patterns in neonates
The overview of the proposed method for discovering major sulcal patterns is illustrated in Figure 2. First, sulcal pits are extracted. Second, a graph‐based shape representor, namely sulcal graph, is constructed for a certain region in each cortical surface based on sulcal pits. Third, the similarity between any pair of sulcal graphs is measured from six complementary aspects. Fourth, to capture both the common information and the complementary information, the six metrics are adaptively fused together. Finally, sulcal graphs are clustered into different groups based on the fused similarity matrix. More details of each step will be introduced next.
Figure 2.

Overview of the proposed method for discovering major sulcal patterns. M1–M6 denote 6 different similarity measurements, which will be nonlinearly fused into a comprehensive one, M [Color figure can be viewed at http://wileyonlinelibrary.com]
2.3.1. Sulcal pits extraction
Deep sulcal pits were extracted from each cortical surface. The motivation of using deep sulcal pits as reliable landmarks for characterizing sulcal folding is that deep sulcal pits are relatively spatially consistent across individuals (Im et al., 2010; Lohmann et al., 2008; Meng et al., 2014), though the human cerebral cortex is highly variable across individuals. The deep sulcal pits were extracted by using an infant‐specific method (Meng et al., 2014). Specifically, each cortical surface was partitioned into small basins using a watershed method based on the sulcal depth map, and the extremely small/noisy basins were removed by a group of brain‐size‐adaptive filters. Finally, the deepest point of each basin was identified as a sulcal pit.
2.3.2. Sulcal graph and similarity measurement
Based on sulcal pits, a sulcal graph is used to characterize the sulcal folding pattern in each individual as in (Im et al., 2011). Herein, a sulcal graph is built based on the sulcal pits and their spatial neighboring relationships. Specifically, each sulcal pit is defined as a node in the sulcal graph, and two nodes are linked by an edge if their corresponding sulcal basins are spatially connected on the cortical surface.
To compare the similarity of two sulcal graphs, their difference is measured using multiple metrics from the spatial, geometrical and topological points of view. Specifically, six distinct metrics are computed according to the sulcal pit position, sulcal pit depth, sulcal basin area, sulcal basin boundary, sulcal pit local connection, and ridge point depth. Each of them is described in detail as follows.
Sulcal pit position
Given each sulcal pit in a sulcal graph , its corresponding sulcal pit is found in a sulcal graph . Because all cortical surfaces have been aligned onto a spherical surface atlas, its closest sulcal pit in can be approximately treated as the corresponding sulcal pit of . The position difference between the sulcal pit in and its corresponding sulcal pit in , noted as , is measured using their geodesic distance on the spherical surface. Similarly, the position difference between a sulcal pit and its corresponding sulcal pit in is computed as . Then the difference between sulcal pit positions of and is computed as:
| (1) |
where and are the numbers of sulcal pits in and , respectively.
Sulcal pit depth
For each subject, the sulcal depth map is normalized by dividing by the maximum depth value of the cortical surface, to reduce the effect of the brain size variation. The depth difference between each sulcal pit and its corresponding sulcal pit in is denoted as . Similarly, the depth difference between each sulcal pit and its corresponding sulcal pit in is denoted as . Then, the difference between and in terms of sulcal pit depth is defined as:
| (2) |
Ridge point depth
Ridge points are the locations where two sulcal basins meet. And the depth of the ridge point is an important indicator for distinguishing sulcal patterns. The difference between the average ridge point depths of sulcal graphs and is computed as:
| (3) |
where and are the numbers of edges in and , respectively, is the edge connecting two sulcal pits, and is the normalized sulcal depth of ridge points in the edge .
Sulcal basin area
To reduce the effect of surface size variation across subjects, the area of each basin is normalized by dividing by the area of the whole cortical surface. Let denote the area difference between the basins of sulcal pit and its corresponding sulcal pit in , and denote the area difference between the basins of sulcal pit and its corresponding sulcal pit in . The area difference between sulcal basins of graphs and is defined as:
| (4) |
Sulcal basin boundary
A vertex is treated as a boundary vertex of a sulcal basin if any of its neighboring vertices belongs to a different basin. Given two corresponding sulcal pits and , the sets of their sulcal basin boundary vertices are denoted as and , respectively. For any boundary vertex , its closest vertex is found from ; and similarly for any boundary vertex , its closest vertex was found from . Then, the difference between the sulcal basin boundaries of sulcal pits and is defined as:
| (5) |
where and are the numbers of vertices in and , respectively; and the function dis(,) computes the geodesic distance between two vertices on the spherical surface atlas. The difference between the sulcal basin boundaries of pit and its corresponding pit is defined similarly. Then, the difference between sulcal basin boundaries of graphs and is the average boundary difference over all corresponding sulcal pit pairs, as formulated below:
| (6) |
Sulcal pit local connection
The difference of sulcal pit local connection measures how well the distance between two neighboring sulcal pits in a graph is preserved after mapping them to another graph. For a sulcal pit , assume is one of its spatially connected sulcal pits, and their corresponding sulcal pits in graph are respectively and . The changes of their local connection after mapping sulcal pit to graph are measured by:
| (7) |
where is the set of all sulcal pits that connect to , and is the number of sulcal pits in . The change of local connection when mapping a pit to graph is measured similarly. Thus, the difference between local connections of two graphs and is defined as:
| (8) |
2.3.3. Fusion of sulcal graph similarities
Given sulcal graphs from all subjects, any two of them are compared using the above six metrics, so a difference matrix is constructed for each metric. Each metric measures the inter‐individual difference of sulcal graphs from a different point of view, and thus provides complementary information to each other. To leverage all these information, a similarity network fusion (SNF) method (Wang et al., 2014a) is employed to adaptively integrate all six metrics together. SNF can simultaneously keep the shared information and capture the complementary information from different measurements. To perform SNF, each difference matrix is normalized by its maximum element, and then transformed into a similarity matrix as:
| (9) |
where is a scaling parameter; could be any of the above six matrices; and are respectively the average values of the smallest elements in the ‐th row and ‐th row of . Finally, six similarity matrices are nonlinearly fused together as a single similarity matrix by using SNF with iterations. The parameters are set as , , and as suggested in (Wang et al., 2014a).
2.3.4. Sulcal pattern clustering
To cluster sulcal graphs into different groups based on the fused similarity matrix, the Affinity Propagation Clustering (APC) algorithm (Frey & Dueck, 2007) is adopted. Although there are some other clustering algorithms such as K‐Means or Spectral Clustering algorithm (von Luxburg, 2007), they require users to explicitly choose a cluster number, which is not known for sulcal patterns. Because APC could automatically determine the number of clusters based on the natural characteristics of data, it is more suitable here over other clustering algorithms. However, since sulcal folding patterns are extremely variable across individuals, too many clusters would be identified after performing APC, making it difficult to observe the most important major patterns. Therefore, a hierarchical APC framework is proposed to further group the clusters. Specifically, after running APC, the exemplars of all clusters are treated as a new dataset to perform another APC. With the exemplars being merged into the new clusters, their corresponding old clusters are also merged. In this way, less clusters are generated. However, as the old clusters merge, the previous exemplars may be no longer representative for the new clusters. Thus, a new exemplar is selected for each new cluster by maximizing the average similarity to all the other samples in the cluster. These steps can be repeated until the cluster number reduces to an expected level (<=5).
3. RESULTS
Sulcal pits were extracted from 677 neonatal cortical surfaces. To demonstrate the validity of the proposed method, three representative cortical regions (i.e., central sulcus, superior temporal sulcus, and cingulate sulcus) were selected for exploring the major sulcal patterns. For each cortical region, a 677 × 677 similarity matrix was computed using SNF and all subjects were then clustered into different groups by the hierarchical APC. To visually inspect the major sulcal patterns, an average cortical surface was constructed for each cluster. All sulcal pits in each cluster were further mapped onto the average surfaces.
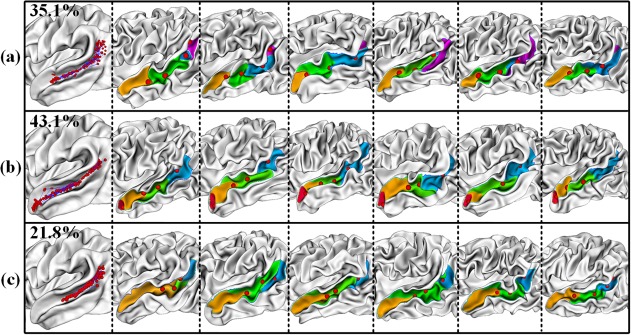
For the central sulcus, three distinct folding patterns were identified, as shown in Figure 3. In pattern (a), two concentration areas of sulcal pits can be observed, indicating two sulcal basins in the central sulcus. This pattern is further confirmed by six representative examples of individual subjects (in the second to seventh columns). In pattern (b), three concentration areas of distinct sulcal pits can be observed, with one extra area (basin 3) located in the most inferior portion of the central sulcus, compared to pattern (a). In pattern (c), three concentration areas of distinct sulcal pits can be observed as in pattern (b), but they are more concentrated. This is also confirmed by six representative examples of (c). Moreover, compared to pattern (b), the sulcal basin 2 is very short, while the sulcal basin 3 is very long in pattern (c). Such phenomenon is likely related to the “hand knob shift” in a study of the central sulcus shape in adults (Sun et al., 2012). Previously, different studies reported either two (Meng et al., 2014) or three (Im et al., 2010) sulcal basins in the central sulcus. Herein, we can see that both two‐basin and three‐basin patterns are the major patterns of sulcal folding in the central sulcus.
Figure 3.

Sulcal patterns in the central sulcus. The first column shows three discovered sulcal folding patterns, with all sulcal pits (red spheres) mapped onto the average surface of each cluster. For each pattern, the second to seventh columns show six representative examples of individual subjects. Different sulcal basins are marked with different colors. The percentage of each pattern is shown at the top‐left corner [Color figure can be viewed at http://wileyonlinelibrary.com]
For the superior temporal sulcus (STS), three distinct folding patterns were identified, as shown in Figure 4. In pattern (a), the distribution of sulcal pits in the posterior portion of STS is more diffused and bended, compared to patterns (b) and (c), indicating the differences in the folding shape of STS. This is supported by a previous cortical folding study on adults, which reported a Y‐shaped STS for some brains while a single long STS for other brains (Sun et al., 2009). In pattern (b), compared to (a) and (c), an extra concentration region of sulcal pits is present near the temporal pole, which is again confirmed by six representative examples from individual subjects, showing small sulcal basins near the temporal pole. In pattern (c), the sulcal basin in the anterior portion of STS is very long and straight, extending to the temporal pole.
Figure 4.
Sulcal patterns in the superior temporal sulcus. The first column shows three discovered sulcal folding patterns, with all sulcal pits (red spheres) mapped onto the average surface of each cluster. For each pattern, the second to seventh columns show six representative examples of individual subjects. Different sulcal basins are marked with different colors [Color figure can be viewed at http://wileyonlinelibrary.com]
For the cingulate sulcus, four distinct major folding patterns were identified, as shown in Figure 5. In pattern (a), a single long cingulate sulcus is clearly shown, while in pattern (b) two long parallel sulci are observed. This is consistent with the previous cortical folding pattern study in adults (Sun et al., 2009), which reported observation of two cingulate sulci in some brains. A study of autopsy specimen brains also reported that 24% left hemispheres had double parallel cingulate sulci (Ono et al., 1990). In pattern (c), the cingulate sulcus is interrupted in the anterior region; in contrast, in pattern (d), the cingulate sulcus is interrupted in the posterior region. These two types of interruption were also reported in (Ono et al., 1990). In the pattern (c) and the pattern (d), some parallel sulci can also be observed, but they are much shorter than those in pattern (b).
Figure 5.
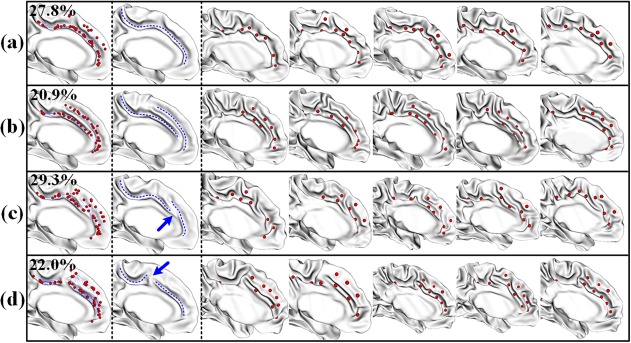
Sulcal patterns in the cingulate sulcus. The first column shows four discovered folding patterns, with all sulcal pits (red spheres) mapped onto the average surface of each cluster. The second column shows the schematic drawing of the sulcal curves (blue dashes) on the average surface of each cluster. For each pattern, the third to seventh columns show five representative examples of individual subjects. The percentage of each pattern is shown at the top‐left corner [Color figure can be viewed at http://wileyonlinelibrary.com]
To evaluate the reliability of the proposed method, the experiments were repeated 40 times with each time randomly excluding 5% ∼ 10% subjects. For the most of the time, the proposed method reports the same number of major patterns as shown in Figures 3, 4, and 5, but sometimes one more or less pattern is reported. Table 2 provides the ratio of the proposed method reporting different number of patterns. From the table, we can have two important observations. First, the proposed method tends to discover 3, 3, and 4 major sulcal patterns in the central sulcus, superior temporal sulcus, and cingulate sulcus, respectively. Second, the proposed method is more stable in the central sulcus, where the sulcal pattern is relatively simple, but is less stable in the superior temporal sulcus and cingulate sulcus, where the sulcal patterns are more complex and variable. Note that, for experiments that report the same number of patterns, their corresponding major patterns are also very similar. Table 3 further provides the discovery rate of each reported pattern in Figures 3, 4, and 5. These results suggest that reported major patterns are the significant ones, as they can be repetitively discovered in cross validations. It also indicates that the proposed method is reliable for detecting these major sulcal patterns. It is worth noting that, if spectral clustering algorithm is used (instead of hierarchical affinity propagation in the last step of the proposed method) and also the certain number of clusters is given, the discovery rates for all major patterns could reach 100%. This may suggest that (1) the sulcal graph‐based pattern similarity measurement is sufficiently stable and (2) although hierarchical APC is able to automatically determine the number of patterns, it may not be as stable as spectral clustering algorithm. Thus, in order to discover major sulcal patterns, the proposed method could be performed multiple times in a manner of cross validation, and then the majority of results can be selected as the final results.
Table 2.
Ratios of different reported number of patterns
| Number of patterns | 2 | 3 | 4 |
|---|---|---|---|
| Central sulcus | 5% | 92.5% | 2.5% |
| Superior temporal sulcus | 5% | 82.5% | 12.5% |
| Cingulate sulcus | 2.5% | 10% | 87.5% |
Table 3.
Pattern discovery rate
| Pattern index | (a) | (b) | (c) | (d) |
|---|---|---|---|---|
| Central sulcus | 100% | 95% | 100% | ‐ |
| Superior temporal sulcus | 97.5% | 100% | 97.5% | ‐ |
| Cingulate sulcus | 100% | 100% | 87.5% | 87.5% |
4. DISCUSSION
4.1. Differences with previous studies
On one hand, our method discovered major patterns in the central sulcus, superior temporal sulcus, and cingulate sulcus in neonates that exhibit many consistencies with the previous studies of adults. On the other hand, the proposed method also reveals new patterns.
To the best of our knowledge, this is the first report that explicitly identifies three different sucal patterns in the central sulcus. One previous study of the central sulcus patterns reports that the central sulcus morphology is handedness‐related (Sun et al., 2012), and one or double “hand‐knob” may appear in different positions of the central sulcus. However, this study does not categorize the central sulcus folding patterns. Even in another study of building the dictionary of brain folding patterns (Sun et al., 2009), the sulcal patterns were not categorized for the central sulcus. Both of these two studies use the same method to measure the similarity between sulcal patterns. In particular, this method scales and rigidly aligns the local cortical surface of the central sulcus of different brains, and computes the distance between two aligned local surfaces as their similarity. If this similarity measurement is used to cluster the central sulcal patterns, the results would be quite different from the results reported above. For example, as shown in Figure 6, using the method in (Sun et al., 2009), two patterns in (a) and (b) will be grouped into the same cluster, and also two patterns (c) and (d) will be grouped into another cluster. This is because the distance measurement treats every vertex in the central sulcus equally and reflects the similarity between the entire shapes of the central sulcus. However, the proposed sulcal graph‐based method will group patterns (c) and (d) into a cluster, because each of them has two sulcal basins (or sulcal pits); while patterns (a) and (d) will be separated, because each of them has three sulcal basins (or sulcal pits) and the boundary location between the pink and blue basins is quite different. In the superior temporal sulcus, the proposed sulcal graph‐based method reports a newly discovered major pattern, which exhibits a sulcal basin at the temporal pole. On the contrary, the method in (Sun et al., 2009) is not able to discover this pattern, because of the same reason as discussed above.
Figure 6.
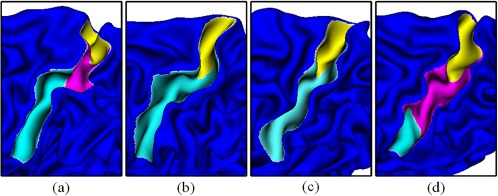
Examples of different central sulcal patterns. By comparing the sulcal shapes, sulcus (a) and sulcus (b) are similar with their curved shapes, while sulcus (c) and sulcus (d) are similar with their relatively straight shapes. By comparing the sulcal pit patterns, sulcus (b) and sulcus (c) are similar as they both have 2 sulcal basins, while sulcus (a) and sulcus (d) are different in the size of the sulcal basin, although they both have three sulcal basins [Color figure can be viewed at http://wileyonlinelibrary.com]
4.2. Number of clusters
The hierarchical APC algorithm utilized in the proposed method automatically determines the number of patterns. In order to validate the clustering method and as well as the number of clusters, another advanced clustering algorithm, namely spectral clustering, is also applied onto the fused similarity matrix to group the sulcal graphs into different number of clusters. Figure 7 shows an example of comparison results in the cingulate sulcus. The experiments show that if the cluster number is set the same as the hierarchical APC report, spectral clustering algorithm produces very similar results. If the cluster number is set differently, some reported patterns are difficult to interpret or summarize. For example, in Figure 7, if the cluster number is set as 3, two major patterns in A‐1 and A‐2 can still be observed in B‐1 and B‐2, but the pattern in B‐3 looks like a mixed combination of A‐1 and A‐3. If the cluster number is set as 5, all patterns from A‐1 to A‐4 can be observed in the results from D‐1 to D‐5. However, there is no significant difference between D‐4 and D‐5. The same phenomenon can also be seen from E‐5 to E‐6 if the cluster number is set as 6. This experiment suggests that the hierarchical clustering algorithm works well in exploring the major sulcal patterns. However, it should be pointed out the possible existence of other major patterns, which may be not discovered due to the possible limitations of the sulcal graph‐based shape descriptor.
Figure 7.

Different numbers of clusters in the cingulate sulcus. The first row is the results of the proposed method. The last four rows show the results using spectral clustering algorithm to generate 3, 4, 5, and 6 different patterns [Color figure can be viewed at http://wileyonlinelibrary.com]
4.3. Biological meanings of sulcal patterns
Although we have successfully identified representative sulcal folding patterns in several regions, the underlying mechanisms of forming such variable folding patterns still remain unclear, but likely relate to cellular variability among individuals. For example, it has been suggested that the cortical structural connectivity by white matter axons is the major driving force of the cortical folding (Nie et al., 2012; Van Essen, 1997). Thus, variable small sulcal basins likely occur in sulcal regions with cortical connections by less stable pathways between cortical areas, in comparison to stable sulcal basins. Our identified sulcal patterns may also indicate that their underlying cortical structural connectivity likely exhibits certain patterns. These will be further investigated by jointly studying cortical folding and cortical connectivity inferred by diffusion MRI in the future. Meanwhile, as deep sulci are likely genetically determined, our discovered sulcal folding patterns may also indicate possible patterns in genetic variability of subjects.
4.4. Differences with “cortical surface registration and matching”
At first glance, it seems that the method such as “cortical surface registration and matching” is also suitable to analyze cortical folding patterns. However, there are important differences between our method and the method of “cortical surface registration and matching”. Our method groups a large number of cortical surfaces based on their high‐level sulcal patterns, while “cortical surface registration and matching” method groups the cortical surfaces based on their low‐level local shape similarity. Our method is more meaningful in the following perspectives. First, sulcal patterns are characterized by the number, depth, area and shape of deep sulcal basins and their local contextual connections, which have been suggested to be genetically controlled, highly related to the cognitive functions and neurodevelopmental disorders. Therefore, sulcal patterns give us more hints to explore the biological meanings of different patterns. Second, our method only considers reliable deep sulcal regions, which enables us to better study the biological meanings of the deep sulci. In contrast, “cortical surface registration and matching” method considers both deep and shallow sulcal regions based on low‐level shape information without encoding contextual information, thus making it difficult to reveal the underlying high‐level major patterns and their relationship with biological meanings.
5. SUMMARY
Cortical folding is an important attribute of the cerebral cortex and links to cognitive functions and neurological disorders. This paper proposed a new method for discovering major sulcal patterns in the specific cortical regions by using sulcal pits formed graphs from a large‐scale dataset of neonates. The proposed method first built a sulcal graph of a certain cortical region for each subject based on the local sulcal pits distribution, and then the similarity between any two sulcal graphs were measured in six different ways, thus forming six similarity matrices. To capture both the common and complementary information in these six similarity matrices, they were further nonlinearly fused together. Finally, the fused similarity matrix was fed to the hierarchical APC, to categorize the cortical regions into different classes of major sulcal patterns. The proposed method was validated on a dataset from 677 neonatal brains, and meaningful major sulcal patterns were revealed from the central sulcus, superior temporal sulcus, and cingulate sulcus. These results may suggest that it is needed to construct multiple representative cortical folding atlases for each region for better spatial normalization of individuals.
There are three possible directions to further extend our study. The first direction is to test the proposed method in more cortical regions. Currently, only three cortical regions are explored for discovering the major sulcal pattern, but, in order to establish a complete dictionary of major sulcal patterns, more cortical regions are expected to be explored. The second direction is to study the sulcal folding patterns in relation to structural connectivity and cognitive functions. The third direction is to develop methods for discovering the gyral patterns. Sulci and gyri are the two important structures of the cerebral cortex. However, the proposed sulcal graph‐based method is not applicable to discovering gyral patterns, as sulcal pits exist only in deep sulcal basins.
ACKNOWLEDGMENTS
This work was supported in part by NIH grants (MH100217, MH108914, MH107815, MH109773, MH110274, MH070890, MH064065 and HD053000).
Meng Y, Li G, Wang L, Lin W, Gilmore JH, Shen D. Discovering cortical sulcal folding patterns in neonates using large‐scale dataset. Hum Brain Mapp. 2018;39:3625–3635. 10.1002/hbm.24199
Funding information Foundation for the National Institutes of Health, Grant/Award Numbers: HD053000, MH064065, MH070890, MH100217, MH107815, MH108914, MH109773, and MH110274
Contributor Information
Gang Li, Email: gang_li@med.unc.edu.
Dinggang Shen, Email: dgshen@med.unc.edu.
REFERENCES
- Auzias, G. , Brun, L. , Deruelle, C. , & Coulon, O. (2015). Deep sulcal landmarks: Algorithmic and conceptual improvements in the definition and extraction of sulcal pits. Neuroimage, 111, 12–25. [DOI] [PubMed] [Google Scholar]
- Cachia, A. , Borst, G. , Tissier, C. , Fisher, C. , Plaze, M. , Gay, O. , … Raznahan, A. (2016). Longitudinal stability of the folding pattern of the anterior cingulate cortex during development. Developmental Cognitive Neuroscience, 19, 122–127. [DOI] [PMC free article] [PubMed] [Google Scholar]
- Colombo, J. A. (2018). A critical view of the quest for brain structural markers of Albert Einstein's special talents (a pot of gold under the rainbow). Brain Structure and Function. [Epub ahead of print] [DOI] [PubMed] [Google Scholar]
- Coulon, O. , Fonov, V. , Mangin, J. F. , & Collins, D. L. (2012). Atlas‐based clustering of sulcal patterns – Application to the left inferior frontal sulcus. 2012 9th IEEE International Symposium on Biomedical Imaging (Isbi), 426–429. [Google Scholar]
- Dale, A. M. , Fischl, B. , & Sereno, M. I. (1999). Cortical surface‐based analysis. I. Segmentation and surface reconstruction. Neuroimage, 9(2), 179–194. [DOI] [PubMed] [Google Scholar]
- Falk, D. , Lepore, F. E. , & Noe, A. (2013). The cerebral cortex of Albert Einstein: A description and preliminary analysis of unpublished photographs. Brain, 136(4), 1304–1327. [DOI] [PMC free article] [PubMed] [Google Scholar]
- Fischl, B. (2012). FreeSurfer. NeuroImage, 62(2), 774–781. [DOI] [PMC free article] [PubMed] [Google Scholar]
- Frey, B. J. , & Dueck, D. (2007). Clustering by passing messages between data points. Science, 315(5814), 972–976. [DOI] [PubMed] [Google Scholar]
- Gilmore, J. H. , Shi, F. , Woolson, S. L. , Knickmeyer, R. C. , Short, S. J. , Lin, W. , … Shen, D. (2012). Longitudinal development of cortical and subcortical gray matter from birth to 2 years. Cerebral Cortex, 22(11), 2478–2485. [DOI] [PMC free article] [PubMed] [Google Scholar]
- Han, X. , Pham, D. L. , Tosun, D. , Rettmann, M. E. , Xu, C. Y. , & Prince, J. L. (2004). CRUISE: Cortical reconstruction using implicit surface evolution. Neuroimage, 23(3), 997–1012. [DOI] [PubMed] [Google Scholar]
- Hao, S. , Li, G. , Wang, L. , Meng, Y. , & Shen, D. (2016). Learning‐based topological correction for infant cortical surfaces. Medical Image Computing and Computer‐Assisted Intervention, 9900, 219–227. [DOI] [PMC free article] [PubMed] [Google Scholar]
- Hill, J. , Dierker, D. , Neil, J. , Inder, T. , Knutsen, A. , Harwell, J. , … Van Essen, D. (2010). A surface‐based analysis of hemispheric asymmetries and folding of cerebral cortex in term‐born human infants. Journal of Neuroscience, 30(6), 2268–2276. [DOI] [PMC free article] [PubMed] [Google Scholar]
- Im, K. , Jo, H. J. , Mangin, J. F. , Evans, A. C. , Kim, S. I. , & Lee, J. M. (2010). Spatial distribution of deep sulcal landmarks and hemispherical asymmetry on the cortical surface. Cerebral Cortex, 20(3), 602–611. [DOI] [PubMed] [Google Scholar]
- Im, K. , Pienaar, R. , Lee, J. M. , Seong, J. K. , Choi, Y. Y. , Lee, K. H. , & Grant, P. E. (2011). Quantitative comparison and analysis of sulcal patterns using sulcal graph matching: A twin study. Neuroimage, 57(3), 1077–1086. [DOI] [PubMed] [Google Scholar]
- Im, K. , Pienaar, R. , Paldino, M. J. , Gaab, N. , Galaburda, A. M. , & Grant, P. E. (2013). Quantification and discrimination of abnormal sulcal patterns in polymicrogyria. Cerebral Cortex, 23(12), 3007–3015. [DOI] [PMC free article] [PubMed] [Google Scholar]
- Im, K. , Raschle, N. M. , Smith, S. A. , Ellen Grant, P. , & Gaab, N. (2016). Atypical sulcal pattern in children with developmental dyslexia and at‐risk kindergarteners. Cerebral Cortex, 26(3), 1138–1148. [DOI] [PMC free article] [PubMed] [Google Scholar]
- Kim, S. H. , Lyu, I. , Fonov, V. S. , Vachet, C. , Hazlett, H. C. , Smith, R. G. , … Network, I. (2016). Development of cortical shape in the human brain from 6 to 24months of age via a novel measure of shape complexity. Neuroimage, 135, 163–176. [DOI] [PMC free article] [PubMed] [Google Scholar]
- Klyachko, V. A. , & Stevens, C. F. (2003). Connectivity optimization and the positioning of cortical areas. Proceedings of the National Academy of Sciences of the United States of America, 100(13), 7937–7941. [DOI] [PMC free article] [PubMed] [Google Scholar]
- Koenderink, J. J. , & van Doorn, A. J. (1992). Surface shape and curvature scales. Image and Vision Computing, 10(8), 557–565. [Google Scholar]
- Li, G. , Nie, J. , Wang, L. , Shi, F. , Gilmore, J. H. , Lin, W. , & Shen, D. (2014). Measuring the dynamic longitudinal cortex development in infants by reconstruction of temporally consistent cortical surfaces. Neuroimage, 90, 266–279. [DOI] [PMC free article] [PubMed] [Google Scholar]
- Li, G. , Nie, J. , Wang, L. , Shi, F. , Lin, W. , Gilmore, J. H. , & Shen, D. (2013). Mapping region‐specific longitudinal cortical surface expansion from birth to 2 years of age. Cerebral Cortex, 23(11), 2724–2733. [DOI] [PMC free article] [PubMed] [Google Scholar]
- Li, G. , Nie, J. , Wang, L. , Shi, F. , Lyall, A. E. , Lin, W. , … Shen, D. (2014). Mapping longitudinal hemispheric structural asymmetries of the human cerebral cortex from birth to 2 years of age. Cerebral Cortex, 24(5), 1289–1300. [DOI] [PMC free article] [PubMed] [Google Scholar]
- Li, G. , Wang, L. , Shi, F. , Gilmore, J. H. , Lin, W. , & Shen, D. (2015). Construction of 4D high‐definition cortical surface atlases of infants: Methods and applications. Medical Image Analysis, 25(1), 22–36. [DOI] [PMC free article] [PubMed] [Google Scholar]
- Li, G. , Wang, L. , Shi, F. , Lyall, A. E. , Lin, W. , Gilmore, J. H. , & Shen, D. (2014). Mapping longitudinal development of local cortical gyrification in infants from birth to 2 years of age. Journal of Neuroscience, 34(12), 4228–4238. [DOI] [PMC free article] [PubMed] [Google Scholar]
- Li, G. , Wang, L. , Yap, P. T. , Wang, F. , Wu, Z. , Meng, Y. , … Shen, D. (2018). Computational neuroanatomy of baby brains: A review. Neuroimage. [DOI] [PMC free article] [PubMed] [Google Scholar]
- Lohmann, G. , von Cramon, D. Y. , & Colchester, A. C. (2008). Deep sulcal landmarks provide an organizing framework for human cortical folding. Cerebral Cortex, 18(6), 1415–1420. [DOI] [PubMed] [Google Scholar]
- Meng, Y. , Li, G. , Lin, W. , Gilmore, J. H. , & Shen, D. (2014). Spatial distribution and longitudinal development of deep cortical sulcal landmarks in infants. Neuroimage, 100, 206–218. [DOI] [PMC free article] [PubMed] [Google Scholar]
- Nie, J. , Guo, L. , Li, K. , Wang, Y. , Chen, G. , Li, L. , … Liu, T. (2012). Axonal fiber terminations concentrate on gyri. Cerebral Cortex, 22(12), 2831–2839. [DOI] [PMC free article] [PubMed] [Google Scholar]
- O'Leary, D. D. , Chou, S. J. , & Sahara, S. (2007). Area patterning of the mammalian cortex. Neuron, 56(2), 252–269. [DOI] [PubMed] [Google Scholar]
- Ono, M. , Kubik, S. , & Abernathey, C. D. (1990). Atlas of the cerebral sulci. Stuttgart New York: Thieme Medical Publishers. [Google Scholar]
- Regis, J. , Mangin, J. F. , Ochiai, T. , Frouin, V. , Riviere, D. , Cachia, A. , … Samson, Y. (2005). Sulcal root” generic model: A hypothesis to overcome the variability of the human cortex folding patterns. Neurologia Medico‐Chirurgica, 45(1), 1–17. [DOI] [PubMed] [Google Scholar]
- Schaer, M. , Cuadra, M. B. , Schmansky, N. , Fischl, B. , Thiran, J. P. , & Eliez, S. (2012). How to measure cortical folding from mr images: A step‐by‐step tutorial to compute local gyrification index. Jove‐Journal of Visualized Experiments, 2(59), e3417. [DOI] [PMC free article] [PubMed] [Google Scholar]
- Shi, F. , Wang, L. , Dai, Y. , Gilmore, J. H. , Lin, W. , & Shen, D. (2012). LABEL: Pediatric brain extraction using learning‐based meta‐algorithm. Neuroimage, 62(3), 1975–1986. [DOI] [PMC free article] [PubMed] [Google Scholar]
- Shi, F. , Yap, P. T. , Fan, Y. , Gilmore, J. H. , Lin, W. , & Shen, D. (2010). Construction of multi-region-multi-reference atlases for neonatal brain MRI segmentation. Neuroimage, 51, 684–693. [DOI] [PMC free article] [PubMed] [Google Scholar]
- Shi, F. , Yap, P.‐T. , Gao, W. , Lin, W. , Gilmore, J. H. , & Shen, D. (2012). Altered structural connectivity in neonates at genetic risk for schizophrenia: A combined study using morphological and white matter networks. Neuroimage, 62, 1622–1633. [DOI] [PMC free article] [PubMed] [Google Scholar]
- Shi, F. , Yap, P. T. , Wu, G. , Jia, H. , Gilmore, J. H. , Lin, W. , & Shen, D. (2011). Infant brain atlases from neonates to 1‐ and 2‐year‐olds. PLoS One, 6(4), e18746. [DOI] [PMC free article] [PubMed] [Google Scholar]
- Sled, J. G. , Zijdenbos, A. P. , & Evans, A. C. (1998). A nonparametric method for automatic correction of intensity nonuniformity in MRI data. IEEE Transactions on Medical Imaging, 17(1), 87–97. [DOI] [PubMed] [Google Scholar]
- Sun, T. , & Hevner, R. F. (2014). Growth and folding of the mammalian cerebral cortex: From molecules to malformations. Nature Reviews. Neuroscience, 15(4), 217–232. [DOI] [PMC free article] [PubMed] [Google Scholar]
- Sun, Z. Y. , Kloppel, S. , Riviere, D. , Perrot, M. , Frackowiak, R. , Siebner, H. , & Mangin, J. F. (2012). The effect of handedness on the shape of the central sulcus. Neuroimage, 60(1), 332–339. [DOI] [PubMed] [Google Scholar]
- Sun, Z. Y. , Perrot, M. , Tucholka, A. , Riviere, D. , & Mangin, J. F. (2009). Constructing a dictionary of human brain folding patterns. Medical Image Computing and Computer‐Assisted Intervention, 12, 117–124. [DOI] [PubMed] [Google Scholar]
- Sun, Z. Y. , Riviere, D. , Poupon, F. , Regis, J. , & Mangin, J. F. (2007). Automatic inference of sulcus patterns using 3D moment invariants. Medical Image Computing and Computer‐Assisted Intervention, 10, 515–522. [DOI] [PubMed] [Google Scholar]
- Van Essen, D. C. (1997). A tension‐based theory of morphogenesis and compact wiring in the central nervous system. Nature, 385(6614), 313–318. [DOI] [PubMed] [Google Scholar]
- Van Essen, D. C. (2005). A population‐average, landmark‐ and surface‐based (PALS) atlas of human cerebral cortex. Neuroimage, 28(3), 635–662. [DOI] [PubMed] [Google Scholar]
- von Luxburg, U. (2007). A tutorial on spectral clustering. Statistics and Computing, 17(4), 395–416. [Google Scholar]
- Wang, B. , Mezlini, A. M. , Demir, F. , Fiume, M. , Tu, Z. , Brudno, M. , … Goldenberg, A. (2014). Similarity network fusion for aggregating data types on a genomic scale. Nature Methods, 11(3), 333–337. [DOI] [PubMed] [Google Scholar]
- Wang, L. , Shi, F. , Li, G. , Gao, Y. , Lin, W. , Gilmore, J. H. , & Shen, D. (2014). Segmentation of neonatal brain MR images using patch‐driven level sets. Neuroimage, 84, 141–158. [DOI] [PMC free article] [PubMed] [Google Scholar]
- Witelson, S. F. , Kigar, D. L. , & Harvey, T. (1999). The exceptional brain of Albert Einstein. Lancet (London, England), 353(9170), 2149–2153. [DOI] [PubMed] [Google Scholar]
- Yeo, B. T. , Sabuncu, M. R. , Vercauteren, T. , Ayache, N. , Fischl, B. , & Golland, P. (2010). Spherical demons: Fast diffeomorphic landmark‐free surface registration. IEEE Transactions on Medical Imaging, 29(3), 650–668. [DOI] [PMC free article] [PubMed] [Google Scholar]