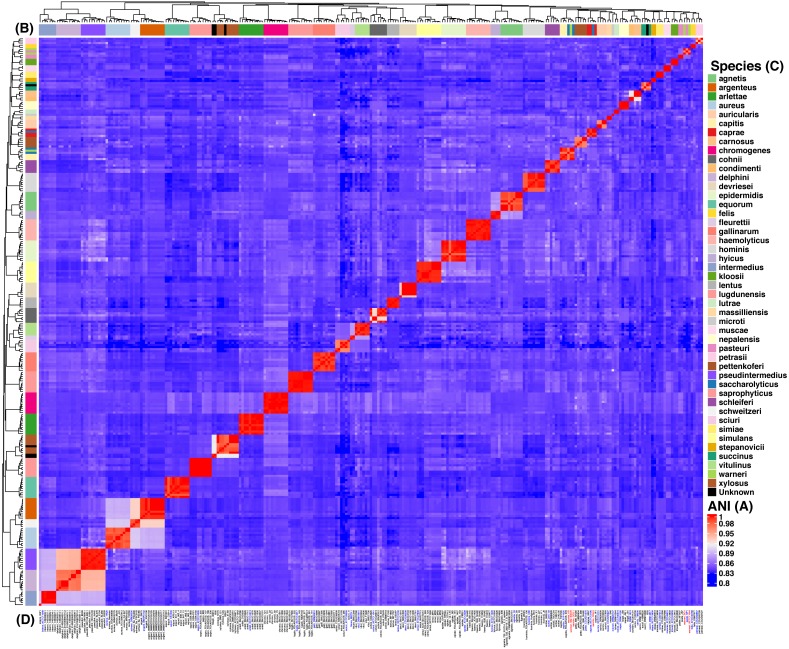
Figure 2. Heat map of the Average Nucleotide Identity (ANI) analysis of the 269 strains from Staphylococcus spp.
The reddish cells show identity percentages above 95% implying that the strains belong to the same species, whereas non-reddish colors denote identity percentages below 95% (see ANI key, A). The rows on and by the heat map (B) show the species assignation (see Species key, C) and the dendograms show the clustering of the strains. Strain identifiers (D) are as in Fig. 1 and the color-coding is as follows: blue gives the type strains, whereas red shows the strains with issues of mis-classification. This analysis indicates 44 clearly discernible Staphylococcus spp.

