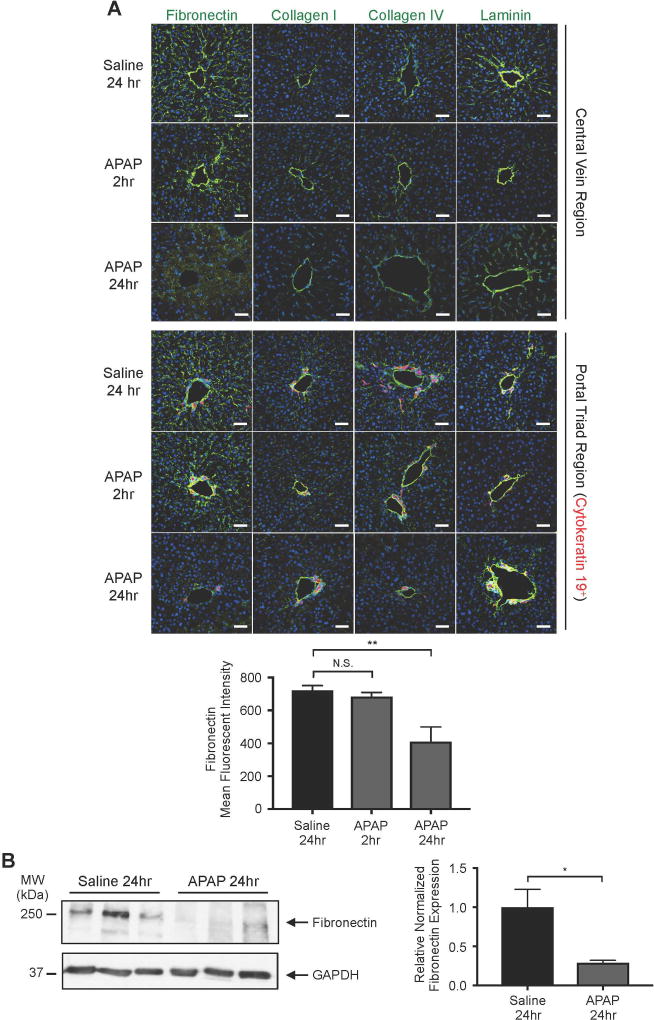
Fig. 4. Fibronectin is significantly degraded around hepatic blood vessels after APAP overdose.
(A) The ECM components fibronectin, collagen I, collagen IV, and laminin were each immunostained (green) in liver sections from mice treated with saline for 24 hr or with APAP for 2 or 24 hr. The upper panel depicts immunostaining in the central vein region, while the lower panel depicts staining in the portal triad region, as indicated by the bile duct marker cytokeratin 19 (red). Hoechst (blue) was used as a nuclear counterstain. Scale bars: 50 µm. The graph represents mean fluorescent intensity of fibronectin staining ± SEM, as measured in 4 samples from 3–4 mice. (B) Western blot of fibronectin and GAPDH (loading control) in whole liver lysates collected at 24 hr after saline versus APAP treatment. Each lane contains a sample from a separate mouse. Quantification of the individual fibronectin bands normalized to respective GAPDH bands and again to the mean saline treatment value is shown at the right; error bars represent ± SEM. Statistical analyses were performed using a one-way ANOVA with Dunnett’s multiple comparisons test (A) and an unpaired two-tailed t-test (B); *P<0.05; **P<0.01.

