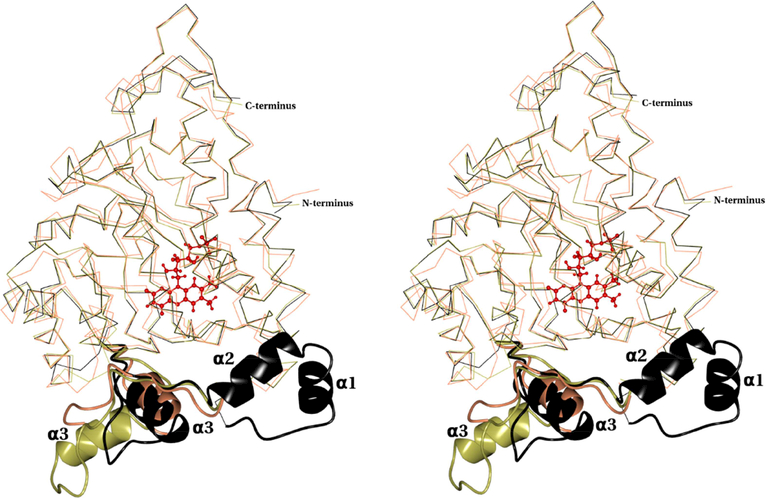
Fig.11.
Stereo view of the superposition of Cα trace of MDH (black), GOX (coral) (pdb id: 1GOX) and MDH-GOX2 (gold) (pdb id:1P4C). The MDH membrane binding segment (residues 177–229) along with the corresponding segment from MDH-GOX2 (residues 177–210) and GOX (residues 176–209) are shown as ribbons in their respective colors. The three α-helixes of the membrane binding region are marked as α1, α2 and α3. The FMN is shown as ball and stick in red color.

