Abstract
Drug resistance is a major problem in the treatment of liver cancer. mTORC1 inhibitors have been tested for the treatment of liver cancer based on hyperactive mTOR in this malignancy. However, their clinical trials showed poor outcome due likely to their ability to upregulate CD133 and promote chemoresistance. CD133+ tumor initiating stem cell-like cells (TICs) isolated from mouse and human liver tumors are chemoresistant, and identification of an approach to abrogate this resistance is desired. In search for a compound which rescinds TIC’s resistance to mTORC1 inhibition and improves chemotherapy, we identified baicalein (BC) which selectively chemosensitizes TICs and the human HCC cell line Huh7 cells but not mouse and human primary hepatocytes. Nano-beads pull-down and mass-spectrometric analysis, biochemical binding assay and three-dimensional computational modeling studies, reveal BC’s ability to competitively inhibit GTP binding of SAR1B GTPase essential for autophagy. Indeed, BC suppresses autophagy induced by an mTORC1 inhibitor and synergizes cell death caused by mTORC1 inhibition in TIC and Huh7 spheroid formation and in the patient-derived xenograft model of HCC. BC-induced chemosensitization is rescued by SAR1B expression and phenocopied by SAR1B knockdown in cancer cells treated with a mTORC1 inhibitor.
Conclusion
These results identify SAR1B as a novel target in liver TICs and HCC cells resistant to mTORC1 inhibition.
Keywords: flavone, liver cancer, drug resistance, SAR1B, RAB1
Introductory Statement
Forty to fifty percent of liver cancer has a clonal component which drives early tumor initiation and recurrence by a small population of tumor initiating stem cell-like cells (TICs) (1). The survival outcome of patients with hepatocellular carcinoma (HCC) is inversely correlated with the expression of CD133, the TIC marker appearing in advanced stages of the disease (2, 3). In alcohol- and obesity-associated liver cancers, Toll-like receptor 4 (TLR4) is ectopically expressed and activated in TICs, leading to induction of Nanog and other pluripotent genes, self-renewal and tumor-initiating activity (4–6).
Surgical resection and liver transplantation are the only efficacious treatments for early liver cancer and are applicable to only a fraction of patients. In patients with advanced HCC who are not surgical candidates, chemoembolization, local ablation, and systemic chemotherapy remain primary options (7). However, HCC is often chemoresistant, and TICs are believed to contribute to this resistance (1). The lack of understanding of biology concerning drug resistance in cancer, constitutes an obvious hurdle for the development of an efficacious anti-cancer drug (1). The only therapeutic agent currently approved for HCC is sorafenib, a Raf kinase inhibitor, but its clinical benefits are limited and not durable (8, 9).
The mammalian Target of Rapamycin (mTOR) pathway is one of the most well studied pathways in cancer as it often is activated in tumors including HCC (10, 11). Indeed, activation of mTOR pathway in transgenic mice (12) is sufficient to cause HCC. Liver-specific deficiency of TSC1, the inhibitory GAP for Rheb, results in sustained activation of mTOR and development of liver tumors (13). These studies prompted clinical trials of mTOR inhibitors such as rapamycin and its analogs, everolimus (RAD001), temsirolimus (CCI-779), and deforolimus (AP23573). In general, these mTORC1 inhibitors were tolerated well but had limited or no therapeutic benefits as demonstrated by a most recent multicenter randomized, double blind phase III study with everolimus which ended with the negative outcome (14). In fact, inhibition of the mTORC1 pathway promotes liver tumorigenesis in the mouse model of DEN-induced liver cancer either through enhanced liver injury (15) or CD133 induction (12, 16).
Biological functions controlled by mTOR pathway are diverse, but two most characterized functions are cell growth and autophagy suppression. Autophagy is a homeostatic mechanism essential for cellular fitness activated during stress, senescence, or compromised cell growth (17). In cancer cells, autophagy serves as a survival mechanism from therapeutic treatment, manifested by chemoresistance (17). Autophagy requires an orchestration of vesicle transport (18), and damaged proteins and organelles are brought into autophagosomes via the microtubule-associated protein 1A/1B-light chain 3 (LC3) complex containing p62/SQSTM1. Under starvation or stress, LC3-I is conjugated with phosphatidylethanolamine (LC3-II) to facilitate the formation of autophagosomes. If damaged proteins are not transported to autophagosomes, p62/SQSTM1 accumulates in cells, aggravating ER stress.
As rapamycin analogs inhibit mTORC1 and in turn induce autophagy in cancer cells, we hypothesized that this effect must counteract the mTOR inhibitor’s efficacy. In fact, autophagy inhibitors, such as chloroquine (CQ), synergize the cytotoxic effect of rapamycin analogs on cancer cells (19, 20), suggesting concomitant suppression of autophagy with growth inhibition of mTOR inhibitors, is required. In search of a small molecule which abrogates chemoresistance of TICs, we identified baicalein (BC) as a bioactive small phytochemical which achieves this effect on mouse liver TICs and human HCC cells. In particular, BC’s chemosensitizing effect is most pronounced with mTORC1 inhibition in vitro and in vivo, and this is because BC blocks autophagy stimulated by a mTORC inhibitor by interfering the GTP binding activity of SAR1B GTPase. Accordingly, the combination treatment with BC and temsirolimus (CCI-779) almost completely kills TICs and HCC cells but not primary hepatocytes, and inhibits HCC growth in the PDX model. Our study has identified a new strategy to eliminate drug resistant TICs by targeting SAR1B with a unique pharmacophore.
Experimental Procedures
(Additional methods described in Supplementary Information)
Cell culture and treatments
Mouse liver TICs were originally isolated by FACS based on surface expression of CD133 and CD49f from liver tumors developed in HCV NS5A transgenic (Tg) mice fed alcohol according to the protocol described before (4) and later confirmed by isolation of similar TICs from HCV Core Tg mice fed alcohol, Spnb+/− mice, NS5A Tg mice fed Western diet (24) and HCC tissues excised from alcoholic HCV infected patients (5). They were cultured and maintained as a cell line in Dubecco’s Modified Eagle Medium (DMEM): Nutrient Mixture F-12 media (Life Technologies, CA) with 10% fetal bovine serum (FBS), 20 ng/ml murine EGF (Peprotech, NJ), Embryomax nucleosides (Millipore, MA), 100 nM dexamethasone (Sigma-Aldrich, MO), and antibiotic-antimycotic (Life Technologies, CA). Huh7 cells were cultured and maintained in the same medium without EGF. To isolate primary hepatocytes, the liver of normal C57/B6j mice (Jackson Laboratory, ME) was digested with 0.04% (w/v) collagenase Type I, and hepatocytes were purified by centrifuging on Percoll. The hepatocytes were treated in the TIC medium without FBS. Frozen human hepatocytes were obtained from University of Kansas Liver Center. Induction qualified cryopreserved human hepatocytes were purchased from Thermo Fisher Scientific (#HMCPIS). All compounds used for treatment were purchased from Sigma-Aldrich, dissolved in DMSO, aliquotted and kept frozen in −20°C. 6,7-dihydroxy, 5-methoxyflavone was synthesized by WuXi Pharmatech, China. Yang-Gan-Wan (YGW) powder was suspended and vortexed briefly in serum free DMEM-F12 medium. The soluble fraction was collected and diluted to 35 mg/ml in serum free DMEM-F12. The extract was further diluted in TIC medium without serum for final treatment.
GTP binding assay
The cells were lysed in 0.25 ml of GTP binding buffer on ice after three freeze-thaw cycles as described previously (21). GTP-agarose (50 μl) (Sigma Aldrich, MO) was added to each tube containing 0.25 ml of lysate and incubated at 4°C for one hour by rotating. The input (the initial lysate), the unbound fraction (the lysate left after one hour incubation with GTP-agarose) and GTP bound fraction were collected. GTP bound proteins were denatured in 40 μl of 6X SDS sample buffer by boiling the beads for 10 min. The input and unbound fractions were denatured in 1X SDS sample buffer. The fractions were separated in the SDS gel and immunoblotting was performed with indicated antibodies.
Spheroid formation and clonogenic assays
TICs (1000 cells) were suspended in serum free TIC medium with 1% methylcellulose supplemented with B27, 20 ng/ml EGF and 20 ng/ml FGF in each well of 96-well ultralow attachment plate. The cells were treated with with compounds for 7 days and colonies bigger than approximately 40 μm were enumerated. To measure drug resistant cells, 1x10⁵ cells were treated in spheroid formation conditions without methylcellulose for 7 days in the 96-well ultralow attachment plate (Corning, NY). At the end of the treatment, cells in 25–50 μl were replated in regular 6-well tissue culture plate in TIC medium with 10% FBS for 5 to 7 days without any drugs. At the end of the treatment, the cells were fixed with methanol/acetic acid mixture (1/7) and stained with 1% crystal violet at room temperature. The crystal violet was extracted with 10% acetic acid and diluted with four fold of water. The amount of crystal violet was measured at 570 nm.
Affinity purification of the Blin-binding proteins
Blin and the related compounds-fixed affinity nano-beads were prepared as previously described (22). Briefly, Blin, rosmarinic acid, or carsonic acid was incubated at 1 or 5 mM with equal amounts of N-hydroxysuccinimide and 1-ethyl-3-(3-dimethylaminopropyl) carbodiimide (Dojindo, MD) for 2 hr at room temperature with amino-modified affinity beads. For purification of Blin-binding proteins, 0.2 mg of beads were equilibrated with the binding buffer (20 mM HEPES (pH7.9), 100 mM NaCl, 1 mM MgCl2, 0.2 mM EDTA, 10% glycerol, 0.1% NP40), and incubated with 0.2 mg/ml of TIC cell lysate or mouse liver cytosolic extract at 4˚C for 1 h. Bound proteins were eluted with SDS-loading dye, analyzed by SDS-PAGE and then visualized by silver staining (Wako, VA). Bound proteins were subjected to in-gel digestion by trypsin, and the fragments of the peptides were analyzed by ESI-MS (Waters: Synapt G2). For competition assay, recombinant RAB1A protein (ATGEN, CA) was pre-incubated with indicated amounts of GTP or ATP for 30 min, and then mixed with the BC-fixed nano-beads for 1 hr. Bound proteins were visualized by silver staining mentioned above.
Patient derived xenograft
A piece of HCC was obtained from a patient at the Keck Medical Center of University of Southern California with informed consent. Tumor collection and use were approved by Institutional Review Board of the University of Southern California (HS-16-00392). Freshly excised HCC was cut into 8 mm3 pieces and transplanted subcutaneously in the right flank of 6-wk old male NSGTM mice (NOD-SCID-Il2rg−/− mice, Jackson Laboratory). On the third and fourth passages, the mice were grouped randomly and treated intraperitoneally with vehicle, BC (20 mg/kg), CCI-779 (5 mg/kg) or both compounds. The compounds were solubilized by a four times concentrated solution containing 50% cremophor EL (EMD Millipore) and 50% ethanol and kept frozen at −20°C. Prior to treatment, the compounds were thawed and diluted four times with bacteriostatic saline. Tumor volumes were measured with a caliper at indicated days and calculated as (LXW2)/2.
Statistical analysis
All statistical analyses and IC50 values were determined by Prism Software (Graphpad, CA). Concentration of the compounds were Log transformed and the IC50 determined using Hill Plot analysis. Where appropriate, statistical comparison was performed by t-test, one-way or two-way ANOVA with Bonferroni post-test. Error bars indicate SEM of replicate experiments.
Results
Baicalein suppresses stemness genes and induces apoptosis of liver TICs
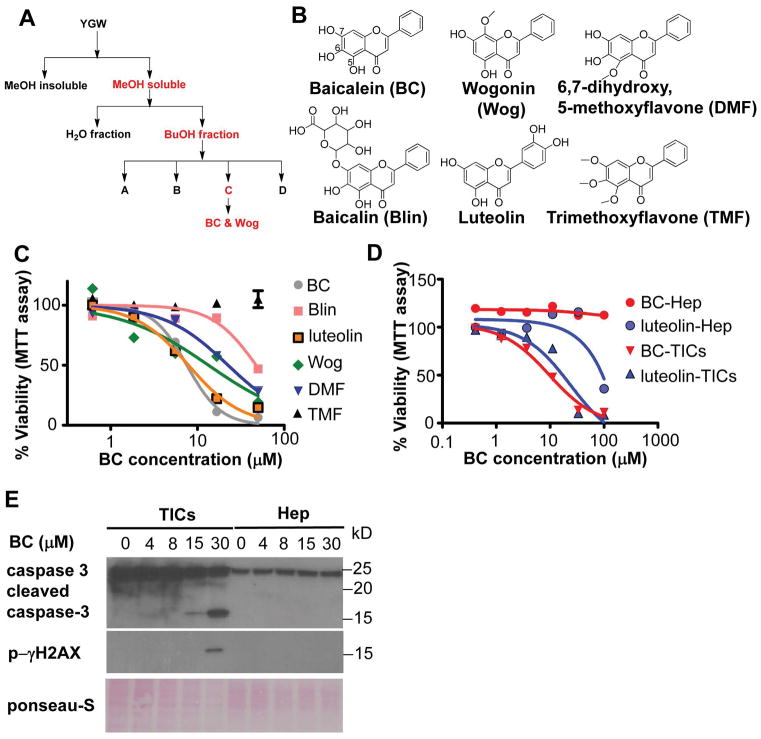
We used mouse liver CD133+ TICs isolated from HCV NS5A Tg mice as a model to screen small molecules which selectively kill TICs. These TICs have also been isolated from three other HCC animal models and patient HCC tissues, and characterized for their NANOG-dependent self-renewal and tumor-initiating activities (4,5), the leptin receptor OB-R-mediated OCT4 and SOX2 upregulation (23), TWIST induction by NANOG and STAT cooperation (24), NANOG-mediated loss of p53 via NUMB phosphorylation, and NANOG-driven mitochondrial metabolic reprogramming (25). We screened the aqueous extract of the herbal mixture YGW which protects from CCl4 hepatotoxicity (26, 27), selectively kills TICs, and prevents DEN-induced liver tumor development (Fig S1–3). Our strategy utilized fractionation of the extract to test for selective toxicity toward TICs and for the ability to inhibit pluripotent genes and induce hepatocyte differentiation genes (Fig 1A). Fractions identified to possess peak activities of selective TIC cytotoxicity were subjected to NMR analysis for molecular identification (Fig S4) (28). This analysis discovered that baicalein (BC, 5,6,7-trihydroxyflavone) is a main chemical responsible for selective cytotoxicity of TICs. We also identified wogonin (5,7-dihydroxy-8-methoxy flavone) having a similar activity. Having identified these two structurally similar flavones, we acquired several derivatives of BC as shown in Fig 1B and tested them in TIC viability assay (Fig 1C). This analysis revealed that the TIC lethality was dependent on the polyphenolic structure (-OH) at C5-7 and was reduced by decreasing these phenolic groups (Fig 1B and 1C). For example, BC with –OH at all C5-7 positions has the highest potency (IC50 = 7.3 μM); wogonin (Wog) with –OH at C5 and C7 (IC50 = 13.8 μM), 6,7 dihydroxy, 5 metoxyflavone (DMF) with –OH at C6 and C7 (IC50 = 16.6 μM), or baicalin (Blin) with –OH at C5 and C6 has the intermediate killing effect (IC50 = 48.9 μM), and trimethoxyflavone (TMF) with all -OH groups replaced with the methoxyl group has no activity (Fig 1C). Luteolin with -OH at C5 and C7 and an additional catechol –OH structure in a benzene at the side arm shows a similar potency (IC50 = 6.22 μM) as BC against TICs, suggesting the importance of a catecholic group. Of note is neither BC nor luteolin showed toxicity in normal mouse hepatocytes until the concentration reaches 100μM (Fig 1D). BC also selectively induced apoptosis markers in TICs but not in hepatocytes, such as caspase 3 cleavage and p-γH2AX formation (Fig 1E).
Figure 1. Baicalein induces apoptosis in liver TICs.
A) A bioactivity guided fractionation scheme to identify bioactive components of YGW that induce apoptosis of TICs. Active fractions are highlighted in red. YGW extract was fractionated and tested for TIC selective toxicity and modulation of pluripotent and differentiation genes. B) Structures of BC and related flavones evaluated for TIC toxicity are shown. C) Comparison of TIC cytotoxicity by the flavones tested by MTT assay after 4 days of treatment with indicated compounds. D) Selective cytotoxicity of BC and luteolin to TICs vs. freshly isolated primary mouse hepatocytes (mHep) as determined by the MTT assay after 4 days of treatment. IC50 values BC and Luteolin in TICs are 7.25 μM and 6.17 μM respectively. IC50 values of the other compounds cannot be calculated because they are not sigmoidal curves. E) Immunoblot detection of apoptosis markers in TICs and mHep treated with BC for 24 hr. F) Cytotoxicity of Huh7 cells vs. human hepatocytes treated with BC as assessed by MTT assay, showing selective killing of Huh7 cells but not human hepatocytes.
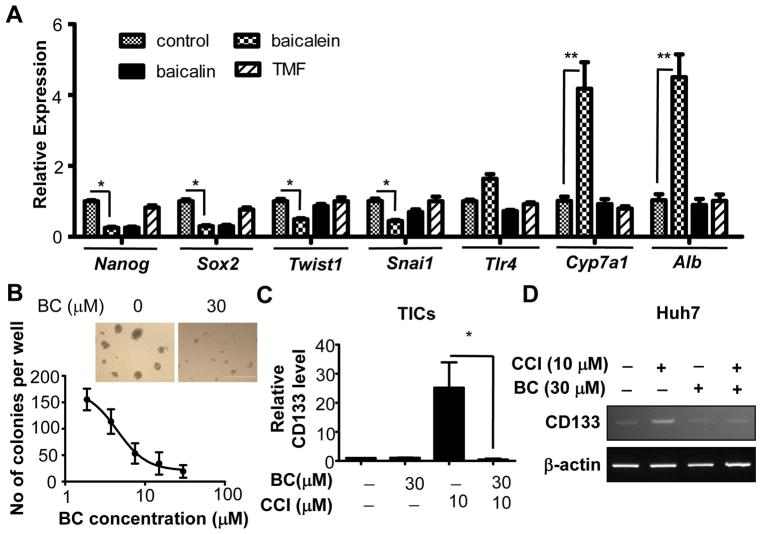
BC inhibited pluripotent (Nanog and Sox2) and EMT (Twist1 and Snai1) genes while upregulating hepatocyte differentiation genes (Cyp7a1 and Alb) (Fig 2A) and suppressed TIC self-renewal as evident by reduced spheroid formation (Fig 2B). These results suggested that BC preferentially reduces the viability of liver TICs by suppressing self-renewal and stemness. Pharmacokinetics and intracellular uptake assays showed BC is as an active compound in liver (Fig S5), and hepatocytes convert BC to Blin more efficiently than TICs while TICs’ ability to convert Blin to BC is superior than hepatocytes (Fig S5E–H), providing a possible explanation for selective toxicity of BC on TICs over hepatocytes.
Figure 2. Baicalein inhibits stemness in liver TICs.
A) Analyses of BC and its derivatives on expression patterns of self-renewal and differentiation genes after 24 hr of treatment. B) Effects of BC on self-renewal of TICs in methylcellulose-based spheroid formation assay after 7 days of treatment. Scale bars represent 400 μm. C) Q-PCR measurement of CD133 mRNA in TICs treated with BC, CCI779 and both for 24 hr. D) RT-PCR measurement of CD133 mRNA in Huh7 treated with BC, CCI779 and both for 18 hr. Error bars are SEM of three replicate treatments. Statistical comparison was performed by One-way ANOVA with Bonferroni post-test. *p<0.05 and **p<0.01.
Baicalein eliminates CD133+ TICs resistant to mTORC1 inhibition
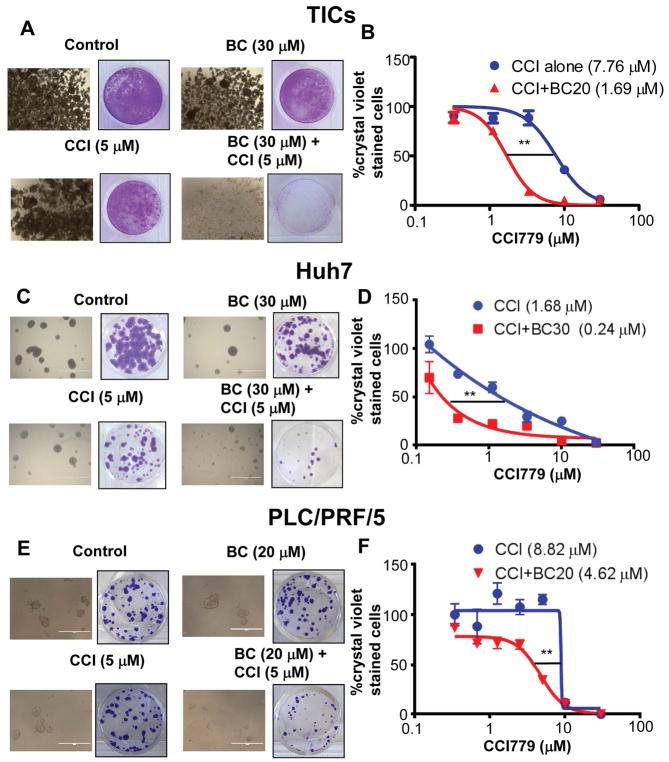
We next tested the chemosensitizing effect of BC for therapeutic agents currently used for liver cancers—rapamycin, sorafenib and doxorubicin. Although BC enhanced cytotoxicity of sorafenib and doxorubicin toward TICs (Fig S6A and Fig S6B), its chemosensitizing effect on rapamycin was more pronounced (Fig S6C). mTORC1 inhibitors induce the expression of CD133 in cancer cells and enrich CD133+ cancer cells (12, 16), raising a possibility that this effect may cause the chemoresistance and limit the efficacy of anti-cancer drugs. Indeed, we found that a rapamycin analog, temsirolimus (CCI779) treatment induced CD133 in TICs and the human HCC Huh7 cells. However, co-treatment of BC completely prevented this induction (Fig 2C and Fig 2D) and synergistically promoted cytotoxicity of TICs (Fig S6D). BC and CCI779 co-treatment also suppressed other stemness genes such as Nanog and Sox2 in TICs (Fig S7). We also tested this BC effect in the spheroid culture condition, the condition that enhances drug resistance compared to two-dimensional culture. We treated TIC spheroids with BC in the presence or absence of CCI779 for 7 days and any surviving cells were replated in normal two-dimensional culture. TIC spheroids were completely eliminated by the combination treatment of BC and CCI779 while some spheroids still remained after individual treatments (Fig 3A). When these remaining spheroids were replated, the resistant cells grew again in the culture dish. However, the combination treatment with BC and CCI779 eliminated these resistant cells as measured by the crystal violet staining (Fig 3A). To determine whether this combination effect is additive or synergistic, we calculated the combination index (CI) using the Chou-Talalay equation (29). The CI was determined to be 0.58, verifying that the effect was synergistic. Furthermore, the BC treatment decreased the IC50 value of CCI779 for TICs by 4.5 fold (Fig 3B). BC had a similar activity in human HCC Huh7 (Fig 3C & 3D) and PLC/PRF/5 cells (Fig 3E & 3F), which were also resistant to mTORC1 inhibition. The combination of BC and CCI779 also enhanced caspase 3 cleavage in Huh7 cells compared to treatment of individual compound (Fig S8 left), but neither compound induces caspase 3 cleavage in human hepatocytes (Fig S8 right).
Figure 3. Baicalein eliminates liver TICs resistant to mTORC1 inhibition.
TICs and Huh7 cells were treated in spheroid formation condition for 7 days and the surviving cells or spheroids were re-plated in normal tissue culture condition for another 3–5 days. Representative pictures of A) TICs, C) Huh7 and E) PLC/PRF/5 cells after 7 days of the treatments are shown. Surviving re-plated cells stained with crystal violet are shown in A), C) and E) respectively. BC chemosensitizes B) TICs, D) Huh7 and F)PLC/PRF/5 cells toward CCl779 as assessed by crystal violet staining and expressed as percent of control. IC50 values are shown in parentheses. For quantitative data, means and SEMs are shown, and two-way ANOVA analysis was performed with Bonferroni post-test to determine the statistical significance. **p<0.01.
Baicalein binds and inhibits small GTPases involved in vesicle transport
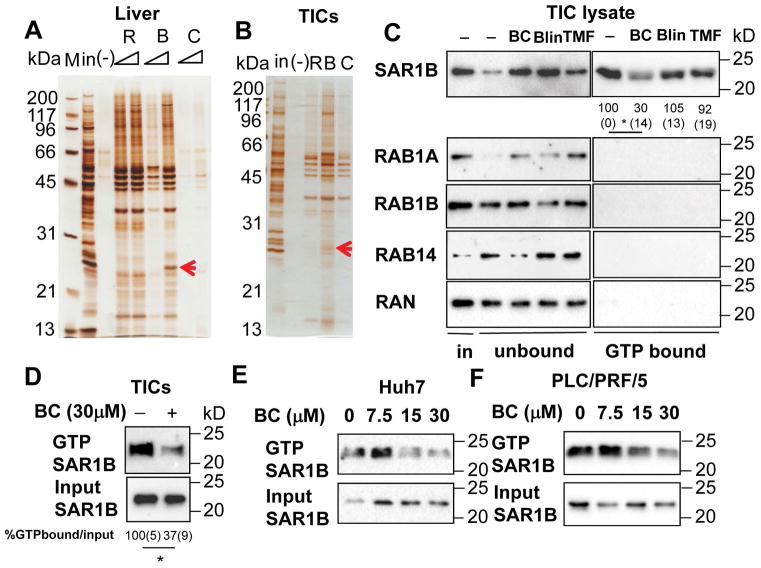
Next, we aimed to identify the molecular target of BC for the observed TIC cytotoxic effect. For this, we conjugated nanobeads onto Blin via its glucuronate moiety which readily allowed this manipulation while BC without this moiety could not be conjugated without disturbing the functional groups (Fig S9). Although Blin is less potent than BC in TIC cytotoxicity assay, we anticipated that Blin’s flavone backbone would still bind to same target molecules as BC. We incubated the nanobead-conjugated Blin (B) with TIC or mouse liver lysate and pulled down associated proteins for gel display. Rosmarinic acid-nanobeads (R) and carsonic acid-nanobeads (C) were used as negative controls. Silver staining identified protein bands only present with B. One corresponding to the molecular size of 26kD in both liver and TIC lysate was cut out and subjected to mass spectrometry (Fig 4A and 4B), which identified RAB1B, RAB1B, SAR1B, RAB14 and RAN. All of these proteins have one common function: the transport of vesicles as GTPases.
Figure 4. Baicalein blocks GTP binding of small GTPases in TICs.
Silver staining of proteins pulled down by R:Rosmarinic acid, B:Baicalin, C:Carnosic acid conjugated to nano-beads from protein lysates of A) liver and B) TICs. Blin-beads binding proteins are indicated by red arrows and are shown to include small GTPases by mass spectrometry. C) BC specifically blocks SAR1B from binding to GTP in TICs. TIC lysates were treated with BC, Blin and TMF at 30 μM for one hour in the presence of GTP-agarose. GTP bound proteins were pulled down and immunoblotted with indicated antibodies. SAR1B activation was quantitated by densitometry and expressed as percent of the control. Values are shown below each band. *p<0.05. Average (SEM) values from three experiments are shown. Statistical analyses were performed by One-way ANOVA with Bonferroni post-test. D) BC treatment in TICs blocked activation of SAR1B. TICs were treated with BC for 2 hr. The cells were lysed and GTP bound proteins were pulled down and immunoblotted with SAR1B antibody. SAR1B activation in TICs was quantitated by densitometry and expressed as percent of the control. Average (SEM) values from three experiments are shown. Statistical analysis was performed by the student’s t-test. *p<0.05. E) Huh7 and F) PLC/PRF/5 cells were treated with different concentrations of BC for 2 hr. The cells were lysed and GTP bound proteins were pulled down and immunoblotted with SAR1B antibody.
Having identified the GTPases as potential targets, we next examined the expression and activity of these GTPases in TICs. Immunoblotting demonstrated that SAR1B, RAB1B and RAN are expressed at high levels in TICs (the first lane of the left panel in Fig 4C). However, when we pulled down these proteins with GTP-agarose to assess their activities in TICs (21), only SAR1B showed high activity but not RAB1A, RAB1B, RAB14 and RAN (the first lane of the right panel of Fig 4C), suggesting that in TICs, SAR1B is a major active GTPase. We then added BC, Blin, and TMF to TIC lysate to determine their effects on SAR1B activity. BC, but not Blin or TMF, reduced SAR1B binding of GTP-agarose (most upper blot of the right panel, Fig 4C), suggesting BC interferes GTP binding to SAR1B, the step required for its activity. To validate BC inhibition of SAR1B-GTP binding in intact TICs, TICs were treated with BC (30μM) and cell lysate was analyzed for GTP-agarose binding. This analysis confirmed inhibition of SAR1B-GTP binding by BC (Fig 4D). Similarly, BC inhibited SAR1B-GTP binding in human HCC cell lines, Huh7 and PLC/PRF/5 (Fig 4E and 4F). We also showed that the increasing concentration of GTP but not of ATP blocked the ability of Blin-nanobeads to pull down recombinant RAB1A protein (Fig S10A), suggesting the similar competition between GTP and Blin for RAB1A binding. In 293FT cells transduced with RAB1B, BC also reduced the amount of RAB1B pulldown by GTP-agarose (Fig S10B). Thus, RAB1B-GTP binding is also inhibited by BC in this cell-free or RAB1B-transduced cell lysate. But as this GTPase is not as active as SAR1B in TICs, SAR1B most likely represents a primary target of BC in TICs.
We performed the three-dimensional computational modeling analysis to identify the possible mode of interactions between BC and SAR1B (30, 31). The analysis revealed that BC binds to a pocket near a region known as STAR (Sar1-NH2-terminal activation recruitment) motif, a motif responsible for activation and its interaction with SEC12 GEF (Guanine Nucleotide Exchange Factor) (31), (Fig S10C and 10D) through three critical amino acids: D47, M44 and Y186 (Fig S10E) with the weak binding energy of −5.53 kcal/mol. These data suggest BC may interfere the STAR-dependent functions including GEF binding, as well as GAP binding, inhibiting cyclic activation of SAR1B. In contrast, we discovered that BC’s primary mode of RAB1B inhibition is via its interaction with the GTP binding site of RAB1B through five critical amino acids: Y33, C23, N121, D124 and K153 (Fig S10F and S10G). Y33 and C23 are conserved between RAB1A and RAB1B. N121, D124 and K153 residues which are responsible for interacting with phenolic functional groups on BC, are conserved among various RAB proteins and SAR1B (Fig S11), suggesting SAR1B may also be targeted by the same mechanism. The free energy of BC binding to the guanine binding site of RAB1B is estimated to be −8.82 kcal. These data suggest that BC has different modes of inhibition on GTPases.
Baicalein inhibits autophagosome formation stimulated by mTOR inhibition
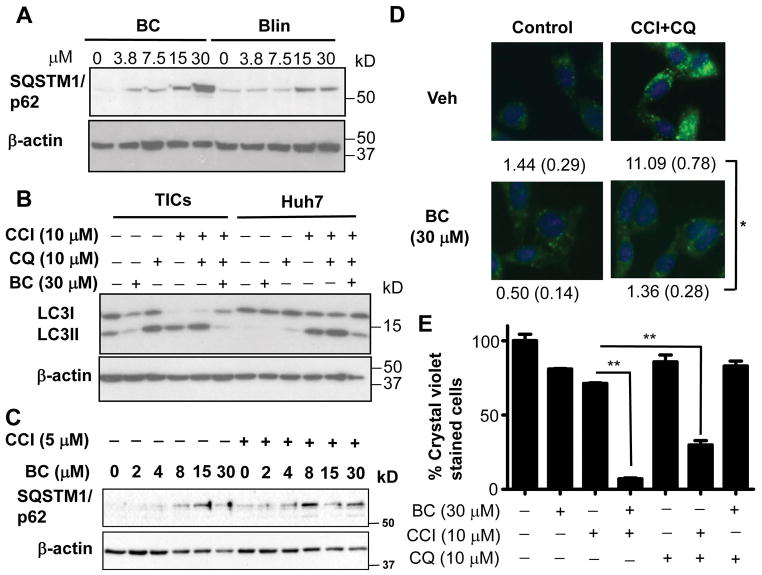
RAB1B and SAR1B are involved in the autophagosome formation (32, 33). Therefore, we hypothesized that BC may inhibit autophagy. To test this notion, we measured in BC-treated TICs, the level of p62/SQSTM1 which accumulates when autophagy is suppressed. Indeed, both YGW and BC increased p62/SQSTM1 after overnight treatment (Fig S12A). BC increased p62/SQSTM1 more robustly than Blin, correlating with their relative anticancer activities (Fig 5A). We further analyzed the effects of BC on autophagic flux. For this analysis, we used the mTOR inhibitor CCI779 (temsirolimus) to activate autophagic signal and chloroquine (CQ) to inhibit autophagic degradation by lysosomes and examined the lipidation of LC3 essential for autophagozome formation. Under basal condition in TICs, immunoblot analysis detected LC3I (unlipidated LC3) and less LC3II (lipidated LC3) and BC treatment reduced both LC3I and LC3II (Fig 5B). CQ increased LC3II as expected from its inhibitory effect on lysosomal degradation. CCl779 alone or in combination with CQ caused disappearance of LC3I and increased LC3II as the evidence of increased autophagic flux by mTOR suppression. However, BC abrogated this induction (Fig 5B, left), and this effect was also observed in Huh7 cells (Fig 5B, right), demonstrating that BC inhibits autophagosome formation. We also observed that BC increased p62/SQSTM1 even at lower concentrations when co-treated with CCI779 (Fig 5C). To confirm this finding on autophagy, we performed immunofluorescent microscopy for LC3 protein in TICs treated with BC vs. vehicle with or without CCI779 and CQ. Punctate staining pattern of LC3 was induced by CCI779 and CQ as the evidence of autophagosome formation (Fig 5D, upper right), and this induction was abrogated by BC treatment (Fig 5D, lower right). Furthermore, the cytotoxic effect of CCI779 and BC on TICs was reproduced by the treatment with CCI779 and the autophagy inhibitor, CQ (Fig 5E), supporting the notion that autophagy inhibition renders a synergistic elimination of TICs treated with CCI779. BC and CQ co-treatment showed no toxicity (Fig. 5E), supporting that both with similar autophagy inhibitory effects is not cytotoxic but either chemical renders toxicity when autophagy is induced by CCI779. Our finding is also consistent with the proposal that inhibition of autophagy is necessary for eliminating drug resistant CD133+ liver cancer cells (34).
Figure 5. Baicalein inhibits autophagy.
A) BC caused p62/SQSTM1 accumulation more robustly than Blin. B) BC inhibited autophagy flux induced by CCI779 in TICs and Huh7 cells as assessed by LC3II levels. TICs and Huh7 cells were treated with indicated compounds for 2 hr and lysates were immunoblotted with anti-LC3 antibody. C) TICs were treated with indicated concentrations of BC in the presence of CCI779 (5 μM) or control. D) BC inhibited autophagosome formation. TICs were treated with indicated compounds for 2 hr and fixed for immunocytochemistry with anti-LC3 antibody. The number of LC3 puncta in each cell were counted as indication of autophagosome formation. Averages and SEM values derived from 110 cells in triplicate chambers are shown below each figure. Scale bars represent 50 μm. E) Chloroquine (CQ) achieves similar chemosensitization with CCI779 as BC. TICs were treated in spheroid forming conditions for 7 days and replated in normal tissue culture conditions for another 5 days. The cells were stained with crystal violet and quantitated. Error bars are shown in SEM with triplicate measurements. One-way ANOVA analysis with Bonferroni post-test was performed to determine statistical significance between different experimental groups. *p<0.05 and **p<0.01.
Baicalein eliminates HCC resistance to mTORC1 inhibition
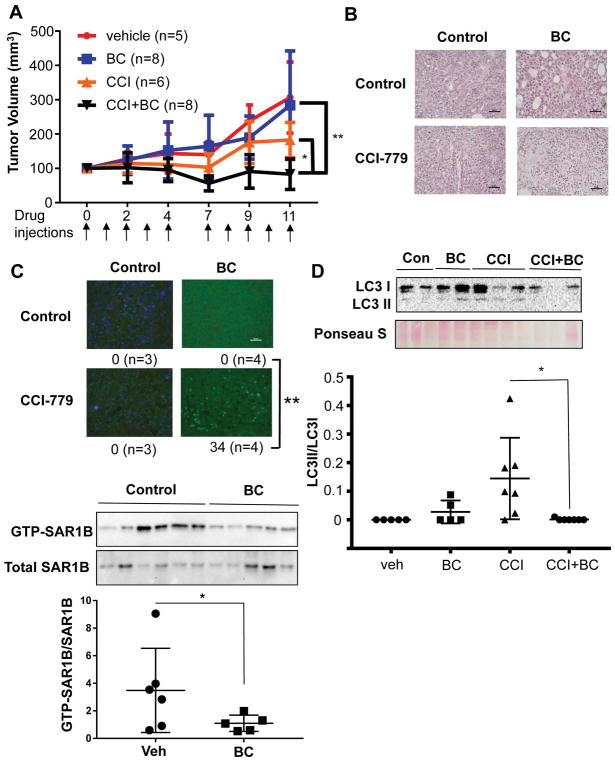
The combination effect of BC and CCI779 was also verified in an animal model, where tumor growth after TIC implantation in nude mice was completely prevented (Fig S13). To gain the translational relevance of this combination effect, we tested the combination treatment in NSGTM mice transplanted with HCC tissue resected from a NASH patient and showed a complete prevention of tumor growth by the combination treatment (Fig. 6A). This therapeutic effect was accompanied by marked induction of tumor cell death (Fig 6B and 6C). LC3II, the indicator of autophagosome formation, was also reduced in HCC of the mice with the combination treatment (Fig 6D). Similar to BC’s effects on cells, BC treated tumor tissues showed significant reduction of active SAR1B (decreased GTP-bound SAR1B over total SAR1B) as determined by immunoblotting and densitometric quantitation (Fig 6E). Collectively, these results support the notion that the combination treatment prevents HCC growth by suppressing autophagy and chemosensitizing tumor cells.
Figure 6. Baicalein eliminates CCI-779 chemoresistance in patient-derived xenograft model of hepatocellular carcinoma.
A) Mice bearing human HCC were treated with vehicle (n=5), 20 mg/kg of BC (n=8), 5 mg/kg of CCI-779 (n=6) and combination of BC and CCI. Results shown are the combination of two independent treatment experiments. Mice were treated with the drugs intraperitoneally at the indicated times shown by the arrows. Tumor size was measured by a caliper. Two-way ANOVA analysis was performed with Bonferroni post-test to determine the statistical significance. B) Representative microphotographs of tumor sections stained with H&E. Scale bars represent 50 μm. C) Representative pictures of tumor sections stained by TUNEL for apoptotic cells. Pictures were taken randomly and apoptotic cells are counted from each picture. Statistic analysis was performed using the apoptotic cell numbers from tissues sections of multiple mice. One-way ANOVA analysis was performed with Bonferroni post-test to determine the statistical significance. D) Immunoblot analysis revealed that LC3II in HCC was decreased by the combination treatment, suggesting suppressed autophagosome formation. One-way ANOVA was used to calculate statistical significance. E) Active SAR1B was pulled down using GTP-agarose from tumor tissues from PDX mice treated vehicle or BC and CCI-779. Densitometric analysis was performed and GTPSAR1B/totalSAR1B values were calculated. Student’s t-test was used to calculate statistical significance. Error bars indicate SEM of replicate measurements. **p<0.01 and *p<0.05.
BC effects are reproduced by SAR1B knockdown (KD) and rescued by SAR1B expression
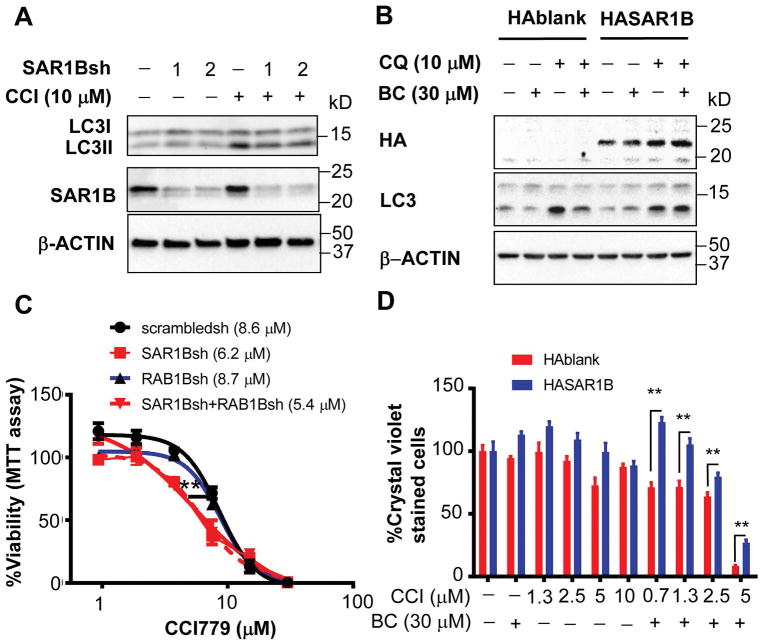
Since SAR1B is the putative target of BC and highly active in TICs, we next tested whether loss or overexpression of SAR1B affects TICs and the BC’s effects. SAR1B KD by two independent shRNAs in TICs partially prevented LC3II formation induced by CCI779 (Fig 7A), supporting the participation of SAR1B in autophagosome formation. When HA tagged SAR1B is expressed in TICs, BC inhibition of LC3II was rescued (Fig 7B), supporting that SAR1B is the BC’s target for suppressed autophagosome formation. Finally, SAR1B KD but not RAB1B KD sensitized TICs for CCI779 cytotoxicity with the IC50 value reduced 28% as compared to TICs with scrambled shRNA (Fig 7C), suggesting that loss of SAR1B phenocopies BC’s cytotoxic effect on CCI779-treated TICs. Expression of HA-SAR1B in TICs partially rescued the lethality induced by BC and CCI779 (Fig 7D), further supporting that SAR1B targeted by BC mediates TIC killing by the combination treatment. RAB1B KD suppressed CCI779-induced LC3II (Fig S14A) and RAB1 overexpression rescued BC-mediated inhibition of CCI779- induced LC3II (Fig S14B). However, overexpression of RAB1B did not rescue TIC killing by the combination treatment (Fig. S14C).
Figure 7. SAR1B expression determines drug resistance in liver cancer cells.
A) TICs infected with lentivirus expressing SAR1B shRNAs or scrambled shRNA were treated with CCI779 alone or with CQ for 2 hr and immunoblotted with anti-LC3 and anti-SAR1B antibodies. B) TICs infected with lentivirus expressing HA-SAR1B or HA-blank control were treated with CQ alone or together with BC for 2 hr and immunoblotted with indicated antibodies. C) TICs infected with lentivirus expressing SAR1B-, RAB1B- shRNAs or scrambled-shRNA were treated with an escalating concentration of CCI779 for 4 days and MTT assay was performed to measure viability. Two-way ANOVA analysis was performed with Bonferroni post-test to determine the statistical significance. Error bars indicate SEM of six replicate measurements. D) Quantification of drug resistant TICs transduced with lentiviruses expressing HASAR1B and control treated with BC, CCI779 or both at indicated concentrations as assessed by crystal violet staining and expressed as percent of control. TICs were treated in spheroid forming condition for 7 days and surviving cells were replated in normal tissue culture conditions for 5 days. Two-way ANOVA analysis was performed with Bonferroni post-test to determine the statistical significance. Error bars indicate SEM of three replicate measurements. *p<0.05 and **p<0.01.
Abundant SAR1B may protect hepatocytes from BC’s action
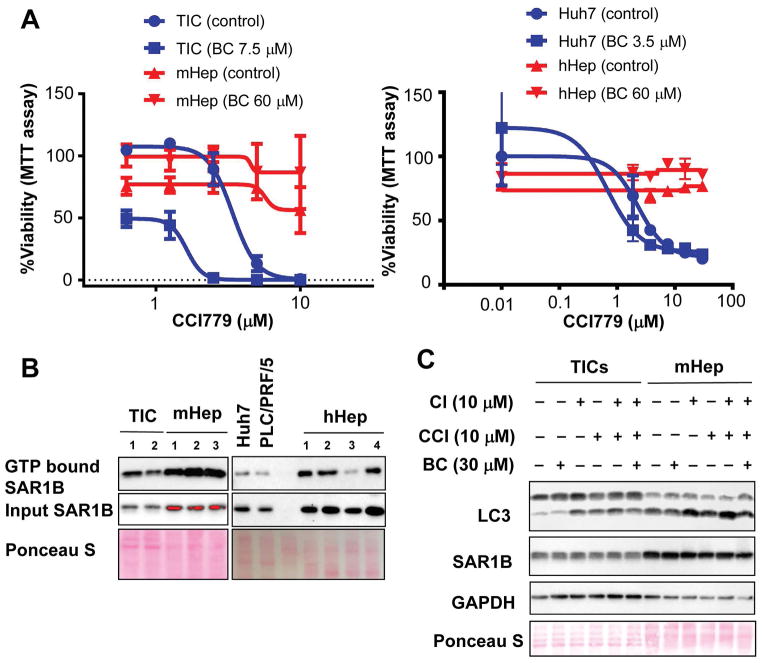
BC exerted no toxicity to normal mouse hepatocytes (Fig. 1E). Further, the combination treatment of BC (60 μM) and escalating concentration of CCI779 for 5 days rendered no cytotoxicity in cultured mouse hepatocytes (Fig. 8A, left) and human hepatocytes (Fig. 8A, right) in contrast to dose-dependent cell death in TICs and Huh7 cells as assessed by MTT assay. These results are also corroborated by Caspse 3 activation analysis (Fig. S8). To determine the role of SAR1B in sensitivity of cancer cells and hepatocytes to BC, we checked the levels of active SAR1B (GTP bound) and total SAR1B in TICs vs. mouse hepatocytes (mHep), human HCC Huh7 and PLC/PRF/5 cells vs. human hepatocytes (hHep). We found both GTP bound SAR1B and total SAR1B were higher in mHep and hHep compared to the cancer cells (Fig 8B) and these differences correlated with higher basal levels of LC3II in hepatocytes (Fig 8C). These data may just reflect higher activities of the GTPase and autophagosome formation required for functions of the differentiated cells but may also make them less sensitive to the effect of BC or BC plus CCI779 due to abundant active SAR1B.
Figure 8. Baicalein’s chemosensitization for CCI-779 is specific to cancer.
A) mTICs and freshly isolated mHep and were treated with different concentrations of CCI779 with or without 60 μM of BC for 5 days (Left). Huh7 cells or carefully thawed hHep were plated over night and treated similar to mHep (Right). MTT assay was performed to measure viability. B) Frozen pellets of mTICs, mHep, human HCC cells and hHep were lysed in GTP binding buffer with three freeze-thaw cycles and GTP bound SAR1B and total SAR1B were measured with SAR1B antibody. C) TICs and freshly isolated mHep were treated with indicated compounds for 2 hr. The cells were lysed and immunoblot analysis was performed with indicated antibodies.
Discussion
Phase III clinical trials for mTORC1 inhibitors in liver cancer have experienced limited therapeutic benefits, suggesting that the resistance to mTORC1 inhibitors may exist in HCC and a conjunctive therapy with another drug may be needed. To this end, a combination of sorafenib and mTORC1 inhibitor was evaluated for HCC in clinical trials, but showed severe toxicities (35). We hypothesized that induction of CD133 (12, 16) and autophagy (34) by mTORC1 inhibitors, might have contributed to the chemoresistance in cancer cells treated with these drugs. Indeed, our research demonstrates BC abrogates induction of both CD133 and autophagy by CCI779 and chemosensitizes TICs and HCC cells to CCI779 while having no toxicity in primary hepatocytes. This new pharmacologic feature of BC adds to liver protective properties previously shown for BC or BC-containing herbal preparation in the experimental mouse models (26, 27, 36–38). Feeding the herbal preparation with BC as an active component to mice for longer than a year causes no obvious toxicity (Fig S2) but effectively suppresses liver cancer formation (Fig S3). In a phase I clinical study, BC is found safe with no signs of liver or kidney toxicity even at the maximum dose of 2.8 g per individual (39). Therefore, BC may be considered as a safe and effective adjuvant to mTORC1 inhibition in the treatment of liver cancer. In support of this notion, the combination treatment of BC and CCI779 showed impressive killing of HCC cells and complete abrogation of HCC growth in the PDX model.
BC offers various therapeutic effects (40), but the molecular targets of BC have not been fully established. BC may affect lipoxygenase activity (41) but its molecular basis is poorly understood. Our unbiased approach of affinity-purification of BC associated proteins by nano-beads, revealed its targets. The current study is first to demonstrate that SAR1B is a putative BC target and that BC-mediated suppression of SAR1B-dependent autophagy induced by CCI779 underlies its chemosensitizing effect. In fact, SAR1B KD phenocopied the chemosensitizing effect of BC and conversely SAR1B expression rescued both inhibition of autophagy and cell death caused by BC and CCI779. We also identified RAB1 as a BC target in cell-free system. However, RAB1B overexpression rescued BC-induced inhibition of LC3II but not cell death in CCI779-treated TICs, dissociating the effects on autophagy and cytotoxicity. These differential effects may be due to a possibility that SAR1B which is a major active GTPase among several other GTPases including RAB1B in TICs, can easily compensate for loss of RAB1B. It is also highly likely that SAR1B may have additional unique functions critical for TIC or tumor cell survival that RAB1B cannot fulfill.
Selective sensitivity of TICs and HCC cells over primary hepatocytes is an intriguing finding. Our results suggest that this may be due to the different pharmacokinetic properties of TICs vs. hepatocytes: TICs converting Blin to more toxic BC more efficiently than hepatocytes and hepatocytes converting BC to less toxic Blin more efficiently (Fig. S5-F and -H). Secondly, TICs has SAR1B as a major active GTPase while hepatocytes have higher expression of SAR1B and other GTPases in the active form, making hepatocytes more resistant to BC’s antagonistic action toward SAR1B.
In summary, our study identified SAR1B GTPase as a drug resistant effector of TICs and HCC cells which can be targeted by BC to chemosensitize them to mTORC1 inhibitors via a novel combination therapy.
Supplementary Material
Acknowledgments
Financial Support: Grants from Toray Industries, Inc., Japan, NIAAA/NIH (P50AA011999 and R24AA12885), and Medical Research Service of Department of Veterans Affairs (5I01BX001991) to H.T.
The authors thank the Animal Core (Raul Lazaro), Morphology Core (Dr. Samuel French), and Administrative Core of the Southern California Research Center for ALPD and Cirrhosis (P50AA011999) and the Liver Histology Core for USC Research Center for Liver Diseases (P30DK048522) for their animal experimental, histological, and administrative services and Dr. Keigo Machida for provision of the original stock of TICs. We also thank Drs. Keane Lai and Shelali Chopra, and Moli Chen of the USC Department of Pathology for facilitating the availability of HCC tissues for the PDX model. The human hepatocytes used in this study were derived from samples collected and provided by the KUMC Department of Pharmacology, Toxicology and Therapeutics Cell Isolation Core lab and the KU Liver Center. The Cell Isolation Core lab is supported by COBRE grant number P20 GM103549 and P30 GM118247.
List of abbreviations
- TICs
CD133+ tumor initiating stem cell-like cells
- HCC
hepatocellular carcinoma
- mTOR
mammalian Target of Rapamycin
- LC3
Microtubule-associated protein 1A/1B-light chain 3
- BC
baicalein
- RAB1B
Ras-related protein 1B
- SAR1B
SAR1 gene homolog B
- Wog
wogonin
- Blin
baicalin
- TMF
trimethoxyflavone
- CCI779
temsirolimus
- CQ
chloroquine
- PDX
Patient derived xenograft
- mHep
mouse hepatocytes
- hHep
human hepatocytes
Footnotes
Potential Conflict of Interest: The authors declare no potential conflicts of interest.
References
- 1.Yamashita T, Wang XW. Cancer stem cells in the development of liver cancer. J Clin Invest. 2013;123:1911–1918. doi: 10.1172/JCI66024. [DOI] [PMC free article] [PubMed] [Google Scholar]
- 2.Ma YC, Yang JY, Yan LN. Relevant markers of cancer stem cells indicate a poor prognosis in hepatocellular carcinoma patients: a meta-analysis. Eur J Gastroenterol Hepatol. 2013;25:1007–1016. doi: 10.1097/MEG.0b013e32836019d8. [DOI] [PubMed] [Google Scholar]
- 3.Ma S, Tang KH, Chan YP, Lee TK, Kwan PS, Castilho A, Ng I, et al. miR-130b Promotes CD133(+) liver tumor-initiating cell growth and self-renewal via tumor protein 53-induced nuclear protein 1. Cell Stem Cell. 2010;7:694–707. doi: 10.1016/j.stem.2010.11.010. [DOI] [PubMed] [Google Scholar]
- 4.Machida K, Tsukamoto H, Mkrtchyan H, Duan L, Dynnyk A, Liu HM, Asahina K, et al. Toll-like receptor 4 mediates synergism between alcohol and HCV in hepatic oncogenesis involving stem cell marker Nanog. Proc Natl Acad Sci U S A. 2009;106:1548–1553. doi: 10.1073/pnas.0807390106. [DOI] [PMC free article] [PubMed] [Google Scholar]
- 5.Chen CL, Tsukamoto H, Liu JC, Kashiwabara C, Feldman D, Sher L, Dooley S, et al. Reciprocal regulation by TLR4 and TGF-β in tumor-initiating stem-like cells. J Clin Invest. 2013;123:2832–2849. doi: 10.1172/JCI65859. [DOI] [PMC free article] [PubMed] [Google Scholar] [Retracted]
- 6.Machida K, Chen CL, Liu JC, Kashiwabara C, Feldman D, French SW, Sher L, et al. Cancer stem cells generated by alcohol, diabetes, and hepatitis C virus. J Gastroenterol Hepatol. 2012;27(Suppl 2):19–22. doi: 10.1111/j.1440-1746.2011.07010.x. [DOI] [PMC free article] [PubMed] [Google Scholar]
- 7.Schlachterman A, Craft WW, Hilgenfeldt E, Mitra A, Cabrera R. Current and future treatments for hepatocellular carcinoma. World J Gastroenterol. 2015;21:8478–8491. doi: 10.3748/wjg.v21.i28.8478. [DOI] [PMC free article] [PubMed] [Google Scholar]
- 8.Llovet JM, Ricci S, Mazzaferro V, Hilgard P, Gane E, Blanc JF, de Oliveira AC, et al. Sorafenib in advanced hepatocellular carcinoma. N Engl J Med. 2008;359:378–390. doi: 10.1056/NEJMoa0708857. [DOI] [PubMed] [Google Scholar]
- 9.Cheng AL, Kang YK, Chen Z, Tsao CJ, Qin S, Kim JS, Luo R, et al. Efficacy and safety of sorafenib in patients in the Asia-Pacific region with advanced hepatocellular carcinoma: a phase III randomised, double-blind, placebo-controlled trial. Lancet Oncol. 2009;10:25–34. doi: 10.1016/S1470-2045(08)70285-7. [DOI] [PubMed] [Google Scholar]
- 10.Villanueva A, Chiang DY, Newell P, Peix J, Thung S, Alsinet C, Tovar V, et al. Pivotal role of mTOR signaling in hepatocellular carcinoma. Gastroenterology. 2008;135:1972–1983. 1983.e1971–1911. doi: 10.1053/j.gastro.2008.08.008. [DOI] [PMC free article] [PubMed] [Google Scholar]
- 11.Shaw RJ, Cantley LC. Ras, PI(3)K and mTOR signalling controls tumour cell growth. Nature. 2006;441:424–430. doi: 10.1038/nature04869. [DOI] [PubMed] [Google Scholar]
- 12.Yang Z, Zhang L, Ma A, Liu L, Li J, Gu J, Liu Y. Transient mTOR inhibition facilitates continuous growth of liver tumors by modulating the maintenance of CD133+ cell populations. PLoS One. 2011;6:e28405. doi: 10.1371/journal.pone.0028405. [DOI] [PMC free article] [PubMed] [Google Scholar]
- 13.Menon S, Yecies JL, Zhang HH, Howell JJ, Nicholatos J, Harputlugil E, Bronson RT, et al. Chronic activation of mTOR complex 1 is sufficient to cause hepatocellular carcinoma in mice. Sci Signal. 2012;5:ra24. doi: 10.1126/scisignal.2002739. [DOI] [PMC free article] [PubMed] [Google Scholar]
- 14.Zhu AX, Kudo M, Assenat E, Cattan S, Kang YK, Lim HY, Poon RT, et al. Effect of everolimus on survival in advanced hepatocellular carcinoma after failure of sorafenib: the EVOLVE-1 randomized clinical trial. JAMA. 2014;312:57–67. doi: 10.1001/jama.2014.7189. [DOI] [PubMed] [Google Scholar]
- 15.Umemura A, Park EJ, Taniguchi K, Lee JH, Shalapour S, Valasek MA, Aghajan M, et al. Liver damage, inflammation, and enhanced tumorigenesis after persistent mTORC1 inhibition. Cell Metab. 2014;20:133–144. doi: 10.1016/j.cmet.2014.05.001. [DOI] [PMC free article] [PubMed] [Google Scholar]
- 16.Matsumoto K, Arao T, Tanaka K, Kaneda H, Kudo K, Fujita Y, Tamura D, et al. mTOR signal and hypoxia-inducible factor-1 alpha regulate CD133 expression in cancer cells. Cancer Res. 2009;69:7160–7164. doi: 10.1158/0008-5472.CAN-09-1289. [DOI] [PubMed] [Google Scholar]
- 17.Galluzzi L, Pietrocola F, Bravo-San Pedro JM, Amaravadi RK, Baehrecke EH, Cecconi F, Codogno P, et al. Autophagy in malignant transformation and cancer progression. EMBO J. 2015;34:856–880. doi: 10.15252/embj.201490784. [DOI] [PMC free article] [PubMed] [Google Scholar]
- 18.Rubinsztein DC, Shpilka T, Elazar Z. Mechanisms of autophagosome biogenesis. Curr Biol. 2012;22:R29–34. doi: 10.1016/j.cub.2011.11.034. [DOI] [PubMed] [Google Scholar]
- 19.Bray K, Mathew R, Lau A, Kamphorst JJ, Fan J, Chen J, Chen HY, et al. Autophagy suppresses RIP kinase-dependent necrosis enabling survival to mTOR inhibition. PLoS One. 2012;7:e41831. doi: 10.1371/journal.pone.0041831. [DOI] [PMC free article] [PubMed] [Google Scholar]
- 20.Xie X, White EP, Mehnert JM. Coordinate autophagy and mTOR pathway inhibition enhances cell death in melanoma. PLoS One. 2013;8:e55096. doi: 10.1371/journal.pone.0055096. [DOI] [PMC free article] [PubMed] [Google Scholar]
- 21.Thomas JD, Zhang YJ, Wei YH, Cho JH, Morris LE, Wang HY, Zheng XF. Rab1A is an mTORC1 activator and a colorectal oncogene. Cancer Cell. 2014;26:754–769. doi: 10.1016/j.ccell.2014.09.008. [DOI] [PMC free article] [PubMed] [Google Scholar]
- 22.Kabe Y, Ohmori M, Shinouchi K, Tsuboi Y, Hirao S, Azuma M, Watanabe H, et al. Porphyrin accumulation in mitochondria is mediated by 2-oxoglutarate carrier. J Biol Chem. 2006;281:31729–31735. doi: 10.1074/jbc.M604729200. [DOI] [PubMed] [Google Scholar]
- 23.Feldman DE, Chen C, Punj V, Tsukamoto H, Machida K. Pluripotency factor-mediated expression of the leptin receptor (OB-R) links obesity to oncogenesis through tumor-initiating stem cells. Proc Natl Acad Sci U S A. 2012;109:829–834. doi: 10.1073/pnas.1114438109. [DOI] [PMC free article] [PubMed] [Google Scholar]
- 24.Uthaya Kumar DB, Chen CL, Liu JC, Feldman DE, Sher LS, French S, DiNorcia J, et al. TLR4 Signaling via NANOG Cooperates With STAT3 to Activate Twist1 and Promote Formation of Tumor-Initiating Stem-Like Cells in Livers of Mice. Gastroenterology. 2016;150:707–719. doi: 10.1053/j.gastro.2015.11.002. [DOI] [PMC free article] [PubMed] [Google Scholar]
- 25.Chen CL, Uthaya Kumar DB, Punj V, Xu J, Sher L, Tahara SM, Hess S, et al. NANOG Metabolically Reprograms Tumor-Initiating Stem-like Cells through Tumorigenic Changes in Oxidative Phosphorylation and Fatty Acid Metabolism. Cell Metab. 2016;23:206–219. doi: 10.1016/j.cmet.2015.12.004. [DOI] [PMC free article] [PubMed] [Google Scholar]
- 26.Yang M, Chen K, Shih JC. Yang-Gan-Wan protects mice against experimental liver damage. Am J Chin Med. 2000;28:155–162. doi: 10.1142/S0192415X00000209. [DOI] [PubMed] [Google Scholar]
- 27.Yang M, Chen K, Shih JC. Yang-gan-wan protects mice against apoptosis induced by anti-Fas antibody (Jo2) Am J Chin Med. 2000;28:325–330. doi: 10.1142/S0192415X00000386. [DOI] [PubMed] [Google Scholar]
- 28.Yang MD, Chiang YM, Higashiyama R, Asahina K, Mann DA, Mann J, Wang CC, et al. Rosmarinic acid and baicalin epigenetically derepress peroxisomal proliferator-activated receptor γ in hepatic stellate cells for their antifibrotic effect. Hepatology. 2012;55:1271–1281. doi: 10.1002/hep.24792. [DOI] [PMC free article] [PubMed] [Google Scholar]
- 29.Chou TC. Drug combination studies and their synergy quantification using the Chou-Talalay method. Cancer Res. 2010;70:440–446. doi: 10.1158/0008-5472.CAN-09-1947. [DOI] [PubMed] [Google Scholar]
- 30.Gavriljuk K, Gazdag EM, Itzen A, Kötting C, Goody RS, Gerwert K. Catalytic mechanism of a mammalian Rab·RabGAP complex in atomic detail. Proc Natl Acad Sci U S A. 2012;109:21348–21353. doi: 10.1073/pnas.1214431110. [DOI] [PMC free article] [PubMed] [Google Scholar]
- 31.Huang M, Weissman JT, Beraud-Dufour S, Luan P, Wang C, Chen W, Aridor M, et al. Crystal structure of Sar1-GDP at 1. 7 A resolution and the role of the NH2 terminus in ER export. J Cell Biol. 2001;155:937–948. doi: 10.1083/jcb.200106039. [DOI] [PMC free article] [PubMed] [Google Scholar]
- 32.Ao X, Zou L, Wu Y. Regulation of autophagy by the Rab GTPase network. Cell Death Differ. 2014;21:348–358. doi: 10.1038/cdd.2013.187. [DOI] [PMC free article] [PubMed] [Google Scholar]
- 33.Zoppino FC, Militello RD, Slavin I, Alvarez C, Colombo MI. Autophagosome formation depends on the small GTPase Rab1 and functional ER exit sites. Traffic. 2010;11:1246–1261. doi: 10.1111/j.1600-0854.2010.01086.x. [DOI] [PubMed] [Google Scholar]
- 34.Chen H, Luo Z, Dong L, Tan Y, Yang J, Feng G, Wu M, et al. CD133/prominin-1-mediated autophagy and glucose uptake beneficial for hepatoma cell survival. PLoS One. 2013;8:e56878. doi: 10.1371/journal.pone.0056878. [DOI] [PMC free article] [PubMed] [Google Scholar]
- 35.Koeberle D, Dufour JF, Demeter G, Li Q, Ribi K, Samaras P, Saletti P, et al. Sorafenib with or without everolimus in patients with advanced hepatocellular carcinoma (HCC): a randomized multicenter, multinational phase II trial (SAKK 77/08 and SASL 29) Ann Oncol. 2016;27:856–861. doi: 10.1093/annonc/mdw054. [DOI] [PubMed] [Google Scholar]
- 36.Hwang JM, Tseng TH, Tsai YY, Lee HJ, Chou FP, Wang CJ, Chu CY. Protective effects of baicalein on tert-butyl hydroperoxide-induced hepatic toxicity in rat hepatocytes. J Biomed Sci. 2005;12:389–397. doi: 10.1007/s11373-005-1572-8. [DOI] [PubMed] [Google Scholar]
- 37.Wu YL, Lian LH, Wan Y, Nan JX. Baicalein inhibits nuclear factor-κB and apoptosis via c-FLIP and MAPK in D-GalN/LPS induced acute liver failure in murine models. Chem Biol Interact. 2010;188:526–534. doi: 10.1016/j.cbi.2010.09.008. [DOI] [PubMed] [Google Scholar]
- 38.Huang HL, Wang YJ, Zhang QY, Liu B, Wang FY, Li JJ, Zhu RZ. Hepatoprotective effects of baicalein against CCl4-induced acute liver injury in mice. World J Gastroenterol. 2012;18:6605–6613. doi: 10.3748/wjg.v18.i45.6605. [DOI] [PMC free article] [PubMed] [Google Scholar]
- 39.Li M, Shi A, Pang H, Xue W, Li Y, Cao G, Yan B, et al. Safety, tolerability, and pharmacokinetics of a single ascending dose of baicalein chewable tablets in healthy subjects. J Ethnopharmacol. 2014;156:210–215. doi: 10.1016/j.jep.2014.08.031. [DOI] [PubMed] [Google Scholar]
- 40.Li-Weber M. New therapeutic aspects of flavones: the anticancer properties of Scutellaria and its main active constituents Wogonin, Baicalein and Baicalin. Cancer Treat Rev. 2009;35:57–68. doi: 10.1016/j.ctrv.2008.09.005. [DOI] [PubMed] [Google Scholar]
- 41.Sekiya K, Okuda H. Selective inhibition of platelet lipoxygenase by baicalein. Biochem Biophys Res Commun. 1982;105:1090–1095. doi: 10.1016/0006-291x(82)91081-6. [DOI] [PubMed] [Google Scholar]
Associated Data
This section collects any data citations, data availability statements, or supplementary materials included in this article.


