

Abstract
Background
Cancer cachexia occurs in approximately 80% of cancer patients and is a key contributor to cancer‐related death. The mechanisms controlling development of tumour‐induced muscle wasting are not fully elucidated. Specifically, the progression and development of cancer cachexia are underexplored. Therefore, we examined skeletal muscle protein turnover throughout the development of cancer cachexia in tumour‐bearing mice.
Methods
Lewis lung carcinoma (LLC) was injected into the hind flank of C57BL6/J mice at 8 weeks age with tumour allowed to develop for 1, 2, 3, or 4 weeks and compared with PBS injected control. Muscle size was measured by cross‐sectional area analysis of haematoxylin and eosin stained tibialis anterior muscle. 2H2O was used to assess protein synthesis throughout the development of cancer cachexia. Immunoblot and RT‐qPCR were used to measure regulators of protein turnover. TUNEL staining was utilized to measure apoptotic nuclei. LLC conditioned media (LCM) treatment of C2C12 myotubes was used to analyse cancer cachexia in vitro.
Results
Muscle cross‐sectional area decreased ~40% 4 weeks following tumour implantation. Myogenic signalling was suppressed in tumour‐bearing mice as soon as 1 week following tumour implantation, including lower mRNA contents of Pax7, MyoD, CyclinD1, and Myogenin, when compared with control animals. AchRδ and AchRε mRNA contents were down‐regulated by ~50% 3 weeks following tumour implantation. Mixed fractional synthesis rate protein synthesis was ~40% lower in 4 week tumour‐bearing mice when compared with PBS controls. Protein ubiquitination was elevated by ~50% 4 weeks after tumour implantation. Moreover, there was an increase in autophagy machinery after 4 weeks of tumour growth. Finally, ERK and p38 MAPK phosphorylations were fourfold and threefold greater than control muscle 4 weeks following tumour implantation, respectively. Inhibition of p38 MAPK, but not ERK MAPK, in vitro partially rescued LCM‐induced loss of myotube diameter.
Conclusions
Our findings work towards understanding the pathophysiological signalling in skeletal muscle in the initial development of cancer cachexia. Shortly following the onset of the tumour‐bearing state alterations in myogenic regulatory factors are apparent, suggesting early onset alterations in the capacity for myogenic induction. Cancer cachexia presents with a combination of a loss of protein synthesis and increased markers of protein breakdown, specifically in the ubiquitin‐proteasome system. Also, p38 MAPK may be a potential therapeutic target to combat cancer cachexia via a p38‐FOX01‐atrogene‐ubiquitin‐proteasome mechanism.
Keywords: Protein synthesis, LLC, Ubiquitin, MAPK, ERK, p38
Introduction
Cancer is one of the leading causes of death worldwide with over half of the people affected by cancer dying as a result of the condition.1, 2 Cancer cachexia is a wasting syndrome that occurs in approximately 80% of cancer patients.3, 4, 5 In fact, cancer cachexia is the primary cause of death for 20–40% of cancer deaths.3, 4, 5 Cancer cachexia is defined as a multifactorial syndrome that displays an ongoing loss of skeletal muscle mass (with or without loss of fat mass) that cannot be fully reversed by conventional nutritional support and leads to progressive functional impairment.3, 5 As efforts to reverse cancer cachexia have been largely unsuccessful, recent suggestions in the literature have emphasized needs to focus on prevention of the condition.6 However, few efforts have been placed towards understanding the early stage development of cancer cachexia. We recently demonstrated that multiple measures of muscle mitochondrial health are impaired well before onset of measurable muscle wasting in cancer cachexia in Lewis lung carcinoma (LLC) tumour‐bearing mice beginning with increased mitochondrial ROS emission, followed by network degeneration and eventual decrements in respiratory function using this same time course model.7 Those data suggest early onset derangements in muscle health. However, skeletal muscle atrophy occurs primarily by an imbalance of protein turnover favouring protein degradation over protein synthesis.8, 9 Therefore, a critical need remains to define alteration of muscle protein turnover processes in the initial development of cancer cachexia induced muscle wasting.
From prior literature, it is clear that cancer cachexia is associated with decreased rates of muscle protein synthesis and increased rates of protein degradation.10, 11, 12, 13 We also know that protein turnover is regulated by a series of anabolic processes including myogenesis and protein synthesis10, 11, 12, 13, 14, 15, 16, 17, 18, 19, 20, 21, 22 and catabolic processes including the ubiquitin‐proteasome system, autophagy, and apoptosis.8, 13, 23, 24, 25, 26, 27, 28 Each of these processes may present significant dysregulation during cancer cachexia; however, the nature by which this negative protein balance initially develops in cancer cachexia remains largely unknown. The initial development of cancer‐induced muscle wasting is understudied in scientific literature despite the need to consider measures to prevent the condition. To this point, other prior studies have examined progression of cancer cachexia;15, 29 although in most cases, focus is placed on varying degrees of cachexia rather than the initial onset of muscle loss. In fact, a prior study by White et al.15 previously demonstrated a clear and progressive reduction in protein synthesis and induction of protein ubiquitination with worsening of cachexia. However, in their work, efforts were focused on progression through worsening cachexia and did not examine protein turnover and other anabolic/catabolic processes in the pre‐wasting state as compared with healthy control. Therefore, the purpose of this study was to examine regulation of protein turnover in skeletal muscle throughout a time course progression of cancer cachexia in tumour‐bearing mice. By examining a comprehensive measurement of protein turnover regulation throughout the progression of cancer cachexia, we provide key information about the pathogenesis of this condition. In doing so, we identified that the onset of negative protein balance and muscle wasting is met with the induction of MAPK systems. Therefore, to determine the potential of targeting MAPKs in preventive efforts to cachectic wasting, we used LLC conditioned media (LCM) to mimic cancer cachexia in vitro, combined with inhibitors specific to p38 and MEK (upstream of ERK MAPK).30, 31 The data presented herein present novel insight to the onset of the negative protein balance in cancer cachexia and provide evidence for potential therapeutic targets to prevent cancer‐induced muscle wasting.
Materials and Methods
Animals and interventions
Animal experiments were performed at the University of Arkansas, Fayetteville. All procedures were approved by the Institutional Animal Care and Use Committee of the University of Arkansas. We have previously reported on several aspects regarding body and tissue masses and mitochondrial health in these same animals.7
Tumour implantation and tissue collection
Male C57BL/6J mice were purchased from Jackson Laboratories (Bar Harbor, ME USA). The mice were kept on a 12:12 h light–dark cycle with ad libitum access to normal rodent chow and water; 1×10⁶ LLC cells suspended in sterile PBS were implanted subcutaneously to the hind flank of mice at 8 weeks of age.7 The tumour was allowed to develop for 1, 2, 3 or 4 weeks as previously described.7 For control, a cohort of animals was given an injection of equal volume sterile PBS at 8 weeks of age and then age‐matched to 4 week tumour‐bearing mice at time of harvest (12 weeks of age). Animals were not fasted at time of tissue collection. To allow measure of protein synthesis, a bolus of deuterium oxide (~20 μL/g body weight) was injected intraperitoneally in the mouse approximately 24 h before tissue collection. Drinking water was thereafter supplemented with deuterium oxide (4% deuterium oxide drinking water) in order to maintain the plasma pool of deuterium oxide.32, 33, 34 Animal tissues were quickly collected under isoflurane anaesthesia prior to euthanasia. Tissues were quickly weighed, enrichment time noted, and snap‐frozen in liquid nitrogen for further processing and stored at −80°C.
Histology
Tibialis anterior (TA) muscles were imbedded in optimal cutting temperature compound and frozen for sectioning. Sections were cut at 10 μm using a Leica CM1859 cryostat (Leica Biosystems, Buffalo Grove, IL, USA) and stained with haematoxylin and eosin for cross‐sectional area analysis. Muscle fibres were circled using Nikon Basic Research Imaging Software (Melville, NY, USA). Roche Diagnostics (Indianapolis, IN, USA) In Situ Cell Death Detection Fluorescein (11684795910) was used to detect damaged DNA. Manufacturer's protocols were used. Slides were mounted with fluorescent mounting media with DAPI (ProLong Gold antifade reagent with DAPI, Invitrogen P36931). Nikon Ti‐S inverted epiflourescent microscope with LED‐based light source was used to image total nuclei (DAPI) and TUNEL + nuclei (FITC). Total nuclei and TUNEL + nuclei were then counted using Nikon Basic Research Imaging Software.
24 h protein synthesis in vivo
A detailed description of this method for measuring protein synthesis has previously been published35; 15 and 35 mg of gastrocnemius muscle were powdered and homogenized in a 10% TCA solution for mixed and myofibrillar FSR, respectively. In order to isolate the myofibrillar fraction, homogenate was centrifuged at 600× g for 15 min. The supernatant containing cytosolic proteins was then discarded. Mixed and myofibrillar fractions were then washed three times with 10% TCA solution by centrifugation to eliminate cytosolic amino acids. Proteins were placed in 6 M HCL at 100°C hydrolyze proteins into amino acids. An aliquot of the hydrolysate was dried down and derivatized with a 3:2:1 v/v solution of methyl‐8, methanol, and acetonitrile to determine 2H‐labelling of alanine on its methyl‐8 derivative. The solution was then placed in a GC–MS capillary column (Agilent 7890A GC HP‐5 ms capillary column) and positioned in the GC–MS; 1 μL of solution was ran on the Agilent GC–MS at an 80:1 split. GC–MS settings have previously been described.33, 35 A ratio of deuterated alanine over alanine was employed to assess protein synthesis.
The precursory pool of 2H2O in the plasma was reacted with 10 M NaOH and a 5% solution of acetone in acetonitrile for 24 h in order to conjugate the free 2H2O to acetone. The solution was extracted by adding Na2SO4 and chloroform and placed in capillary columns to be analysed on the GC–MS to detect acetone at an 80:1 split.
FSR of mixed and myofibrillar proteins were calculated using the equation EA × [EBW × 3.7 × t (h)] − 1 × 100, where EA represents amount of protein‐bound [2H] alanine (mole% excess), EBW is the quantity of 2H2O in body water (mole% excess), 3.7 represents the exchange of 2H between body water and alanine (3.7 of 4 carbon‐bound hydrogens of alanine exchange with water) and t (h) represents the time the label was present in hours.
RNA isolation, cDNA synthesis, and quantitative real‐time PCR
Adult gastrocnemius muscles were collected and frozen in liquid nitrogen at time of harvest; 20–30 μg of powdered gastrocnemius muscle was homogenized into a 1 mL TRIZOL solution, and RNA was isolated using a commercially available kit (Ambion and Life Technologies). Isolated RNA purity and concentration was confirmed using Bio‐Tek (Winooski, VT, USA) Power Wave XS plate reader with Take3 microvolume plate and Gen5 software. After which, 1 μg of RNA was reverse transcribed into cDNA using previously described methods and Vilo SuperScript (11755050, Invitrogen, Carlsbad, CA, USA) reagents cDNA was diluted to 1:100 (10 ng/μL) and Ct values analysed using TaqMan reagents and commercial Step‐One real‐time RT‐PCR instrumentation (Applied BioSystems, Foster City, CA, USA). Assessment of 18 s (Mm03928990_g1), Pax7 (Mm01354484_m1), MyoD (Mm00440387_m1), MyoG (Mm00446194_m1) Atrogin1 (Mm00499523_m1), MuRF1 (Mm01185221_m1), and Cyclin D1 (Mm00432359_m1) were performed using TaqMan probes (Life Technologies) and corresponding TaqMan reagents. No differences were seen in 18 s among experimental conditions for experiments presented. Final quantification of gene expression was calculated using the ΔΔCT method. Relative quantification was calculated as 2−ΔΔCT.
Immunoblotting
Gastrocnemius muscle was homogenized in a buffer containing 0.23 M Tris–HCL, pH 6.8, 4.5% w/v SDS, 45% glycerol, 0.04% w/v Bromophenol Blue, 80 mM dithiothreitol, 0.57 mM 2‐mercaptoethanol, complete, mini protease inhibitor cocktail (Roche, Indianapolis, IN, USA), and phosphatase inhibitor cocktails (Sigma‐Aldrich, St. Louis, MO USA) and denatured at 95°C. Concentrations were determined using the RC/DC assay (500–0119, BioRad, https://www.google.com/search?biw=1536&bih=770&q=Hercules+California&stick=H4sIAAAAAAAAAOPgE-LSz9U3MC4wzDVPUeIAsQsrCwu1tLKTrfTzi9IT8zKrEksy8_NQOFYZqYkphaWJRSWpRcUALCJywkQAAAA&sa=X&ved=0ahUKEwjkyM3TtqDMAhVjr4MKHewYAhQQmxMIkgEoATAT, USA), and 40 μg total protein was resolved by SDS‐PAGE, transferred to a PVDF membrane, and blocked in 3% w/v bovine serum albumin in Tris‐buffered saline with 0.2% Tween 20 (TBST). Membranes were probed overnight for primary antibodies specific to p‐AKT (Cell Signaling 9271, S 473), AKT (Cell Signaling 9272), Deptor (EMD Millipore, ABS222), p‐4EBP1 (Cell Signaling 9451 S 65), 4EBP1 (Cell Signaling 9452), p‐p70s6k (Cell Signaling 9205, T 389), p70s6k (Cell Signaling 9202), p‐FOXO1 (Cell Signaling 9464, T24), FOXO1 (Cell Signaling 2880), p‐FOXO3 (Cell Signaling 9464, T32), FOXO3 (Cell Signaling 2497), p‐FOXO4 (Cell Signaling 9471, S 197), FOXO4 (Cell Signaling 9472), Ubiquitin (Cell Signaling 3933), Beclin1 (Cell Signaling 3738), p62 (Sigma p0067), LC3 (Cell Signaling 4108), Caspase 3 (Cell Signaling 9662), ERK 1/2 MAPK (Cell Signaling 4695), p‐ERK 1/2 MAPK (Cell Signaling 4370, T 202/Y204), p‐p38 MAPK (Cell Signaling 9211, T 180/182), p38 MAPK (Cell Signaling 9212), p‐MAPK APK (Cell Signaling 3316S, T 222), and MAPK APK (Cell Signaling (3042S) isolated from rabbit and mouse. Antibodies were diluted in TBST with 5% milk. LiCor secondary antibodies conjugated with HRP (animal experiments) or Infared (IR) Dye (cell culture experiments) were used according to manufacturer's protocols. For animal experiments, membranes were imaged on Protein Simple FluorChem (Minneapolis, MN, USA) with LiCor WesternSure Premium Chemiluminescent substrate (926‐95000) and analysed using Alpha View software. For cell culture experiments, membranes were imaged on LiCor Odyssey FC using IR detection. All bands were normalized to the 45 kDa actin band of Ponceau S stain as a loading control.
Cell culture experiments
C2C12 myoblasts were plated at 50 000 cells per well of a six‐well cell culture plate with 2 mL DMEM (11965092, Life Technologies, Carlsbad, CA, USA) supplemented with 20% fetal bovine serum (26140079, Life Technologies) and 1% pen/strep (15140122, Life Technologies) as per previous work by us36, 37 and others.38 Cell proliferation and differentiation were performed as previously described,36, 37 briefly, at confluence media were switched to DMEM supplemented with 2% horse serum, 1% P/S, 50% HEPES, 0.75% transferrin, and 0.75% insulin for 5 days. Myoblasts were plated for experiments at passage 6.
Lewis lung carcinoma conditioned media treatment
In order to collect LLC conditioned media (LCM), LLC cells were grown to 100% confluence as previously described.7, 39 LLC cells were then incubated in DMEM supplemented with 10% fetal bovine serum and 1% pen/strep for 18 h. The media were then collected and filtered. LLC conditioned media were then diluted to 25% total volume in serum free media. For the control group, 25% total volume of 10% fetal bovine serum growth media was diluted in serum free media. C2C12 myotubes were then treated with either control or LCM for 24 h. This method was adapted from Puppa et al.16 and Guohua et al.31 Dilution of conditioned media should reduce effects of nutrient deprivation following the incubation period. Notably, recent works show that both conditioned media and co‐culture with tumour cells (C26) induce myotube atrophy,40 and thus, effects described herein are believed to be due to tumour‐derived factors rather than nutrient deprivation.
Inhibition of p38 and ERK 1/2 MAPKs
To examine the roles of p38 MAPK and ERK 1/2 MAPK in the loss of myotube diameter on the myotubes treated with control or LCM, differentiated C2C12 myotubes were treated with PD098059 (20 μM; PHZ1164, Life Technologies) (MEK1/2 inhibitor preventing ERK 1/2 activity) or SB202190 (20 μM; S7067, Sigma Aldrich) (inhibitor of p38 MAP kinase) for the entire duration of control or LCM treatment. These concentrations of inhibitors have been previously published by Brown et al.36
C2C12 myotube protein and RNA collection
After LCM and drug treatment experiments, myotubes were collected for immunoblot and RNA isolation by applying 100 μL of 2× protein sample buffer or 1 mL of TRIZOL, respectively. Subsequent steps were performed as described earlier.
Myotube diameter analysis
Myotube diameter analysis was performed as previously published.36, 37 Briefly, C2C12 myoblasts proliferated until 80–100% confluency. The myoblasts were differentiated for 120 h. Myotubes were then placed in control or LCM, and appropriate drug treatments were added. Myotubes were imaged with a 40× objective with 10 images per well and 3–4 myotubes examined per well. Five lines were drawn across the diameter of each myotube in order to measure the average diameter of the myotube. This was performed on every myotube imaged in the experimental conditions. Researcher was blinded for this analysis. A second researcher then repeated experiments with images acquired using a 10× objective and measurements as described earlier. All cell culture experiments were conducted in triplicate and repeated in order to ensure data accuracy.
SuNSET protein synthesis
Protein synthesis in tissue culture was measured using the SuNSET protocol41, 42 as we have previously published.37 Briefly, 1 μM puromycin dihydrochloride (Calbiochem, Darmstadt, Germany) was added to cell culture media and incubated 30 min prior to protein extraction. Immunoblotting protocols were followed as described earlier using 1:20 000 dilution of mouse anti‐puromycin IgG 2a antibody (EMD Millipore, Darmstadt, Germany) followed by 1:20 000 dilution of HRP conjugated anti‐mouse IgG fragment specific 2a antibody (Jackson ImmunoResearch Labs, West Grove, PA, USA). The entire lane was assessed for optical density, and this was normalized to optical density of the entire lane of Ponceau S stain. This was used as a relative measure of the amount of actively translated proteins in the polysome prior to harvest of cells.
Statistical analysis
For animal experiments, independent factors were PBS and number of weeks tumour progressed. A one‐way ANOVA was employed as the global analysis for each dependent variable. For cell culture experiments, independent factors included media (con or LCM) and drug treatment (vehicle or SB202190/PD98059 as appropriate to experiment). These independent factors were divided into two separate cell culture experiments herein referred to as LCM p38 inhibitor and LCM ERK 1/2 inhibitor. Data in each separate cell culture experiment were analysed by two‐way ANOVA with factors of media (Con vs. LCM) and pharmacological inhibition (Vehicle vs. SB202190 or PD98059). Where significant F‐ratios were found, differences among means were determined by Student Newman–Keuls post hoc test for both the animal and cell culture experiments. For all experiments, the comparison‐wise error rate, α, was set at 0.05 for all statistical tests. All data were analysed using the Statistical Analysis System (SAS, version 9.3, Cary, NC, USA); figures were compiled using GraphPad Prism (La Jolla, CA, USA) and data expressed as mean ± SEM.
Results
Characterization of the progression of Lewis lung carcinoma‐induced cancer cachexia
We have previously reported phenotypic characteristics of these same mice including body and tissue masses.7 Most importantly, muscle wet weights were ~15–20% lower 4 weeks following tumour implantation when compared with PBS control mice.7 Here, we report that mean CSA of TA muscle fibres was ~15% smaller 3 weeks following tumour implantation and ~40% smaller by 4 weeks of tumour growth compared with PBS control mice (Figure 1B). Furthermore, there were a larger number of small fibres (200–600 μM2 area) and a smaller number of large fibres (>1400 μM2) when comparing 4 weeks of tumour burden to PBS control mice (Figure 1C).
Figure 1.
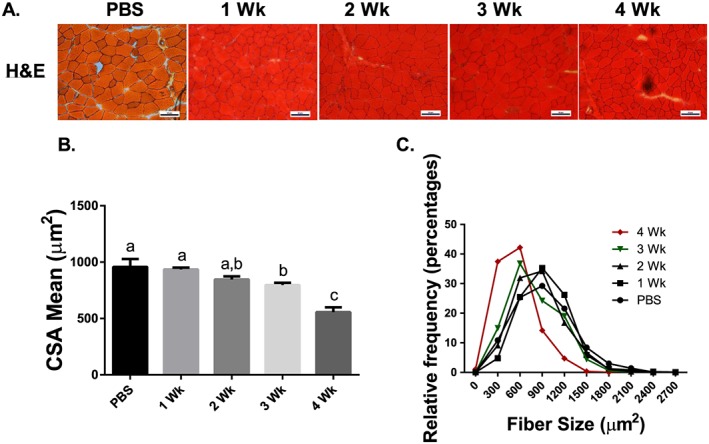
Cross‐sectional area throughout the progression of cancer cachexia. (A) Haematoxylin and eosin staining sample images (scale 50 μM). (B) Mean CSA of TA muscle fibres throughout the progression of cancer cachexia. (C) Histogram of fibre sizes throughout the progression of cancer cachexia. N of 7–8 was utilized for each group. Lettering denotes statistical significance (means that do not share the same letter are statistically different) at an alpha set at P < 0.05.
Extrinsic regulators of skeletal muscle mass are impaired throughout the development of cachexia
To determine the impacts of the tumour‐bearing state on anabolic functions in the muscle, we assessed aspects of myogenesis and protein synthesis. Briefly, myogenesis is the formation of muscular tissue, which is necessary for repair of injured muscle. Satellite cells are labelled with Pax7.43 Upon activation, satellite cells express MyoD and subsequently Myogenin, which are responsible for proliferation and differentiation of satellite cells, respectively.21, 22 There is evidence that myogenic dysregulation may promote cancer‐induced muscle wasting.20 From these assessments, we observed that Pax7 mRNA content was ~35% lower 1 week following tumour implantation when compared with PBS control mice and did not recover throughout the progression of cancer cachexia (Figure 2A). MyoD mRNA content was ~50% lower in both 1 and 2 week tumour‐bearing groups when compared with PBS control mice (Figure 2A). mRNA content of MyoD recovered 3 weeks following tumour implantation. In tumour‐bearing mice, CyclinD1 mRNA content was ~45% lower than PBS control mice in all tumour‐bearing groups (Figure 2A). Myogenin mRNA was ~50% lower than PBS control mice 1 week following tumour implantation but recovered by 3 and 4 weeks following tumour implantation (Figure 2A). Finally, we assessed mRNA content of putative markers of muscle denervation. We observed that while mRNA of acetylcholine receptor (AchR) α, Gad45A, RUNX1, and MusA were not significantly altered (Supporting Information, Figure S1). AchR δ and AchR ε were down‐regulated by ~35 and 45% 2 and 3 weeks following tumour implantation, respectively (Supporting Information, Figure S1).
Figure 2.
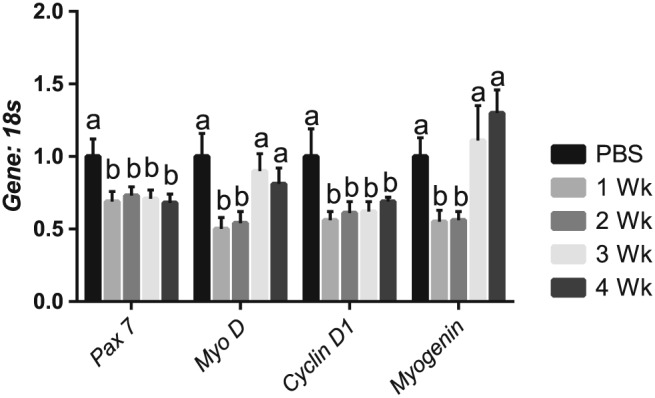
Satellite cell and myogenic markers are impaired throughout the development of cachexia. (A) Pax 7 mRNA content throughout the progression of cancer cachexia. MyoD mRNA content throughout the progression of cancer cachexia. CyclinD1 content throughout the progression of cancer cachexia. MyoG content throughout the progression of cancer cachexia. N of 7–8 was utilized for each group. Lettering denotes statistical significance (means that do not share the same letter are statistically different) at an alpha set at P < 0.05.
Mixed protein synthetic rate is lower in cachectic muscle
Next, in our assessment of anabolic function, we determined 24 h FSR and assessed mTOR signalling components. Mixed muscle FSR was ~40% lower than the PBS control group 4 weeks following tumour implantation with no other significant differences among experimental conditions (Figure 3A). In contrast, there was no significant change in myofibillar FSR during the progression of cancer cachexia (Figure 3B); however, there was a mean decrease in the 3 and 4 week groups when compared with PBS (P = 0.3). To examine mTOR‐related signalling, we assessed the upstream marker Akt, mTOR complex component and negative regulator of mTOR–Deptor, and downstream mTOR targets p70S6K1 and 4EBP‐1.17, 18, 44 We observed that content and phosphorylation of Akt, p70s6k, and 4EBP1 did not change throughout the progression of cancer cachexia (Figure 3C). However, Deptor protein content was ~40% greater 3 weeks following tumour implantation when compared with other experimental groups (Figure 3C).
Figure 3.
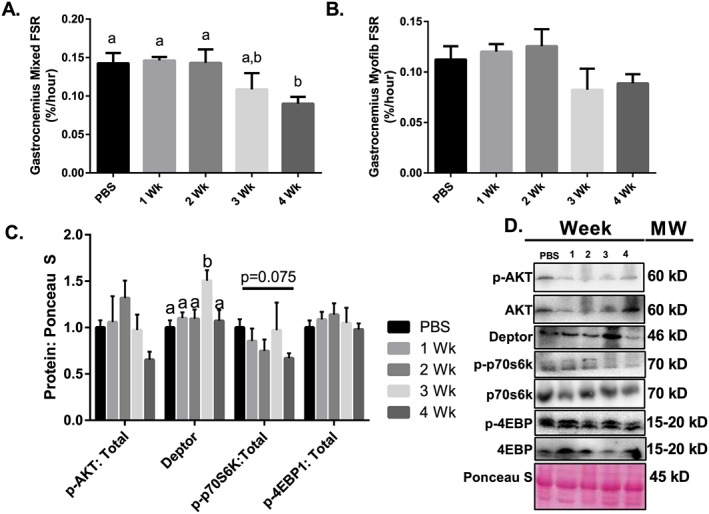
Protein synthesis throughout the progression of cancer cachexia. (A) Mixed FSR throughout the progression of cancer cachexia. (B) Myofibrilar FSR throughout the progression of cancer cachexia. (C) AKT phosphorylation relative to total protein content. Deptor protein content throughout the progression or cancer cachexia. 4EBP1 phosphorylation relative to total protein content. p70s6k phosphorylation relative to total protein content. (D) Sample images for immunoblot analysis. N of 7–8 was utilized for each group. Lettering denotes statistical significance (means that do not share the same letter are statistically different) at an alpha set at P < 0.05.
Protein breakdown is up‐regulated in cachectic muscle
To investigate the contributions of putative catabolic processes, we assessed markers of the ubiquitin‐proteasome system, autophagy, and apoptosis. With regard to the ubiquitin‐proteasome system, FOXO1 and FOXO3 signalling are important regulators of the atrogenes: Atrogin1 and MuRF1.23 These are important E3 ligases known to promote skeletal muscle wasting.23 Muscle protein ubiquitination was ~50% higher than PBS control mice 4 weeks following tumour implantation (Figure 4A). We observed that total FOXO1 protein content was ~50% greater than PBS control mice 4 weeks following tumour implantation (Figure 4A). Phosphorylation status of FOXO3T32 and FOXO4T28 did not change as tumour growth progressed; however, there was a non‐significant mean decrease in relative FOXO1T24 phosphorylation (Figure 4A). Furthermore, Atrogin1 mRNA content was threefold greater than PBS control mice 4 weeks after tumour implantation (Figure 4B), while MuRF1 mRNA content was twofold and fourfold greater than PBS control mice at 3 and 4 weeks following tumour implantation (Figure 4B), respectively.
Figure 4.
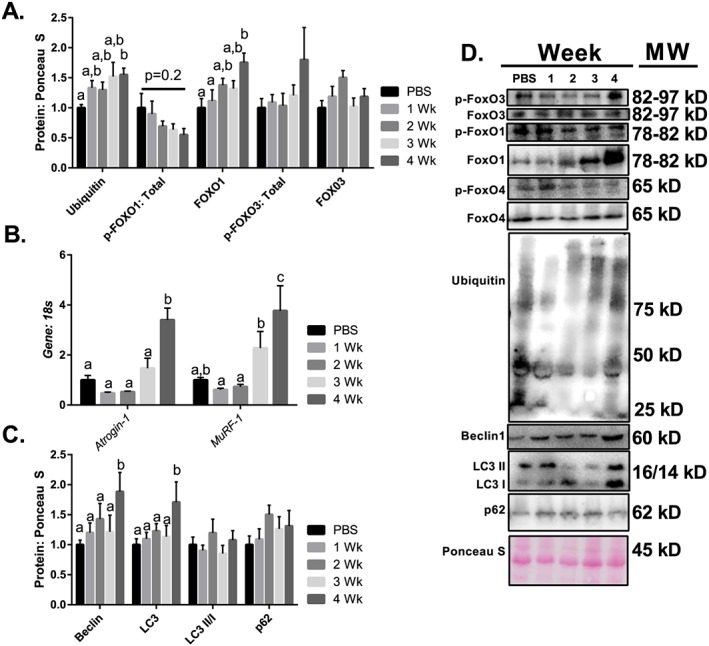
Protein breakdown throughout the progression of cancer cachexia. (A) Protein ubiquitination throughout the progression of cancer cachexia. FOXO1 protein content throughout the progression of cancer cachexia. Phosphorylation of FOXO1 relative to total protein content throughout the progression of cancer cachexia. (B) Atrogin1 mRNA content throughout the progression of cancer cachexia. (B) MuRF1 mRNA content throughout the progression of cancer cachexia. (C) Beclin1 protein content throughout the progression of cancer cachexia. (C) Total LC3 protein content throughout the progression of cancer cachexia. (C) LC3 II/I ratio throughout the progression of cancer cachexia. (C) p62 protein content throughout the progression of cancer cachexia. (D) Representative immunoblot images. N of 7–8 was utilized for each group. Lettering denotes statistical significance (means that do not share the same letter are statistically different) at an alpha set at P < 0.05.
To provide insight into the potential contributions of autophagy, a process involved in the formation of an autophagosome in order to facilitate lysosomal clearance of proteins and organelles,26, 27, 28 we examined upstream regulator Beclin1, as well as LC3 (involved in the closing of the autophagosome) and p62 (a linker protein between the autophagosome and cargo that is degraded by the lysosome upon completion of autophagy). Beclin1 protein content was ~80% greater than PBS control mice 4 weeks post‐tumour implantation (Figure 4C). Furthermore, total LC3 protein content was ~60% higher than PBS control mice after 4 weeks of tumour growth (Figure 4C). By contrast, there was no difference in the LC3 II:I ratio throughout the progression of cancer cachexia (Figure 4C) nor in protein content of p62 (Figure 4C).
Apoptosis is not altered in progression of Lewis lung carcinoma‐induced cancer cachexia
To examine apoptosis in cachectic muscle, we used TUNEL staining and Caspase 3 protein content. Loss of myonuclei may limit the muscles' ability to increase in size. There was no significant difference in the number of TUNEL positive nuclei throughout the progression of cancer cachexia (Figure 5A). Moreover, total Caspase 3 was not different between the PBS, 1, 2, 3, and 4 week groups (Figure 5B) while Cleaved Caspase 3 (active form) was not detectable by immunoblot.
Figure 5.
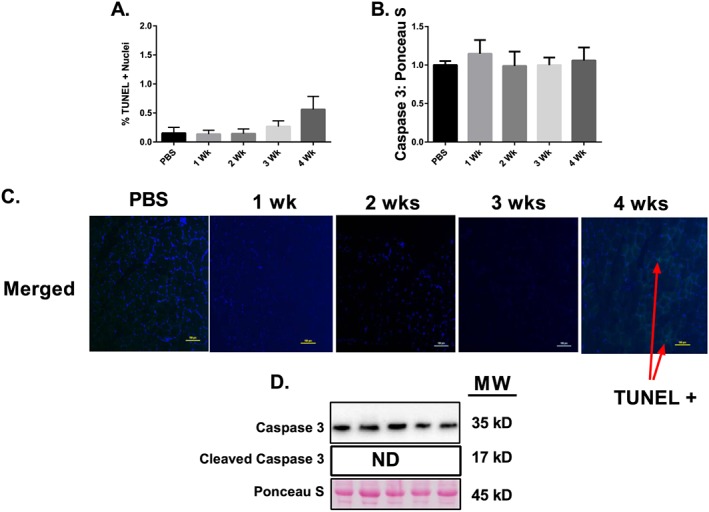
Apoptosis throughout the progression of cancer cachexia. (A) Percent TUNEL + Nuclei throughout the progression of cancer cachexia. (B) Total caspase 3 protein content throughout the progression of cancer cachexia. (C) Sample images for the TUNEL assay including a positive control image. (D) Representative immunoblot images. N of 7–8 per group was utilized. Lettering denotes statistical significance (means that do not share the same letter are statistically different) at an alpha set at P < 0.05.
MAPK phosphorylation is induced in tumour‐bearing mice
MAPKs are key controllers of both anabolic and catabolic signalling within skeletal muscle45, 46; therefore, in order to assess MAPKs in cachectic muscle, we examined p38 and ERK phosphorylation status. ERKT202/Y204 and p38T180/Y182 MAPK phosphorylations relative to respective total protein contents were fourfold and threefold greater than PBS control mice 4 weeks following tumour implantation, respectively (Figure 6A/B).
Figure 6.
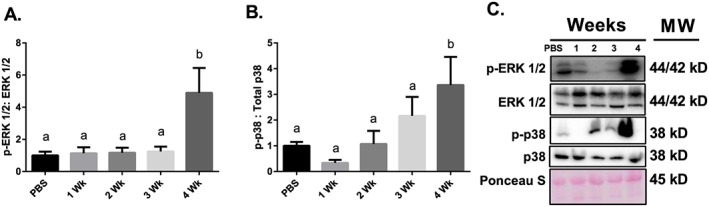
MAPK signalling throughout the progression of cancer cachexia. (A) ERK MAPK phosphorylation relative to total protein content. (B) p38 MAPK phosphorylation relative to total protein content. (C) Representative immunoblot images. N of 7–8 per group was utilized. Lettering denotes statistical significance (means that do not share the same letter are statistically different) at an alpha set at P < 0.05.
ERK 1/2 inhibition does not protect against Lewis lung carcinoma conditioned media‐mediated loss of myotube diameter despite promoting protein synthesis
Considering that induction of MAPK phosphorylation occurs concurrent with the development of muscle wasting in the current study and the induction of a negative protein balance, we elected to examine MAPKs role in the development of cancer cachexia in vitro. To do so, we used LCM treatment of C2C12 myotubes to mimic cancer cachexia and appropriate selective MAPK inhibitors for each experiment. First, to test whether ERK MAPK inhibition could protect against LCM‐induced myotube atrophy, myotubes were concurrently treated with PD98059. In these experiments, diameter of myotubes treated with LCM was ~35% lower than the diameter of myotubes treated with control media and was not affected by the addition of PD98059 (Figure 7A). LCM loss of myotube diameter was similar to the loss of muscle mass observed in vivo (40% loss in CSA in vivo, 35% loss in myotube diameter in vitro). Phosphorylated ERK relative to total ERK was ~50% lower in groups containing PD98059 when compared with the Control Media + Vehicle group (Figure 7B). Also, ERK phosphorylation in LCM + Vehicle was ~50% lower than Control + Vehicle (Figure 7B). Puromycin incorporation was threefold and twofold greater in Control + PD98059 and LCM + PD98059, respectively, when compared with Control + Vehicle (Figure 7C). Protein ubiquitination in LCM‐treated conditions were ~40% greater than control media (Figure 7D). Protein content of p‐4EBP1, 4EBP1, Deptor, p‐FOXO3, FOXO3, p‐FOXO1, and FOXO1 was not different between all groups (Figure 7E). Atrogin‐1 and MuRF‐1 mRNA content was ~25 and 35% lower in LCM + Vehicle when compared with Control + Vehicle, respectively (Figure 7F).
Figure 7.
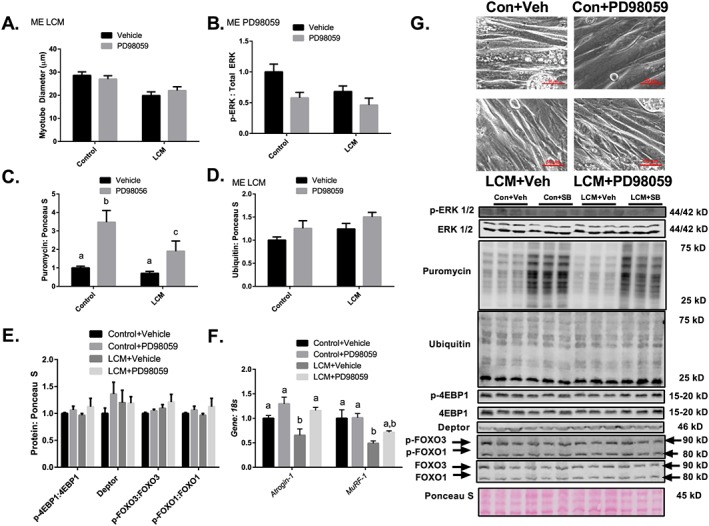
Inhibition of ERK–MAPK does not protect against LCM mediated loss of myotube diameter despite promoting protein synthesis. (A) Myotube diameter analysis of Control Media + Vehicle, Control Media + PD98059, LCM + Vehicle, and LCM + PD98059. (B) ERK MAPK phosphorylation relative to total protein content following 18 h of Control Media + Vehicle, Control Media + PD98059, LCM + Vehicle, and LCM + PD98059 treatment. (C) Puromycin incorporation for groups Control Media + Vehicle, Control Media + PD98059, LCM + Vehicle, and LCM + PD98059 after 30 min puromycin treatment following 18 h of treatments. (D) Protein ubiquitination following 18 h of Control Media + Vehicle, Control Media + PD98059, LCM + Vehicle, and LCM + PD98059 treatment. (E) Protein content of p‐4EBP1 relative to total 4EBP1, Deptor, p‐FOXO3 relative to total FOXO3, and p‐FOXO1 content relative to total FOXO1 following 18 h of Control Media + Vehicle, Control Media + PD98059, LCM + Vehicle, and LCM + PD98059 treatment. (F) Atrogin‐1 and MuRF‐1 mRNA content following 18 h of Control Media + Vehicle, Control Media + PD98059, LCM + Vehicle, and LCM + PD98059 treatment. All measured in C2C12 myotubes and normalized to and Ponceau S. Data are mean ± SEM. (G) Representative micrograph and immunoblot images for each protein of interest taken in order from same membrane. N of 6 was utilized for each group. Lettering denotes statistical significance (means that do not share the same letter are statistically different) at an alpha set at P < 0.05. ME indicates statistical Main Effect of indicated factor(s).
Inhibition of p38 MAPK partially protects against Lewis lung carcinoma conditioned media‐mediated loss of myotube diameter
Myotube diameter of cells treated with LCM + Vehicle was ~45% smaller than cells treated with control media, while myotube diameter of cells treated with LCM + SB202190 was ~25% smaller than myotubes treated with control media and ~20% greater when compared with myotube diameter of cells treated with LCM + Vehicle (Figure 8A). LCM loss of myotube diameter was similar to the loss of muscle CSA observed in vivo. Relative phosphorylation of MAPKAPK‐2, a direct target of p38 MAPK, was ~40 and 50% in Control + SB202190 and LCM + SB202190 when compared with control vehicle, respectively (Figure 8B). Puromycin incorporation was ~twofold greater in myotubes treated with SB202190 when compared with myotubes treated with vehicle, regardless of LCM treatment (Figure 8C). Protein ubiquitination was ~twofold greater in LCM + Vehicle when compared with all other groups (Figure 8D). Protein content of p‐4EBP1, 4EBP1, Deptor, p‐FOXO3, and FOXO3 was not different between all groups; however, protein content of p‐FOXO1 relative to total FOXO1 was significantly elevated in LCM + Vehicle when compared with all other groups (Figure 8E). Atrogin‐1 mRNA was ~45% greater than control media groups using LCM + Vehicle treatment and ~60% lower than control media groups using LCM + SB202190 treatment (Figure 8F). MuRF‐1 mRNA was ~70% lower in groups containing SB202190 when compared with vehicle treatment (Figure 8F).
Figure 8.
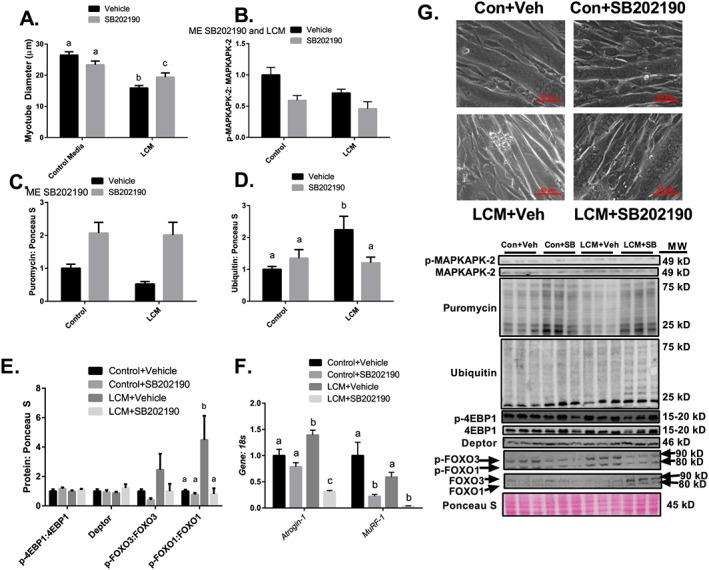
Inhibition of p38 MAPK partially protects against LCM‐mediated loss of myotube diameter. (A) Myotube diameter analysis of Control Media + Vehicle, Control Media + SB202190, LCM + Vehicle, and LCM + SB202190. (B) MAPKAPK‐2 phosphorylation relative to total protein content following 18 h of treatments. (C) Puromycin incorporated for groups Control Media + Vehicle, Control Media + SB202190, LCM + Vehicle, and LCM + SB202190 after 30 min puromycin treatment following 18 h of treatments. (D) Protein content of ubiquitin following 18 h of Control Media + Vehicle, Control Media + SB202190, LCM + Vehicle, or LCM + SB202190 treatment. (E) Protein content of p‐4EBP1 relative to total 4EBP1, Deptor, p‐FOXO3 relative to total FOXO3, and p‐FOXO1 content relative to total FOXO1 following 18 h of Control Media + Vehicle, Control Media + SB202190, LCM + Vehicle, or LCM + SB202190 treatment. (F) Atrogin‐1 and MuRF‐1 mRNA content following 18 h of Control Media + Vehicle, Control Media + SB202190, LCM + Vehicle, or LCM + SB202190 treatment. All measured in C2C12 myotubes and normalized to and Ponceau S. Data are mean ± SEM. (G) Representative micrographs and immunoblot images for each protein of interest taken in order from same membrane. N of 6 was utilized for each group. Lettering denotes statistical significance (means that do not share the same letter are statistically different) at an alpha set at P < 0.05. ME indicates statistical Main Effect of indicated factor(s).
Discussion
Loss of muscle mass occurs largely from an imbalance of protein turnover favouring protein degradation,47 which is commonly observed in late stage cancer cachexia10, 11, 48; however, we are the first to measure modalities of protein turnover throughout a time course of the initial development of LLC‐induced cancer cachexia. In this same cohort of animals, we recently demonstrated that impaired mitochondrial health develops well prior to onset of muscle wasting.7 Those data thus suggest impaired myocellular health prior to measurable muscle wasting. Here, we have shown alterations in cellular programing necessary for the maintenance of muscle mass as soon as 1 week following tumour implantation with impaired signalling for satellite cell proliferation and myogenesis. Interestingly, through additional assessments of muscle protein synthesis and degradative pathways including autophagy, ubiquitin‐proteasome system, and apoptosis, it appears primary decrements contributing to the negative protein balance occur via activation of the ubiquitin‐proteasome system and reduced mixed muscle protein synthesis that develop concurrent to the onset of phenotypic muscle wasting (by muscle mass). Furthermore, upstream signalling suggests this may be mediated via activation of MAPK signalling cascades. In fact, in vitro inhibition of p38 MAPK blunted myotube atrophy in response to LCM. The search for efficacious treatments for cancer‐induced muscle wasting is ongoing as many attempted therapeutic modalities have yielded minimal effect.49 The data presented in this study provide a comprehensive overview of machinery responsible for the maintenance of muscle mass throughout the development of cancer cachexia in tumour‐bearing mice.
Cross‐sectional area is altered in tumour‐bearing mice
In the current study, cachectic muscle mass loss developed at 4 weeks post tumour implantation,7 which is commonly observed in this model.7, 16, 39, 50 At 4 weeks, these mice display a degree of muscle mass loss (~15% smaller muscle wet weights7 and a ~40% decrease in mean CSA) that would be considered a negative prognosis clinically and greatly increase mortality among cancer patients. We do note that CSA was reduced ~15% at 3 weeks post‐tumour implantation despite a lack of measurable change in total muscle mass. However, the reductions in total muscle mass are smaller than many prior reports and without significant loss in tumour free body mass suggesting that 4 week tumour‐bearing mice displayed mild/moderate cachexia.
Extrinsic regulation of skeletal muscle mass
In cancer cachexia, the sarcolemma becomes damaged due to factors secreted by the tumour, which elicits a repair response.19 Our data indicate Pax7 mRNA, a satellite cell marker, content decreased as soon as 1 week following tumour implantation, implying the satellite cell pool may be diminished thus impairing regenerative capacity shortly after the onset of the tumour‐bearing state.51 Intriguingly, these results appear to contradict findings from He et al.20 in which an increase in Pax7 protein content was noted in response to tumour burden in both C26 and LLC models of cancer cachexia. These contradictions may be due to methodology differences to measure Pax7 expression. It is possible that reduced Pax7 mRNA here coupled with increased Pax7 protein previously reported20 indicates altered turnover of Pax7 and accumulation of dysfunctional satellite cells, at current though this speculation requires further testing to resolve. Moreover, our data show that MyoD (important for satellite cell proliferation22), MyoG (important for satellite cell differentiation22), and Cyclin D1 mRNA contents are decreased 1 week following tumour implantation. This dysregulation of MyoD and MyoG mRNA expression corroborates recent findings outlining impaired myogenesis in response to tumour burden in mice.20 These data strongly suggest a defect in myogenic regulation that develops shortly following onset of the tumour‐bearing condition and thus an early development in this anabolic process. Interestingly, in our prior measures of mitochondrial degeneration the primary defect therein at this early timepoint was an enhanced mitochondrial ROS emission.7 These combined data suggest in the early tumour‐bearing state initial defects in myogenic regulation and mitochondrial ROS emission, although at this time it is too early to state if these alterations are impacting one another. The currently assessed aberrant myogenic signalling suggests a potential limit on muscle regrowth potential that develops shortly after onset of the tumour‐bearing state. Prior findings have suggested that satellite cell proliferation is not necessary for muscle regrowth52, 53; however, most of these findings are in conditions where myonuclei may not be compromised. We have seen here that in this earlier state of cancer cachexia, apoptosis is not heavily induced, this observation is likely tied to attempts to preserve myonuclei in conditions where the satellite cell pool is compromised that may then limit muscle regrowth potential following loss of myonuclei. This effect may then limit efficacy of therapies aimed to reverse cachexia post‐cancer treatment, thereby suggesting a need to determine mechanisms impairing myogenic potential in early tumour‐bearing states to prevent/reverse this effect.
Interestingly, we observed a rebound in the contents of the myogenic regulatory factors MyoD and myogenin at 3 and 4 weeks post‐tumour implantation. We cannot be certain as to the mechanism for this; however, these specific myogenic regulatory factors have previously been demonstrated to be elevated during denervation.54, 55, 56 Therefore, we assessed a panel of denervation markers. To that end, we have demonstrated that AchR δ and ε are down‐regulated in cachectic muscle; however, at this point, we cannot conclude that functional denervation is occurring. In fact, AChR density is often higher than needed for efficient capture of the acetylcholine released at the neuromuscular junction57; therefore, based on current data, functional denervation is not likely occurring at this stage in the development of cancer cachexia. Therefore, the mechanism for the rebound effect in MyoD and myogenin remains elusive. However, we should caution that further studies into more severe cachectic states may be necessary to determine impacts on functional denervation.
Mixed muscle protein synthesis is reduced concurrent to onset of muscle wasting in tumour‐bearing mice
In cancer cachexia literature, there is an ongoing debate as to whether a decrease in protein synthesis, up‐regulated protein degradation, or both play a greater role in the onset of cancer‐induced muscle wasting.58 There appear to be discrepancies based on both the type of model used and the methodology for measuring protein synthesis.16, 48, 58, 59, 60 Our protein synthesis data showed a decrease in the mixed muscle fraction with no significant change in the myofibrillar fraction (despite a ~25% mean decrease in FSR) measured over a 24 h time period. These results corroborate studies such as Toledo et al.59 that describes a ~50% reduction in mixed protein synthesis in the gastrocnemius muscle in LLC tumour‐bearing mice. We are the first to measure protein synthesis in LLC tumour‐bearing mice utilizing deuterium oxide for a 24 h time period, a validated measurement of protein synthesis.32 Typically in cancer cachexia literature protein synthetic rates have been examined in shorter time periods.16, 48, 58, 59, 60, 61 Our approach may provide a specific advantage in the ability to assess protein synthetic function over the course of a full light/dark cycle and thus a potentially more accurate reflection of protein synthetic rates. In regard to myofibrillar protein synthesis, we should note that most reports measuring muscle protein synthesis in a cachectic phenotype utilize conditions with more severe wasting and concomitant greater losses in muscle and total body masses than this study.15, 16, 59, 62 It is likely that development of a more severe phenotype would alter protein synthetic signalling and induce a more severe loss of myofibrillar FSR comparable with other studies. These data suggest that decrements in mixed‐muscle protein synthesis are a significant contributor to muscle wasting in LLC tumour‐bearing mice.
Induction of skeletal muscle protein degradation systems in tumour‐bearing mice
Our data indicate that there is increased protein breakdown 4 weeks after tumour implantation. We note up‐regulation of E3 ligases Atrogin1 and MuRF1 4 weeks following tumour implantation with concomitantly significantly increased protein ubiquitination. This increase in the ubiquitin‐proteasome system likely occurs through enhanced FOXO1 content, which is responsible for promoting the expression of atrogenes such as Atrogin1 and MuRF1.63, 64, 65
Autophagy is another key controller of protein breakdown.26, 27, 28 Our data indicate an increase in Beclin1 and LC3 protein content 4 weeks following tumour‐implantation. Based on current data, it appears that basal rates of autophagy are not significantly affected (lack of change in LC3II:I ratio and p62 content) in the cachectic state; however, autophagy machinery (Beclin1 and LC3) appears to be up‐regulated suggesting greater capacity for protein degradation through this system in cachectic muscle. Finally, as discussed earlier in relation to the regulation of myonuclei, we observed no significant induction of apoptosis in the muscle of cachectic mice, suggesting that at this stage of mild/moderate cachectic wasting, apoptosis is not a primary contributor to muscle catabolism. However, we cannot, based on our data, rule out that apoptosis may play a more prominent role in muscle losses as the degree of cachexia becomes more severe. In that situation, the concomitant impairments in myogenic regulation we have observed may become more critical in muscle regrowth and recovery.
Therefore, in our assessments of muscle anabolic and catabolic functions in tumour‐bearing mice, we observe early onset decrements to myogenic signalling, followed by reduced mixed muscle protein synthesis, increased ubiquitin‐proteasome function, and an up‐regulation of autophagy machinery. Prior studies of protein turnover with progression of cancer cachexia have largely focused on the worsening of the cachectic state itself.15 In those works, it is apparent that negative protein balance becomes further exacerbated with the overall condition in greater decrements of protein synthesis and inductions of catabolic systems. Combined with present findings, we now see that negative protein balance (reduced synthesis and enhanced breakdown) occurs concomitant with the onset of muscle loss regardless of body mass losses. Loss of protein synthesis and the promotion of protein breakdown occur concomitantly with the onset of cancer‐mediated muscle loss.
MAPK signalling is altered in tumour‐bearing mice
To identify potential signalling mechanisms leading to impaired protein anabolism and enhanced protein breakdown, we next examined MAPK signalling in tumour‐bearing mice. Our data show that both ERK and p38 MAPK phosphorylations increase by fourfold and threefold, respectively, concurrent with the negative protein balance observed in this study. Prior literature shows that an increased phosphorylation, and corresponding activation, of these MAPKs can lead to both impaired muscle regeneration and increased protein breakdown.45, 46, 66, 67, 68, 69, 70 In order to examine MAPKs role in promoting cancer cachexia, we subsequently elected to use LLC‐conditioned media, a well‐established model to mimic tumour‐mediated muscle wasting in vitro.30, 31 We observed a partial rescue of tumour‐mediated loss of myotube diameter by inhibiting p38 MAPK, with no effect of ERK MAPK on LCM‐induced myotube atrophy. Long‐term (~18 h) p38 inhibition appeared to prevent tumour‐derived catabolism (protected against LCM‐induced protein ubiquitination and up‐regulation of Atrogin1) and promoted protein synthesis. Of note, long‐term inhibition of both p38 and ERK MAPK stimulated protein synthesis in vitro regardless of LCM treatment. However, it is interesting to note that while ERK MAPK inhibition promoted protein synthesis, it did not protect against LCM‐induced atrophy suggesting that p38 MAPK's inhibition of protein ubiquitination and atrogenes (likely independent of FOXO regulation) was likely a key to protect from LCM‐induced atrophy. We do note as a limitation in the current experiment that we were unable to detect induction of p38 and ERK MAPK phophorylations in vitro. We should note, however, that prior similar experiments have observed induced p38 and ERK MAPK phosphorylation following 72 h LCM treatment30 suggesting that detection of these inductions may require a longer time period of exposure, and thus, we expect here that timing of our assessments may have prevented us from being able to measure induced activation of these MAPKs. The authors find it interesting to note that 72 h course of exposure to LCM30 compared with the 24 h exposure here may be necessary to detect induction of p38 and ERK phosphorylations with the LCM model is consistent with our in vivo evidence in which these alterations are not apparent until later in the development of LLC‐induced muscle atrophy. While at this point, we cannot determine whether inhibition of MAPK protects adult skeletal muscle from tumour‐mediated wasting in vivo; these data provide a promising potential mechanism for the onset of cachectic muscle wasting via p38 MAPK phosphorylation. In fact, recent evidence suggests that p38 MAPK blockade, or deletion of the p38β isoform in skeletal muscle, blocks Activin A induced catabolic signalling and completely protects against Activin A‐induced myotube atrophy.68 Interestingly, efforts to more directly test effects of proteasomal inhibition have led to mixed results with some protection in muscle atrophy by specific targeting of MuRF171 and no protection seen with the proteasome inhibitor Bortezomib,72 while growth hormone secretagogues attenuate both induction of MuRF1 and muscle wasting.73 These data suggest the effects of p38 MAPK inhibition are likely at least in part due to protection against MuRF1‐ubiquitin‐proteasome induction. Overall, protection against catabolic functions, as performed here via p38 MAPK blockade, and in other studies through other means may be a key to attenuation of cancer‐induced muscle wasting.71, 74, 75 Combined with prior findings it now appears that p38 MAPK signalling may be a key regulator of cancer‐induced muscle wasting. Additionally, more research is needed to elucidate the underlying mechanisms responsible for the observed stimulation of protein synthesis via long‐term MAPK inhibition. Our current data both in vivo and in vitro are suggestive of the importance of the catabolic p38‐FOX01‐atrogene‐ubiquitin proteasome axis in the development of cancer‐induced muscle wasting. New studies should aim to determine if inhibition of p38 MAPK in vivo may alleviate cancer‐induced muscle wasting.
Summary and conclusions
In this study, we have analysed muscle size, myogenesis, protein turnover, and apoptosis throughout the progression of cancer cachexia. Based on our data, loss of mixed protein synthetic rates along with increased protein breakdown via the ubiquitin‐proteasome system are likely the major contributors for the onset of cancer‐induced muscle wasting in LLC tumour‐bearing mice that develop at the onset of muscle wasting. Furthermore, there appear to be early alterations in myogenic signalling potentially contributing to the irreversibility of cancer cachexia. Aberrant p38 MAPK signalling is a likely major contributing factor in the onset of LLC‐induced cancer cachexia as p38 MAPK phosphorylation is induced concomitant to developments of negative protein balance and muscle loss in tumour‐bearing mice and p38 MAPK inhibition partially protected against LCM‐induced myotube atrophy in vitro. The search for efficacious therapeutic strategies in cancer cachexia and other wasting disorders continues, while strategies to target various functional aspects within the muscle have had some effect,76, 77 it appears that the inhibition of catabolic systems may be a key to preservation of mass. Therefore, future research should continue to examine the potential of targeting p38 MAPK and the anti‐catabolic effects therein in cancer cachexia induced muscle wasting. These data provide novel information for the mechanisms contributing to muscle atrophy and potential insight for development of therapies to prevent and treat cancer cachexia.
Conflict of interest
All authors declare no conflicts of interest.
Funding
Support for LLC experiments has been provided in part by the Arkansas Biosciences Institute, the major research component of the Arkansas Tobacco Settlement Proceeds Act of 2000, and National Institutes of Health under Award Number R15AR069913 from the National Institute of Arthritis And Musculoskeletal And Skin Diseases and the National Institute of General Medical Sciences. Contents of this publication are solely the responsibility of the authors and do not necessarily represent the official views of the ABI, NIGMS, or NIH.
Supporting information
Figure S1. Denervation markers throughout the progression of cancer‐cachexia. A. AchR α mRNA content throughout the progression of cancer‐cachexia. B. AchR δ mRNA content throughout the progression of cancer‐cachexia. C. AchR ε mRNA content throughout the progression of cancer‐cachexia. D. Gad45A mRNA content throughout the progression of cancer‐cachexia. E. Runx1 mRNA content throughout the progression of cancer‐cachexia. F. Mus A mRNA content throughout the progression of cancer‐cachexia. N of 7‐8 was utilized for each group. Lettering denotes statistical significance at an alpha set at p<0.05.
Acknowledgements
The authors would like to thank Drs. Sami Dridi, Elizabeth Greene, and Jeffrey Wolchok (U. Arkansas), as well as Mr. Connor Benson (UT Tyler), Ms. Lisa Jansen, Ms. Haley McCarver, and Mrs. Katie Stephenson‐Brown for their contributions to the experiments presented here and editing. We would like to thank the Cell and Molecular Biology program at the University of Arkansas, Fayetteville, for supporting Jacob L. Brown's graduate education. We would also like to extend our gratitude to the numerous other faculty, staff and students of the Exercise Science Research Center at the University of Arkansas. The authors certify that they comply with the ethical guidelines for publishing in the Journal of Cachexia, Sarcopenia and Muscle.78
Brown, J. L. , Lee, D. E. , Rosa‐Caldwell, M. E. , Brown, L. A. , Perry, R. A. , Haynie, W. S. , Huseman, K. , Sataranatarajan, K. , Van Remmen, H. , Washington, T. A. , Wiggs, M. P. , and Greene, N. P. (2018) Protein imbalance in the development of skeletal muscle wasting in tumour‐bearing mice. Journal of Cachexia, Sarcopenia and Muscle, 9: 987–1002. 10.1002/jcsm.12354.
Contributor Information
Michael P. Wiggs, Email: mwiggs@uttyler.edu
Nicholas P. Greene, Email: npgreene@uark.edu
References
- 1. Ferlay J, Soerjomataram I, Dikshit R, Eser S, Mathers C, Rebelo M, et al. Cancer incidence and mortality worldwide: sources, methods and major patterns in GLOBOCAN 2012. Int J Cancer 2015;136:E359–E386. [DOI] [PubMed] [Google Scholar]
- 2. Fitzmaurice C, Dicker D, Pain A, Hamavid H, Moradi‐Lakeh M, MacIntyre MF, et al. The Global Burden of Cancer 2013. JAMA Oncol 2015;1:505–527. [DOI] [PMC free article] [PubMed] [Google Scholar]
- 3. Fearon Kenneth CH, Glass David J, Guttridge DC. Cancer cachexia: mediators, signaling, and metabolic pathways. Cell Metab 2012;16:153–166. [DOI] [PubMed] [Google Scholar]
- 4. Onesti JK, Guttridge DC. Inflammation based regulation of cancer cachexia. Biomed Res Int 2014;2014:168407. [DOI] [PMC free article] [PubMed] [Google Scholar]
- 5. Fearon K, Strasser F, Anker SD, Bosaeus I, Bruera E, Fainsinger RL, et al. Definition and classification of cancer cachexia: an international consensus. Lancet Oncol 2011;12:489–495. [DOI] [PubMed] [Google Scholar]
- 6. Fearon K. Cachexia: treat wasting illness on multiple fronts. Nature 2016;529:156. [DOI] [PubMed] [Google Scholar]
- 7. Brown JL, Rosa‐Caldwell ME, Lee DE, Blackwell TA, Brown LA, Perry RA, et al. Mitochondrial degeneration precedes the development of muscle atrophy in progression of cancer cachexia in tumour‐bearing mice. J Cachexia Sarcopenia Muscle 2017;8:926–938. [DOI] [PMC free article] [PubMed] [Google Scholar]
- 8. Narsale AA, Puppa MJ, Hardee JP, VanderVeen BN, Enos RT, Murphy EA, et al. Short‐term pyrrolidine dithiocarbamate administration attenuates cachexia‐induced alterations to muscle and liver in ApcMin/+ mice. Oncotarget 2016;7:59482–59502. [DOI] [PMC free article] [PubMed] [Google Scholar]
- 9. Oliveira AG, Gomes‐Marcondes MC. Metformin treatment modulates the tumour‐induced wasting effects in muscle protein metabolism minimising the cachexia in tumour‐bearing rats. BMC Cancer 2016;16:418. [DOI] [PMC free article] [PubMed] [Google Scholar]
- 10. Suzuki H, Asakawa A, Amitani H, Nakamura N, Inui A. Cancer cachexia—pathophysiology and management. JGH Open 2013;48:574–594. [DOI] [PMC free article] [PubMed] [Google Scholar]
- 11. Miyamoto Y, Hanna DL, Zhang W, Baba H, Lenz HJ. Molecular pathways: cachexia signaling—a targeted approach to cancer treatment. Clin Cancer Res 2016;22:3999–4004. [DOI] [PMC free article] [PubMed] [Google Scholar]
- 12. Tisdale MJ. The ubiquitin‐proteasome pathway as a therapeutic target for muscle wasting. J Support Oncol 2005;3:209–217. [PubMed] [Google Scholar]
- 13. Aversa Z, Pin F, Lucia S, Penna F, Verzaro R, Fazi M, et al. Autophagy is induced in the skeletal muscle of cachectic cancer patients. Sci Rep 2016;6:30340. [DOI] [PMC free article] [PubMed] [Google Scholar]
- 14. White JP, Puppa MJ, Gao S, Sato S, Welle SL, Carson JA. Muscle mTORC1 suppression by IL‐6 during cancer cachexia: a role for AMPK. Am J Physiol Endocrinol Metab 2013;304:E1042–E1052. [DOI] [PMC free article] [PubMed] [Google Scholar]
- 15. White JP, Baynes JW, Welle SL, Kostek MC, Matesic LE, Sato S, et al. The regulation of skeletal muscle protein turnover during the progression of cancer cachexia in the Apc (Min/+) mouse. PloS one. 2011;6:e24650. [DOI] [PMC free article] [PubMed] [Google Scholar]
- 16. Puppa MJ, Gao S, Narsale AA, Carson JA. Skeletal muscle glycoprotein 130's role in Lewis lung carcinoma‐induced cachexia. FASEB J 2014;28:998–1009. [DOI] [PMC free article] [PubMed] [Google Scholar]
- 17. Gingras AC, Raught B, Gygi SP, Niedzwiecka A, Miron M, Burley SK, et al. Hierarchical phosphorylation of the translation inhibitor 4E‐BP1. Genes Dev 2001;15:2852–2864. [DOI] [PMC free article] [PubMed] [Google Scholar]
- 18. Burnett PE, Barrow RK, Cohen NA, Snyder SH, Sabatini DM. RAFT1 phosphorylation of the translational regulators p70 S6 kinase and 4E‐BP1. Proc Natl Acad Sci U S A 1998;95:1432–1437. [DOI] [PMC free article] [PubMed] [Google Scholar]
- 19. Penna F, Costamagna D, Fanzani A, Bonelli G, Baccino FM, Costelli P. Muscle wasting and impaired myogenesis in tumor bearing mice are prevented by ERK inhibition. PloS one. 2010;5:e13604. [DOI] [PMC free article] [PubMed] [Google Scholar]
- 20. He WA, Berardi E, Cardillo VM, Acharyya S, Aulino P, Thomas‐Ahner J, et al. NF‐κB–mediated Pax7 dysregulation in the muscle microenvironment promotes cancer cachexia. The J Clin Invest 2013;123:4821–4835. [DOI] [PMC free article] [PubMed] [Google Scholar]
- 21. Hettmer S, Wagers AJ. Muscling in: uncovering the origins of rhabdomyosarcoma. Nat Med 2010;16:171–173. [DOI] [PubMed] [Google Scholar]
- 22. Karalaki M, Fili S, Philippou A, Koutsilieris M. Muscle regeneration: cellular and molecular events. In Vivo (Athens, Greece) 2009;23:779–796. [PubMed] [Google Scholar]
- 23. Attaix D, Ventadour S, Codran A, Bechet D, Taillandier D, Combaret L. The ubiquitin‐proteasome system and skeletal muscle wasting. Essays Biochem 2005;41:173–186. [DOI] [PubMed] [Google Scholar]
- 24. Bodine SC, Baehr LM. Skeletal muscle atrophy and the E3 ubiquitin ligases MuRF1 and MAFbx/atrogin‐1. Am J Physiol Endocrinol Metab 2014;307:E469–E484. [DOI] [PMC free article] [PubMed] [Google Scholar]
- 25. Rom O, Reznick AZ. The role of E3 ubiquitin‐ligases MuRF‐1 and MAFbx in loss of skeletal muscle mass. Free Radic Biol Med 2016;98:218–230. [DOI] [PubMed] [Google Scholar]
- 26. Kobayashi S. Choose delicately and reuse adequately: the newly revealed process of autophagy. Biol Pharm Bull 2015;38:1098–1103. [DOI] [PubMed] [Google Scholar]
- 27. Chang YY, Neufeld TP. An Atg1/Atg13 complex with multiple roles in TOR‐mediated autophagy regulation. Mol Biol Cell 2009;20:2004–2014. [DOI] [PMC free article] [PubMed] [Google Scholar]
- 28. He C, Klionsky DJ. Regulation mechanisms and signaling pathways of autophagy. Annu Rev Genet 2009;43:67–93. [DOI] [PMC free article] [PubMed] [Google Scholar]
- 29. Bonetto A, Aydogdu T, Kunzevitzky N, Guttridge DC, Khuri S, Koniaris LG, et al. STAT3 Activation in skeletal muscle links muscle wasting and the acute phase response in cancer cachexia. PloS one. 2011;6:e22538. [DOI] [PMC free article] [PubMed] [Google Scholar]
- 30. Gao S, Carson JA. Lewis lung carcinoma regulation of mechanical stretch‐induced protein synthesis in cultured myotubes. Am J Physiol Cell Physiol 2016;310:C66–C79. [DOI] [PMC free article] [PubMed] [Google Scholar]
- 31. Zhang G, Jin B, Li YP. C/EBPβ mediates tumour‐induced ubiquitin ligase atrogin1/MAFbx upregulation and muscle wasting. EMBO J 2011;30:4323–4335. [DOI] [PMC free article] [PubMed] [Google Scholar]
- 32. Gasier HG, Riechman SE, Wiggs MP, Previs SF, Fluckey JD. A comparison of 2H2O and phenylalanine flooding dose to investigate muscle protein synthesis with acute exercise in rats. Am J Physiol Endocrinol Metab 2009;297:E252–E259. [DOI] [PMC free article] [PubMed] [Google Scholar]
- 33. Nilsson MI, Dobson JP, Greene NP, Wiggs MP, Shimkus KL, Wudeck EV, et al. Abnormal protein turnover and anabolic resistance to exercise in sarcopenic obesity. FASEB J 2013;27:3905–3916. [DOI] [PubMed] [Google Scholar]
- 34. Hudson MB, Smuder AJ, Nelson WB, Wiggs MP, Shimkus KL, Fluckey JD, et al. Partial support ventilation and mitochondrial‐targeted antioxidants protect against ventilator‐induced decreases in diaphragm muscle protein synthesis. PLoS One 2015;10:e0137693. [DOI] [PMC free article] [PubMed] [Google Scholar]
- 35. Nilsson MI, Greene NP, Dobson JP, Wiggs MP, Gasier HG, Macias BR, et al. Insulin resistance syndrome blunts the mitochondrial anabolic response following resistance exercise. Am J Physiol Endocrinol Metab 2010;299:E466–E474. [DOI] [PubMed] [Google Scholar]
- 36. Brown JL, Rosa‐Caldwell ME, Lee DE, Brown LA, Perry RA, Shimkus KL, et al. PGC‐1α4 gene expression is suppressed by the IL‐6‐MEK‐ERK 1/2 MAPK signalling axis and altered by resistance exercise, obesity and muscle injury. Acta Physiol (Oxford, England). 2016. [DOI] [PubMed] [Google Scholar]
- 37. Lee DE, Brown JL, Rosa ME, Brown LA, Perry RA Jr, Wiggs MP, et al. microRNA‐16 is downregulated during insulin resistance and controls skeletal muscle protein accretion. J Cell Biochem 2016;117:1775–1787. [DOI] [PubMed] [Google Scholar]
- 38. Call JA, Wilson RJ, Laker RC, Zhang M, Kundu M, Yan Z. Ulk1‐mediated autophagy plays an essential role in mitochondrial remodeling and functional regeneration of skeletal muscle. Am J Physiol Cell Physiol 2017;312:C724–c32. [DOI] [PMC free article] [PubMed] [Google Scholar]
- 39. Lee DE, Brown JL, Rosa‐Caldwell ME, Blackwell TA, Perry RA Jr, Brown LA, et al. Cancer cachexia‐induced muscle atrophy: evidence for alterations in microRNAs important for muscle size. Physiol Genomics 2017:physiolgenomics 2017;00006. [DOI] [PubMed] [Google Scholar]
- 40. Jackman RW, Floro J, Yoshimine R, Zitin B, Eiampikul M, El‐Jack K, et al. Continuous release of tumor‐derived factors improves the modeling of cachexia in muscle cell culture. Front Physiol 2017;8:738. [DOI] [PMC free article] [PubMed] [Google Scholar]
- 41. Goodman CA, Hornberger TA. Measuring protein synthesis with SUnSET: a valid alternative to traditional techniques? Exerc Sport Sci Rev 2013;41:107–115. [DOI] [PMC free article] [PubMed] [Google Scholar]
- 42. Goodman CA, Mabrey DM, Frey JW, Miu MH, Schmidt EK, Pierre P, et al. Novel insights into the regulation of skeletal muscle protein synthesis as revealed by a new nonradioactive in vivo technique. FASEB J 2011;25:1028–1039. [DOI] [PMC free article] [PubMed] [Google Scholar]
- 43. Buckingham M. Skeletal muscle progenitor cells and the role of Pax genes. C R Biol 2007;330:530–533. [DOI] [PubMed] [Google Scholar]
- 44. Pain VM. Initiation of protein synthesis in eukaryotic cells. FEBS 1996;236:747–771. [DOI] [PubMed] [Google Scholar]
- 45. Porter JD, Khanna S, Kaminski HJ, Rao JS, Merriam AP, Richmonds CR, et al. A chronic inflammatory response dominates the skeletal muscle molecular signature in dystrophin‐deficient mdx mice. Hum Mol Genet 2002;11:263–272. [DOI] [PubMed] [Google Scholar]
- 46. Wilde JM, Gumucio JP, Grekin JA, Sarver DC, Noah AC, Ruehlmann DG, et al. Inhibition of p38 mitogen‐activated protein kinase signaling reduces fibrosis and lipid accumulation after rotator cuff repair. J Shoulder Elbow Surg 2016;25:1501–1508. [DOI] [PMC free article] [PubMed] [Google Scholar]
- 47. Sandri M, Sandri C, Gilbert A, Skurk C, Calabria E, Picard A, et al. Foxo transcription factors induce the atrophy‐related ubiquitin ligase atrogin‐1 and cause skeletal muscle atrophy. Cell 2004;117:399–412. [DOI] [PMC free article] [PubMed] [Google Scholar]
- 48. Lima M, Sato S, Enos RT, Baynes JW, Carson JA. Development of an UPLC mass spectrometry method for measurement of myofibrillar protein synthesis: application to analysis of murine muscles during cancer cachexia. J Appl Physiol 2013;114:824–828. [DOI] [PMC free article] [PubMed] [Google Scholar]
- 49. Mochamat, Cuhls H, Marinova M, Kaasa S, Stieber C, Conrad R, et al. A systematic review on the role of vitamins, minerals, proteins, and other supplements for the treatment of cachexia in cancer: a European Palliative Care Research Centre cachexia project. J Cachexia Sarcopenia Muscle 2017;8:25–39. [DOI] [PMC free article] [PubMed] [Google Scholar]
- 50. Pin F, Busquets S, Toledo M, Camperi A, Lopez‐Soriano FJ, Costelli P, et al. Combination of exercise training and erythropoietin prevents cancer‐induced muscle alterations. Oncotarget 2015;6:43202–43215. [DOI] [PMC free article] [PubMed] [Google Scholar]
- 51. Kuang S, Gillespie MA, Rudnicki MA. Niche regulation of muscle satellite cell self‐renewal and differentiation. Cell Stem Cell 2008;2:22–31. [DOI] [PubMed] [Google Scholar]
- 52. Jackson JR, Mula J, Kirby TJ, Fry CS, Lee JD, Ubele MF, et al. Satellite cell depletion does not inhibit adult skeletal muscle regrowth following unloading‐induced atrophy. Am J Physiol Cell Physiol 2012;303:C854–C861. [DOI] [PMC free article] [PubMed] [Google Scholar]
- 53. Murach KA, Englund DA, Dupont‐Versteegden EE, McCarthy JJ, Peterson CA. Myonuclear domain flexibility challenges rigid assumptions on satellite cell contribution to skeletal muscle fiber hypertrophy. Front Physiol. 2018;9:635. [DOI] [PMC free article] [PubMed] [Google Scholar]
- 54. Bongers KS, Fox DK, Ebert SM, Kunkel SD, Dyle MC, Bullard SA, et al. Skeletal muscle denervation causes skeletal muscle atrophy through a pathway that involves both Gadd45a and HDAC4. Am J Physiol Endocrinol Metab 2013;305:E907–E915. [DOI] [PMC free article] [PubMed] [Google Scholar]
- 55. Furlow JD, Watson ML, Waddell DS, Neff ES, Baehr LM, Ross AP, et al. Altered gene expression patterns in muscle ring finger 1 null mice during denervation‐ and dexamethasone‐induced muscle atrophy. Physiol Genomics 2013;45:1168–1185. [DOI] [PMC free article] [PubMed] [Google Scholar]
- 56. Hyatt JP, Roy RR, Baldwin KM, Edgerton VR. Nerve activity‐independent regulation of skeletal muscle atrophy: role of MyoD and myogenin in satellite cells and myonuclei. Am J Physiol Cell Physiol 2003;285:C1161–C1173. [DOI] [PubMed] [Google Scholar]
- 57. Pennefather P, Quastel DM. Relation between subsynaptic receptor blockade and response to quantal transmitter at the mouse neuromuscular junction. J Gen Physiol 1981;78:313–344. [DOI] [PMC free article] [PubMed] [Google Scholar]
- 58. Johns N, Stephens NA, Fearon KC. Muscle wasting in cancer. Int J Biochem Cell Biol 2013;45:2215–2229. [DOI] [PubMed] [Google Scholar]
- 59. Toledo M, Busquets S, Penna F, Zhou X, Marmonti E, Betancourt A, et al. Complete reversal of muscle wasting in experimental cancer cachexia: additive effects of activin type II receptor inhibition and β‐2 agonist. Int J Cancer 2016;138:2021–2029. [DOI] [PubMed] [Google Scholar]
- 60. Llovera M, Garcia‐Martinez C, Lopez‐Soriano J, Agell N, Lopez‐Soriano FJ, Garcia I, et al. Protein turnover in skeletal muscle of tumour‐bearing transgenic mice overexpressing the soluble TNF receptor‐1. Cancer Lett 1998;130:19–27. [DOI] [PubMed] [Google Scholar]
- 61. Hardee JP, Counts BR, Gao S, VanderVeen BN, Fix DK, Koh HJ, et al. Inflammatory signalling regulates eccentric contraction‐induced protein synthesis in cachectic skeletal muscle. J Cachexia Sarcopenia Muscle 2018;9:369–383. [DOI] [PMC free article] [PubMed] [Google Scholar]
- 62. White JP, Puppa MJ, Sato S, Gao S, Price RL, Baynes JW, et al. IL‐6 regulation on skeletal muscle mitochondrial remodeling during cancer cachexia in the ApcMin/+ mouse. Skeletal Muscle 2012;2:14. [DOI] [PMC free article] [PubMed] [Google Scholar]
- 63. Schiaffino S, Dyar KA, Ciciliot S, Blaauw B, Sandri M. Mechanisms regulating skeletal muscle growth and atrophy. FEBS J 2013;280:4294–4314. [DOI] [PubMed] [Google Scholar]
- 64. Liu Y, Wang X, Leng W, Pi D, Tu Z, Zhu H, et al. Aspartate inhibits LPS‐induced MAFbx and MuRF1 expression in skeletal muscle in weaned pigs by regulating Akt, AMPKα and FOXO1. J Innate Immun 2017;23:34–43. [DOI] [PubMed] [Google Scholar]
- 65. Levine S, Biswas C, Dierov J, Barsotti R, Shrager JB, Nguyen T, et al. Increased proteolysis, myosin depletion, and atrophic AKT‐FOXO signaling in human diaphragm disuse. Am J Respir Crit Care Med 2011;183:483–490. [DOI] [PMC free article] [PubMed] [Google Scholar]
- 66. Wynn TA. Cellular and molecular mechanisms of fibrosis. Am J Pathol 2008;214:199–210. [DOI] [PMC free article] [PubMed] [Google Scholar]
- 67. Shefer G, Oron U, Irintchev A, Wernig A, Halevy O. Skeletal muscle cell activation by low‐energy laser irradiation: a role for the MAPK/ERK pathway. J Cell Physiol 2001;187:73–80. [DOI] [PubMed] [Google Scholar]
- 68. Ding H, Zhang G, Sin KW, Liu Z, Lin RK, Li M, et al. Activin A induces skeletal muscle catabolism via p38β mitogen‐activated protein kinase. J Cachexia Sarcopenia Muscle 2017;8:202–212. [DOI] [PMC free article] [PubMed] [Google Scholar]
- 69. Quan‐Jun Y, Yan H, Yong‐Long H, Li‐Li W, Jie L, Jin‐Lu H, et al. Selumetinib attenuates skeletal muscle wasting in murine cachexia model through ERK inhibition and AKT ACTIVATION. Mol Cancer Ther 2017;16:334–343. [DOI] [PubMed] [Google Scholar]
- 70. Li YP, Chen Y, John J, Moylan J, Jin B, Mann DL, et al. TNF‐α acts via p38 MAPK to stimulate expression of the ubiquitin ligase atrogin1/MAFbx in skeletal muscle. FASEB J 2005;19:362–370. [DOI] [PMC free article] [PubMed] [Google Scholar]
- 71. Bowen TS, Adams V, Werner S, Fischer T, Vinke P, Brogger MN, et al. Small‐molecule inhibition of MuRF1 attenuates skeletal muscle atrophy and dysfunction in cardiac cachexia. J Cachexia Sarcopenia Muscle 2017;8:939–953. [DOI] [PMC free article] [PubMed] [Google Scholar]
- 72. Penna F, Bonetto A, Aversa Z, Minero VG, Rossi Fanelli F, Costelli P, et al. Effect of the specific proteasome inhibitor bortezomib on cancer‐related muscle wasting. J Cachexia Sarcopenia Muscle 2016;7:345–354. [DOI] [PMC free article] [PubMed] [Google Scholar]
- 73. Conte E, Camerino GM, Mele A, De Bellis M, Pierno S, Rana F, et al. Growth hormone secretagogues prevent dysregulation of skeletal muscle calcium homeostasis in a rat model of cisplatin‐induced cachexia. J Cachexia Sarcopenia Muscle 2017;8:386–404. [DOI] [PMC free article] [PubMed] [Google Scholar]
- 74. Stewart Coats AJ, Ho GF, Prabhash K, von Haehling S, Tilson J, Brown R, et al. Espindolol for the treatment and prevention of cachexia in patients with stage III/IV non‐small cell lung cancer or colorectal cancer: a randomized, double‐blind, placebo‐controlled, international multicentre phase II study (the ACT‐ONE trial). J Cachexia Sarcopenia Muscle 2016;7:355–365. [DOI] [PMC free article] [PubMed] [Google Scholar]
- 75. Toledo M, Penna F, Oliva F, Luque M, Betancourt A, Marmonti E, et al. A multifactorial anti‐cachectic approach for cancer cachexia in a rat model undergoing chemotherapy. J Cachexia Sarcopenia Muscle 2016;7:48–59. [DOI] [PMC free article] [PubMed] [Google Scholar]
- 76. Molinari F, Pin F, Gorini S, Chiandotto S, Pontecorvo L, Penna F, et al. The mitochondrial metabolic reprogramming agent trimetazidine as an ‘exercise mimetic’ in cachectic C26‐bearing mice. J Cachexia Sarcopenia Muscle 2017;8:954–973. [DOI] [PMC free article] [PubMed] [Google Scholar]
- 77. Barazzoni R, Gortan Cappellari G, Palus S, Vinci P, Ruozi G, Zanetti M, et al. Acylated ghrelin treatment normalizes skeletal muscle mitochondrial oxidative capacity and AKT phosphorylation in rat chronic heart failure. J Cachexia Sarcopenia Muscle 2017;8:991–998. [DOI] [PMC free article] [PubMed] [Google Scholar]
- 78. von Haehling S, Morley JE, Coats AJS, Anker SD. Ethical guidelines for publishing in the Journal of Cachexia, Sarcopenia and Muscle: update 2017. J Cachexia Sarcopenia Muscle 2017;8:1081–1083. [DOI] [PMC free article] [PubMed] [Google Scholar]
Associated Data
This section collects any data citations, data availability statements, or supplementary materials included in this article.
Supplementary Materials
Figure S1. Denervation markers throughout the progression of cancer‐cachexia. A. AchR α mRNA content throughout the progression of cancer‐cachexia. B. AchR δ mRNA content throughout the progression of cancer‐cachexia. C. AchR ε mRNA content throughout the progression of cancer‐cachexia. D. Gad45A mRNA content throughout the progression of cancer‐cachexia. E. Runx1 mRNA content throughout the progression of cancer‐cachexia. F. Mus A mRNA content throughout the progression of cancer‐cachexia. N of 7‐8 was utilized for each group. Lettering denotes statistical significance at an alpha set at p<0.05.