Abstract
Background
Chronic kidney disease (CKD) is commonly associated with cachexia, a condition that causes skeletal muscle wasting and an unfavourable prognosis. Although mechanisms leading to cachexia have been intensively studied, the advance of biological knowledges and technologies encourages us to make progress in understanding the pathogenesis of this disorder. Long noncoding RNAs (lncRNAs) are defined as >200 nucleotides RNAs but lack the protein‐coding potential. LncRNAs are involved in the pathogenesis of many diseases, but whether they functionally involve in muscle protein loss has not been investigated.
Methods
We performed lncRNA array and identified an lncRNA, which we named Atrolnc‐1, remarkably elevated in atrophying muscles from mice with cachexia. We examined how overexpression or knockdown of Atrolnc‐1 could influence muscle protein synthesis and degradation. We also examined whether inhibition of Atrolnc‐1 ameliorates muscle wasting in mice with CKD.
Results
We documented that Atrolnc‐1 expression is continuously increased in muscles of mice with fasting (5.4 fold), cancer (2.0 fold), or CKD (5.1 fold). We found that depressed insulin signalling stimulates the transcription factor C/EBP‐α binding to the promoter of Atrolnc‐1 and promotes the expression of Atrolnc‐1. In cultured C2C12 myotubes, overexpression of Atrolnc‐1 increases protein degradation (0.45±0.03 vs. 0.64±0.02, *p<0.05); Atrolnc‐1 knockdown significantly reduces the rate of protein degradation stimulated by serum depletion (0.61±0.03 vs. 0.47±0.02, *p<0.05). Using mass spectrometry and a lncRNA pull‐down assay, we identified that Atrolnc‐1 interacts with A20 binding inhibitor of NF‐κB‐1 (ABIN‐1). The interaction impairs function, resulting in enhanced NF‐κB activity plus MuRF‐1 transcription. This response is counteracted by CRISPR/dCas9 mediated overexpression. In muscles from normal mice, overexpression of Atrolnc‐1 stimulates a 2.7‐fold increase in MuRF‐1 expression leading to myofibers atrophy. In contrast, Atrolnc‐1 knockdown attenuates muscle wasting by 42% in mice with CKD via suppression of NF‐κB activity and MuRF‐1 expression.
Conclusions
Our findings provide evidence that lncRNAs initiates the pathophysiological process of muscle wasting. The interaction between Atrolnc‐1 and NF‐κB signalling modulates muscle mass and proteolysis in CKD and perhaps other catabolic conditions.
Keywords: NF‐κB, LncRNA, Muscle wasting, Chronic kidney disease, Ubiquitin proteasome system
Introduction
Muscle wasting is defined as a decrease in the mass of skeletal muscle, an important index for prognosis of chronic diseases.1 For example, cancer or chronic kidney disease (CKD) patients associated with muscle wasting usually have increased risks of morbidity and mortality.2 Muscle wasting in CKD or other catabolic conditions is a complex process that occurs as a consequence of impaired IGF‐1/insulin signalling, metabolic stress, elevated glucocorticoids, and inflammation.3, 4, 5 Although significant progress has been made towards understanding muscle protein loss, the behind molecules and cellular mechanisms are still being discovered.
Inflammation has emerged as a critical biological event leading to muscle wasting. Many proinflammatory cytokines such as tumour necrosis factor‐α, tumour necrosis factor‐like weak inducer of apoptosis, IL‐6, and interferon‐α reportedly promote proteolysis in muscle.6, 7, 8 As a key transcription factor mediating inflammatory responses, NF‐κB positively regulates muscle protein degradation under various catabolic conditions.9, 10 NF‐κB consistently promotes the expression of ubiquitin E3 ligase MuRF‐1 to increase muscle proteolysis via the ubiquitin‐proteasome system.11, 12, 13 In cytoplasm, NF‐κB binds with its repressor IκB to form an inactive complex. Phosphorylation of IκB leads to its ubiquitination and proteasomal degradation,14 then NF‐κB is freed to enter the nucleus where it can promote the expression of specific gene such as MuRF‐1. However, there are several proteins that can inhibit IκB degradation in cytoplasm. Among them, the A20 binding inhibitor of NF‐κB‐1 (ABIN‐1) interacts with A20 and polyubiquitinated NEMO to inhibit IκB degradation and NF‐κB activation.15 Therefore, ABIN‐1 functions as an endogenous NF‐κB inhibitor to brake NF‐κB signalling.16, 17
Long noncoding RNAs (lncRNAs) are defined as >200 nucleotides RNAs that lack protein‐coding potential.18, 19 Emerging evidences have shown lncRNAs play roles in diverse cellular processes ranging from chromatin modification, RNA stability, to translational control.20, 21 For example, they can provide scaffolds for protein interactions to regulate signalling pathways involving cell cycle, proliferation, apoptosis, and DNA damage repair. They can also act as transcriptional regulators by interacting with and organizing histone writers, readers, and modifiers.20, 22 Importantly, aberrant expressions of lncRNAs are associated with diverse pathologies including cancer, cardiac, and muscle diseases.23, 24 Although mechanisms underlying the broad functions of lncRNAs are rapidly emerging, few studies provided a comprehensive insight of lncRNAs in regulating skeletal muscle proteolysis.
In the current study, we were dedicated to discovering cachexia related lncRNAs and defined their functions in muscle undergoing atrophy. We identified a lncRNA, 1110038 B12Rik was consistently up‐regulated in muscles from various mouse models of muscle wasting. Because overexpression of this lncRNA stimulated the expression of MuRF‐1 and muscle atrophy, we renamed it as Atrophy‐related long noncoding RNA‐1 (Atrolnc‐1). We uncovered that Atrolnc‐1 interacted with ABIN‐1, resulting in enhanced NF‐κB activity and MuRF‐1 expression. These results add a new layer of complexity to MuRF‐1 regulation and expand on the spectrum of transcriptional regulation of proteolysis during muscle wasting.
Methods
Mouse strains and chronic kidney disease model
Male C57BL/6 mice (12‐week‐old) were housed with 12 h light/dark cycles, and all animal procedures were approved in Baylor College of Medicine's Institutional Animal Care and Use Committee. The CKD model was created using subtotal nephrectomy as previously described.4, 5 Three weeks after subtotal nephrectomy, CKD mice and sham controls underwent intermuscular AAV1 injection into tibialis anterior (TA) muscle and were pair‐fed for 3 weeks. For pair‐feeding, the amount of chow eaten by CKD mouse is fed to the sham‐control mouse, this sequence is repeated for the duration of the experiment. For AAV1 injection, 20 μL of AAV1 (1 × 10¹¹ g.c) carrying shRNA‐scramble (control AAV1), AAV1‐Atrolnc‐1, or AAV1‐shAtrolnc‐1 were injected into TA muscles.
Cell culture
The C2C12 mouse myoblasts (ATCC; Manassas, VA, USA) were routinely cultured at 37°C/5% CO2 in Dulbecco's modified Eagles' medium supplemented with 10% foetal bovine serum (Corning Cellgro, Manassas, VA, USA) and 1% penicillin/streptomycin. For overexpression ABIN‐1 in myoblasts, cells were transduced using CRISPR/dCas9 mediated synergistic activation mediator transcription activation system (Cat# sc‐425441‐LAC, Santa Cruz Biotechnology, Santa Cruz, CA, USA) following the manufactory instruction. For differentiating myotubes, C2C12 myoblasts were incubated with 2% horse serum (American Type Culture Collection) for at least 72 h. We transfected 1 × 10¹¹ g.c. AAV1 into C2C12 myotubes for 48 h and measured transfection efficiency using real‐time quantitative PCR.
RT2 profiler PCR array analysis
Total RNA was reverse transcribed to cDNA using the First Strand cDNA Kits (Qiagen Sciences, Germantown, MD, USA). RT2 Profiler™ PCR Array (LncRNA, Cat# LAMM‐ 001Z and Myogenesis & Myopathy, Cat# PAMM‐099Z) was performed following the manufacturer's instruction (Qiagen Sciences). Real‐time quantitative PCR was performed by Bio‐Rad CFX96 System and normalized by five housekeeping genes. Data were analysed using software provided by Qiagen Sciences. The LncRNA array examines the expression of 84 key mouse common lncRNA that were confirmed having no protein‐coding potential. The Myogenesis & Myopathy array examines the expression of 84 key mouse genes involved in skeletal muscle protein metabolism, function, and disease‐related processes.
RNA‐biotin based pull down assay
To obtain the biotin‐labelled Atrolnc‐1‐RNA probe, linearized pBlue‐Atrolnc‐1 plasmid was incubated with biotin RNA labelling mix (Roche Molecular Systems, Inc. Hague Road, IN) for 20 min at 37°C, in vitro transcription was performed using a MAXIscript® T7/T3 Transcription Kit (Thermo Fisher, Waltham, MA, USA) following manufacturer's instructions. Biotinylated Atrolnc‐1‐ RNA was incubated with RNA structure buffer at 95°C for 2 min, on ice for 3 min, at room temperature for another 30 min to allow proper RNA secondary structure formation. The biotinylated Atrolnc‐1‐RNA probe was added into prewashed hydrophilic streptavidin magnetic beads and incubated at 4°C with gentle rotation for overnight. C2C12 cytoplasmic lysate and nuclear lysate were prepared and incubated with magnetic beads for 2 h at 4°C with rotation. Wash the magnetic beads three times, resuspend the beads and boil beads with 1× loading buffer at 95°C for 10 min, proteins were separated by SDS‐PAGE. The gels were stained with 0.1% Coomassie Brilliant Blue R250 for 1 h.
Statistical analysis
Results are presented as mean ± SEM. For experiments comparing two groups, we analysed results by two‐tail unpaired Student's t‐tests. When more than two groups were compared, two‐way ANOVA followed by Newman‐Keul's test were used to analyse the differences between the two interested groups. Differences were considered statistically significant at P < 0.05 (*).
For other details of techniques and procedures, please see Supplementary Methods.
Results
Characterization of a signature lncRNA in skeletal muscles of catabolic conditions
To identify whether lncRNAs are differentially expressed in muscle wasting, we performed a PCR based lncRNA array (RT2 lncRNA PCR Array) analysis in quadriceps muscles from three mouse models of catabolic conditions including CKD, starvation (STV), and cancer. We found that several lncRNAs were differentially expressed in muscles of mice with catabolic conditions (Figure 1A). We further identified that the expression of eight lncRNAs were simultaneously elevated in atrophying muscles from the three mouse catabolic models, among which 1110038 B12Rik was the most robustly increased lncRNA; meanwhile, the expression of nine lncRNAs were downregulated in muscles from the three catabolic models (Figure 1B). Using real‐time quantitive PCR, we confirmed that 1110038B12Rik was abundantly expressed in skeletal muscle and its expression was markedly increased in atrophying muscles caused by CKD, STV, and cancer (Figure 1C). Because 1110038 B12Rik increases in response to muscle atrophy, we named it as Atrolnc‐1. The variants of Atrolnc‐1 and their expressions in tissues of mice are illustrated in Figure S1.
Figure 1.
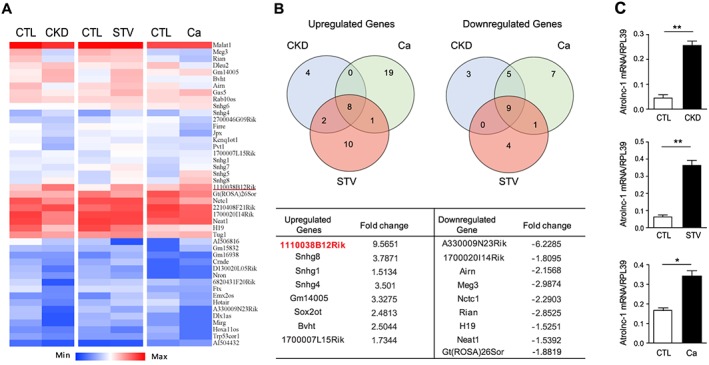
Atrolnc‐1 (1110038B12Rik) is significantly up‐regulated in muscles of different catabolic conditions. (A) Heat map of lncRNA PCR Array shows differentially expressed lncRNAs in quadriceps muscles of chronic kidney disease (CKD), Starvation (STV), and cancer (Ca) models. (B) The Venn diagrams demonstrate the overlap among upregulated (left) and downregulated (right) lncRNAs in CKD (blue circle), STV (red circle), and Ca (green circle) models. The name and fold change of the specific lncRNAs in the overlap regions are summarized in the table. (C) qRT‐PCR confirmed the upregulation of Atrolnc‐1 in different muscle wasting models. Data are shown as means ± SEM, n = 5 mice per group, *P < 0.05, **P < 0.01.
Insulin/IGF‐1 signalling regulates Atrolnc‐1 expression
Because CKD or STV is usually associated with depressed insulin signalling,3, 4 we hypothesize that insulin or IGF‐1 signalling may regulate Atrolnc‐1 expression in muscles. We first examined how insulin influences the expression of Atrolnc‐1 in serum‐starved C2C12 myotubes with or without insulin. As shown in Figure 2A, Atrolnc‐1 expression was significantly increased by serum depletion for 24 h, while addition of insulin or IGF‐1 eliminated the level of Atrolnc‐1 stimulated by serum depletion. Next, we ascertained the mechanism by which insulin suppresses Atrolnc‐1 expression. By analysing the promoter region of Atrolnc‐1(~2000 bp from transcript site), we found that there are many binding sites for transcription factor C/EBP‐α (Figure 2B). This stimulated us to investigate if C/EBP‐α promotes the expression of Atrolnc‐1.25 We transfected a plasmid containing the Atrolnc‐1 promoter following luciferase reporter (Luc‐Atrolnc‐1) into C2C12 myoblasts (Figure 2C), after 24 h, cells were treated with serum depletion or C/EBP‐α overexpression. As expected, serum depletion or overexpression of C/EBP‐α strongly stimulated Atrolnc‐1 promoter activity in C2C12 cells. We then performed a chromatin immunoprecipitation assay to confirm that C/EBP‐α is associated with the promoter regions of Atrolnc‐1. As shown in Figure 2D, serum‐depletion enriched the promotor DNA fragments containing C/EBP‐α binding sites in the immune precipitates pulled down by anti‐C/EBP‐α antibody. Notably, adding insulin (2 μg/mL) decreased the amount of promotor DNA fragments in immune precipitates, indicating that insulin blocked C/EBP‐α binding to the promoter of Atrolnc‐1 (Figure 2E). These results suggest that depressed insulin signalling occurring in CKD or STV mice stimulates C/EBP‐α to promote Atrolnc‐1 expression in muscles.
Figure 2.
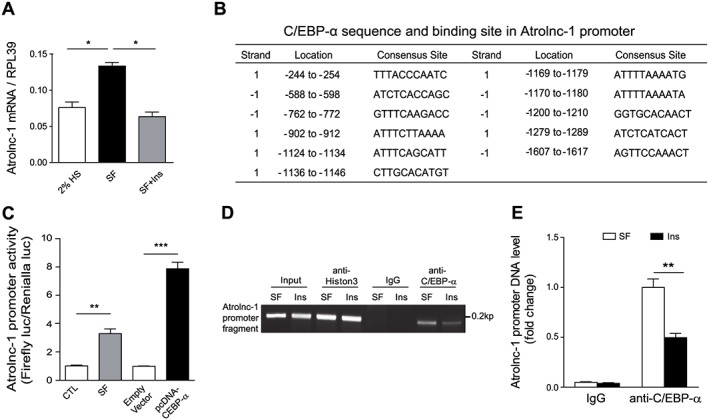
Atrolnc‐1 expression is negatively regulated by insulin. (A) The expression of Atrolnc‐1 in C2C12 myotubes cultured with 2% horse serum (HS) and serum‐free (SF) media with or without insulin (Ins) addition (mean ± SEM, n = 3, *P < 0.05). (B) The summary of C/EBPα binding sites in promoter region of Atrolnc‐1. (C) Atrolnc‐1 promoter activity tested by the promoter linked luciferase reporter in C2C12 myoblasts. The activity of Atrolnc‐1 promoter was significantly promoted by serum depletion and overexpression of C/EBPα (mean ± SEM, n = 9, **P < 0.01, ***P < 0.001). (D) Representative agarose gel electrophoresis demonstrates the results of Chromatin Immunoprecipitation assay using anti‐C/EBP‐α antibody in C2C12 cells treated with SF or SF following Insulin addition. Anti‐Histon3 antibody and normal rabbit IgG were used as positive control and negative control, respectively. (E) Quantification of Atrolnc‐1 promoter fragment pulled‐down by IgG or anti‐C/EBP‐α antibody in (D) (mean ± SEM, n = 3, **P < 0.01).
Atrolnc‐1 regulates protein degradation in muscle cells
To ascertain the function of Atrolnc‐1 in the regulation of muscle metabolism, we constructed two AAV1 (Adeno‐associated virus isotype 1, which has high affinity with skeletal muscle cell) carrying Atrolnc‐1 cDNA or shRNA for overexpression or knockdown of Atrolnc‐1, respectively. To examine how Atrolnc‐1 overexpression influences protein metabolism, C2C12 myotubes were transfected with AAV1 carried Atrolnc‐1 cDNA for 48 h, and there was a 3‐fold increase in Atrolnc‐1 RNA compared with cells transfected with control AAV1 (Figure 3A). We found that overexpression of Atrolnc‐1 did not change the rate of the protein synthesis (Figure 3B), but significantly increased the rate of protein degradation in myotubes compared with the results from myotubes transfected with control AAV1 (Figure 3C). Concomitant with these results, Atrolnc‐1 overexpression caused a decrease in the diameter of the myotubes (Figure 3D). The increase in overall protein degradation is a result of activation of proteasomal proteolysis because lactacystin (proteasomal inhibitor, 8 μM) significantly suppressed the rate of protein degradation stimulated by Atrolnc‐1 overexpression (Figure 3E).
Figure 3.
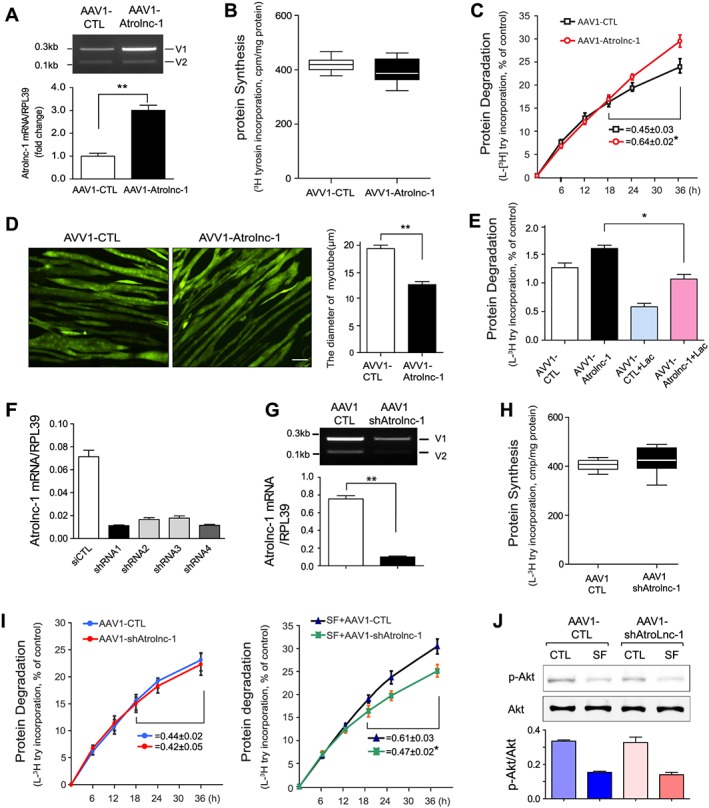
Atrolnc‐1 enhances protein degradation of muscle cells in vitro. (A) qRT‐PCR result shows increased Atrolnc‐1 mRNA levels after the overexpression of Atrolnc‐1 (V1) in C2C12 myotubes (mean ± SEM n = 3, **P < 0.01). V1, Atrolnc‐1 variant 1; V2, Atrolnc‐1 variant 2. (B) The rate of protein synthesis after the overexpression of Atrolnc‐1 in C2C12 myotubes. The rate of protein synthesis was measured from the incorporation of L‐[(3,5)‐3H] tyrosine into cellular proteins (mean ± SEM; n = 6). (C) The rate of protein degradation after the overexpression of Atrolnc‐1 in C2C12 myotubes. Protein degradation was measured by the L‐[(3,5)‐3H]‐tyrosine released into media and plotted as a percentage of total L‐[(3,5)‐3H]‐tyrosine incorporated into cell proteins. The rates of proteolysis were calculated from the linear slopes between 24 and 36 h (mean ± SEM; n = 6, *P < 0.05). (D) C2C12 myotubes with or without Atrolnc‐1 overexpression visualized by infecting adenovirus coding green fluorescent protein (GFP). Scale bar: 20 μm. Graphic presentation (right panel) of the diameter of myotubes calculated from three independent experiments (mean ± SEM, **P < 0.01). (E) C2C12 myotubes with or without Atrolnc‐1 overexpression were treated with a proteasomal inhibitor, lactacystin (Lac). Atrolnc‐1 overexpression‐stimulated proteolysis was largely suppressed by lactacystin (mean ± SEM, n = 6, *P < 0.05). (F) qRT‐PCR result shows Atrolnc‐1 mRNA levels were reduced by four different short hairpin RNAs (shRNAs) against Atrolnc‐1. (G) Agarose gel electrophoresis and the graph (low panel) demonstrated that the Atrolnc‐1 mRNA level was reduced by ~90% in C2C12 myotubes transfected with AAV1‐shAtrolnc‐1. (H) The rate of protein synthesis after the knockdown of Atrolnc‐1 in C2C12 myotubes (mean ± SEM; n = 6). (I) The rate of protein degradation after the knockdown of Atrolnc‐1 in C2C12 myotubes cultured with (left) or without (right) serum. At 48 h after transfection, myotubes with or without Atrolnc‐1 knockdown were switched to serum‐free (SF) medium for 36 h. The rates of proteolysis were calculated from the linear slopes between 24 and 36 h (mean ± SEM, n = 6 per group, *P < 0.05). (J) The level of p‐Akt stays unchanged in myotubes with Atrolnc‐1 knockdown when treated with serum depletion (SF).
To construct AAV1‐shAtrolnc, we tested the abilities of four different short hairpin RNAs (shRNAs) to knockdown Atrolnc‐1. Two of oligonucleotides (No.1 and No.4, targeting exon5 and exon2, respectively) have the most efficiency at knockdown of Atrolnc‐1 (Figure 3F). When AAV1 carried No.1 shRNA transfected C2C12 myotubes for 48 h, it efficiently reduced the levels of Atrolnc‐1 RNA compared with the myotubes transfected with control shRNA (Figure 3G). Following the knockdown of Atrolnc‐1, the rate of protein synthesis was not significantly affected (Figure 3H). We also found the protein degradation was not influenced, however, when the myotubes were treated with serum depletion, the rate of protein degradation was significantly suppressed by knockdown of Atrolnc‐1 (Figure. 3I). Of notice, Atrolnc‐1 knockdown did not change the level of p‐Akt in C2C12 myotubes after cultured with serum free medium (Figure 3J). These results indicated that Atrolnc‐1 stimulates muscle protein degradation.
Atrolnc‐1 enhances the expression of ubiquitin E3 ligase MuRF‐1 in muscle cells
To investigate the mechanism by which Atrolnc‐1 stimulates muscle proteolysis, we profiled gene expressions using the ‘Myogenesis & Myopathy PCR Array’ in C2C12 myotubes.26 Firstly, we examined the expression of these genes in myotubes with Atrolnc‐1 knockdown, and found 3 genes were upregulated while 11 genes were downregulated in response to Atrolnc‐1 knockdown (Figure 4A). Among the downregulated genes, MuRF‐1, a major ubiquitin E3 ligase mediating muscle proteolysis was significantly reduced. We also confirmed downregulation of MuRF‐1 by western blot, and found a ~2‐fold decrease of MuRF‐1 protein in myotubes with Atrolnc‐1 knockdown (Figure 4B). Next, we performed the same PCR Array in myotubes with Atrolnc‐1 overexpression. More than 20% of the tested genes were upregulated, including MuRF‐1 (Figure 4C). Using western blot, we confirmed that Atrolnc‐1 overexpression significantly stimulated the expression of MuRF‐1 in C2C12 myotubes (Figure 4D). Of notice, we found that the expression of Atrolnc‐1 in myotubes was quickly increased in response to serum depletion (<6 h), much earlier than the induction of MuRF‐1(Figure 4E), indicating Atrolnc‐1 may play a causal role to induce MuRF‐1 expression.
Figure 4.
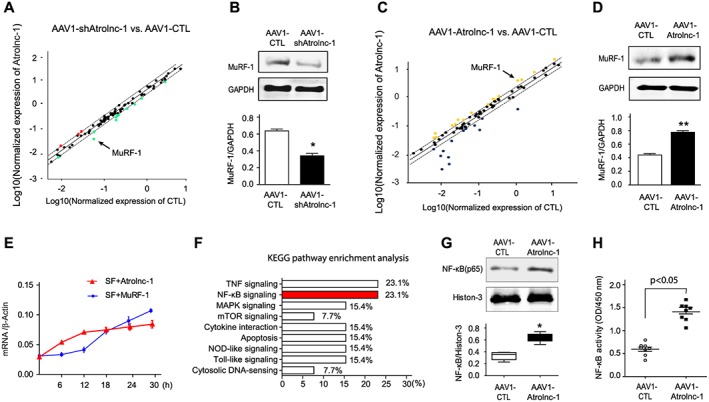
Atrolnc‐1 upregulates MuRF‐1 expression in C2C12 myotubes. (A) Scatter analysis of Myogenesis & Myopathy PCR Array identified that MuRF‐1(arrowhead) was downregulated in C2C12 myotubes when Atrolnc‐1 was knocked down by AAV1‐shAtrolnc‐1. AAV1‐carried scrambled shRNA (AAV1‐CTL) served as control. Dash lines indicate 2‐fold changes. (B) The down‐regulation of MuRF‐1 was confirmed by immunoblots in C2C12 myotubes with Atrolnc‐1 knockdown, GAPDH was used as loading control (mean ± SEM; n = 3, *P < 0.05). (C) Scattered plot of Myogenesis & Myopathy RT‐PCR Array in C2C12 myotubes with Atrolnc‐1 overexpression (AAV1‐Atrolnc‐1), MuRF‐1 was indicated with the arrowhead. AAV1 carried scrambled shRNA (AAV1‐CTL) served as control. Dash lines indicate 2‐fold changes. (D) Immunoblots confirmed the up‐regulation of MuRF‐1 in C2C12 myotubes with Atrolnc‐1 overexpression (mean ± SEM; n = 3, **P < 0.01). (E) The time course of Atrolnc‐1 and MuRF‐1 expression in response to serum depletion. The mRNA level was examined using RT‐PCR. β‐actin was used as internal control. SF, serum free (mean ± SEM; n = 3 in each group). (F) KEGG pathway enrichment analysis of genes altered by the knockdown or overexpression of Atrolnc‐1. NF‐κB signalling (red) was linked to the Atrolnc‐1 expression. (G) Immunoblot shows NF‐κB (p65) was increased in the nuclear fraction of C2C12 myotubes with Atrolnc‐1 overexpression (mean ± SEM; n = 3/group, *P < 0.05). (H) NF‐κB activity assay revealed overexpression of Atrolnc‐1 activated NF‐κB signalling in C2C12 myotubes (mean ± SEM; n = 8 in each group).
Because these results indicate that Atrolnc‐1 regulates MuRF‐1 expression at transcriptional level, we ascertained signalling pathways involved in the regulation of MuRF‐1. By using KEGG pathway enrichment analysis, we found that NF‐κB signalling was one of the mostly enriched pathways in response to Atrolnc‐1 overexpression or knockdown (Figure 4F). To confirm that Atrolnc‐1 targets NF‐κB signalling to stimulate MuRF‐1 expressions, we studied the nuclear trafficking of NF‐κB (p65) in C2C12 myotubes with overexpression of Atrolnc‐1. Using western blotting, we detected that there was a remarkable increase in p65 in nuclear fraction of C2C12 cells after overexpression of Atrolnc‐1 for 48 h (Figure 4G). A NF‐κB activity assay further confirmed that overexpression of Atrolnc‐1 activates NF‐κB signalling in C2C12 myotubes (Figure 4H). These results indicate that Atrolnc‐1 can promote NF‐κB activity in muscle cells.
Atrolnc‐1 interacts with ABIN‐1 promoting NF‐κB‐mediated MuRF‐1 transcription
To understand how Atrolnc‐1 enhances NF‐κB activity, we performed RNA in situ hybridization to study the cellular distribution of Atrolnc‐1 in C2C12 cells. Atrolnc‐1 RNA was located in both cytoplasm and nucleus (Figure 5A), suggesting its multiple potential role in gene regulation. Because lncRNAs involved in gene regulation often function via binding to a specific protein(s) in cytoplasm or in nucleus,22, 27 we then performed an RNA pull‐down assay using cytoplasm or nuclear extracts of C2C12 myotubes to identify the proteins that interact with Atrolnc‐1. Compared with an antisense, control probe, biotin‐labelled full‐length Atrolnc‐1 precipitated with many cytoplasm proteins shown in SDS‐PAGE gel staining with coomassie blue, while few proteins were pulled‐down by biotin‐Atrolnc‐1 probe from nuclear extract (Figure 5B). The gels were then analysed with mass spectrometry, and we identified cytoplasmic proteins potentially interacted with Atrolnc‐1 (Figure 5C and Figure S2). One of them was ABIN‐1, a protein reportedly inhibiting NF‐κB signalling.17 We confirmed the specificity of interaction between ABIN‐1 and Atrolnc‐1 by immunoblotting using an antibody against ABIN‐1. Among proteins pulled‐down by biotin‐labelled Atrolnc‐1, we detected a 72 kD protein that corresponds to ABIN‐1 (Figure 5D left panel). This interaction also happens in vivo, because RNA pull‐down assay using cytoplasmic extraction from the mouse TA muscles also indicated that Atrolnc‐1 associated with ABIN‐1 (Figure 5D, right panel). To further evaluate this interaction in vivo, we used anti‐ABIN‐1 antibody to reciprocally pull‐down Atrolnc‐1 in mouse TA muscle lysates, followed by a RT‐PCR to quantify Atrolnc‐1 in the immunoprecipitates. The experiment revealed that Atrolnc‐1 is significantly enriched in the precipitate pulled‐down by anti‐ABIN‐1 antibody but not in the precipitate pulled‐down by normal IgG, the control antibody. Notably, we observed an increase of interaction between Atrolnc‐1 and ABIN‐1 in the muscle from mice with CKD, indicating that CKD can stimulate the interaction of Atrolnc‐1 with ABIN‐1 (Figure 5E). Because ABIN‐1 is known as a NF‐κB inhibitor, the interaction with Atrolnc‐1 could interfere with its inhibitory function on NF‐κB signalling. To test this hypothesis, we generated a stable C2C12 cell line for overexpression of ABIN‐1 using CRISPR/dCas9 mediated synergistic activation mediator transcription activation system (Santa Cruz Biotechnology). We initially validated that ABIN‐1 protein level was 2.6‐fold increase in the transduced C2C12 cells (Figure 5F). When these transduced C2C12 cells were overexpressed with Atrolnc‐1, the NF‐κB activity was not significantly increased compared with the result from non‐transduced, control cells also with Atrolnc‐1 overexpression (Figure 5G). These results suggested that ABIN‐1 overexpression can overcome NF‐κB activation that was stimulated by Atrolnc‐1. Concomitant with these changes, MuRF‐1 expression was also suppressed by ABIN‐1 overexpression despite the upregulation of Atrolnc‐1 (Figure 5H). Based on these observations, we proposed that Atrolnc‐1 impedes the inhibitory ability of ABIN‐1, resulting in enhanced NF‐κB activity and MuRF‐1 transcription.
Figure 5.
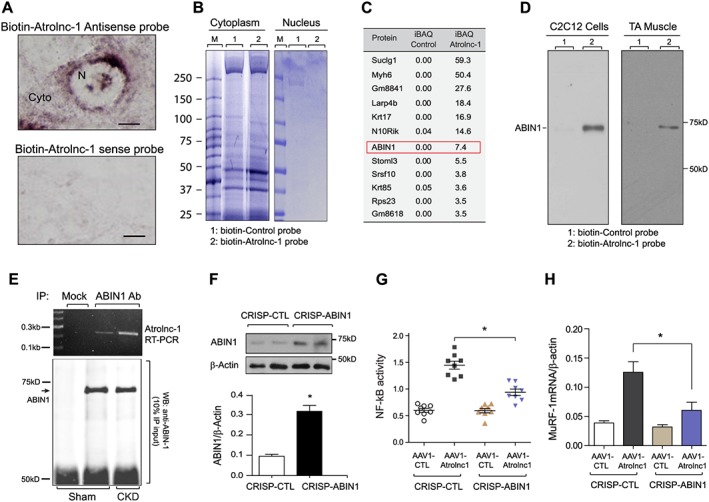
Atrolnc‐1 regulates MuRF‐1 via interacting with ABIN‐1 in vitro and in vivo. (A) In situ hybridization analysis with a biotin‐labelled Atrolnc‐1 antisense probe in C2C12 cell. Atrolnc‐1 positive signals manifest as brown granules located both in the nuclear (N) and cytoplasm (Cyto). Atrolnc‐1 sense probe was used as negative control (CTL). Scale bar = 20 μm. (B) SDS‐PAGE gels exhibit the results of RNA pull‐down assay. The interaction of biotin‐labelled Atrolnc‐1 probe (marked as 2) with proteins from cytoplasm (left gel) and nucleus (right gel) extracted from C2C12 cells are shown. Atrolnc‐1 antisense probe was used as control (marked as 1). M represented molecular marker. (C) The table lists mass spectrometry result of proteins interacting with Atrolnc‐1. In the gels in (B), ABIN‐1, an inhibitor of NF‐kB signalling, was found to bind with biotin‐labelled Atrolnc‐1 probe in cytoplasmic extracts from myotubes. The iBAQ denotes the sum of all the peptides intensities divided by the number of observable peptides of a protein. (D) Left panel: a representative immunoblotting shows a band at 72 kD using ABIN‐1 antibody in the proteins pulled‐down by biotin‐labelled Atrolnc‐1 probe. Right panel: in cytoplasmic extracts of tibialis anterior (TA) muscle from mice, immunoblotting also detected a band at 72 kD in RNA pull‐down assay by biotin‐labelled Atrolnc‐1 probe. (E) The result of immunoprecipitation (IP) in TA muscle from mice with or without chronic kidney disease (CKD). Ten per cent of the IP product was used to conduct western blot (low panel), showing a band at 72 kD using ABIN‐1 antibody (ABIN‐1 Ab) while a RT‐PCR of Arolnc‐1(upper panel) was performed using the rest of IP product. Notice that the Atrolnc‐1 interacted with ABIN‐1 was increased in CKD mice. Mock, normal mouse IgG. (F) Immunoblot in upper panel shows increased ABIN‐1 expression in C2C12 myotubes after transduced by CRISPR/dCas9 mediated synergistic activation mediator transcription activation system. Bar graph (low panel) illustrates the quantity result (mean ± SEM; n = 5, *P < 0.05). (G) The graph demonstrates the NF‐kB activity of C2C12 myotubes with ABIN‐1 overexpression treated with or without AAV1‐Atrolnc‐1 (mean ± SEM; n = 8, *P < 0.05). (H) The expression of MuRF‐1 mRNA in C2C12 myotubes with ABIN‐1 overexpression treated with or without AAV1‐Atrolnc‐1 (mean ± SEM; n = 5, *P < 0.05).
Overexpression of Atrolnc‐1 causes myofibers atrophy in mice
Because overexpression of Atrolnc‐1 stimulates protein degradation in C2C12 myotubes, we next examine whether overexpression of Atrolnc‐1 in muscle can cause myofiber atrophy in vivo. We first validated the transfection efficiency of AAV1 in skeletal muscles. After 14 days of AAV1‐GFP injection in TA muscle, we detected more than 80% of myofibers expressed GFP (Figure 6A). We then injected AAV1‐Atrolnc‐1 into TA muscle of normal C57BL/6 mice, there was a remarkable increase of Atrolnc‐1 RNA compared with muscles injected with control AAV1 (Figure 6B). The overexpression of Atrolnc‐1 is confirmed by in situ hybridization in TA muscle (Figure 6C). To investigate if the overexpression of Atrolnc‐1 causes the muscle fibre atrophy, we examined the cross‐sectional area (CSA) of myofibers injected with either AAV1‐control or AAV1‐Atrolnc‐1. Atrolnc‐1 overexpression in myofiber resulted in a ~25% decrease in fibre CSAs compared with the results from myofibers injected with control AAV1‐shRNA (Figure 6D, up‐panel). This result was confirmed by the leftward shifting in the distribution of CSAs in myofibers with Atrolnc‐1 overexpression (Figure 6D, low‐panel). We also detected an increase in MuRF‐1 expressions compared with results from muscles that were injected with AAV1‐control (Figure 6E and 6F). Thus, Atrolnc‐1 overexpression sufficiently causes myofiber atrophy even in normal mice, highlighting its catabolic effects in muscle protein metabolism.
Figure 6.
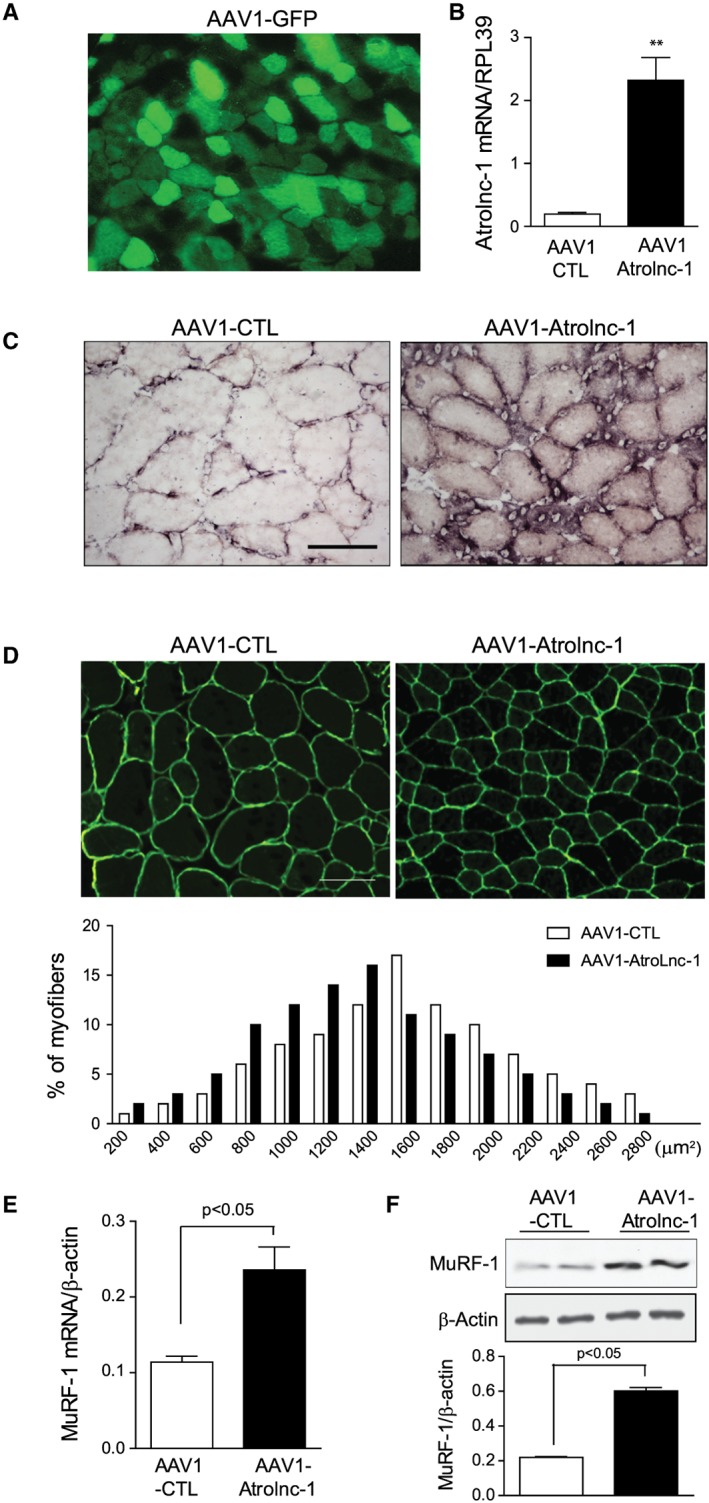
Overexpression of Atrolnc‐1 stimulates muscle atrophy in mice. (A) Tibialis anterior (TA) muscles of normal C57BL mice were transfected by intramuscular injection of AAV1‐GFP. (B) The expression of Atrolnc‐1 mRNA in TA muscles transfected with AAV1‐Atrolnc‐1. Relative mRNA levels are normalized by RPL39 mRNA (mean ± SEM; n = 3, *P < 0.05). (C) In situ hybridization using a biotin‐labelled Atrolnc‐1 antisense probe in TA muscle injected with AAV1‐CTL and AAV1‐Atrolnc‐1. Scale bars: 50 μm. (D) Cryosections (6 μm) were immunostained with anti‐dystrophin antibody to outline myofibers (green fluorescence). Scale bars: 50 μm. The distribution of myofiber sizes in TA muscles transfected with AAV1‐Atrolnc‐1 were shifted left‐ward compared with muscles transfected with AAV1‐CTL. n = 3 animals in each group. (E) The increase in MuRF‐1 mRNA with overexpression of Atrolnc‐1 is confirmed by RT‐PCR (mean ± SEM; n = 5). (F) Immunoblots show that overexpression of Atrolnc‐1 significantly enhanced the protein level of MuRF‐1 in TA muscles. Bar graphs shows the quantitation of five separate experiments (mean ± SEM).
Inhibition of Atrolnc‐1 ameliorates muscle wasting in mice with CKD
Because in vitro experiment suggested that knockdown of Atrolnc‐1 suppressed muscle protein degradation by impeding MuRF‐1 expression, we hypothesize that inhibition of Atrolnc‐1 would attenuate muscle wasting in mice with CKD. This possibility was tested by using AAV1‐mediated gene knockdown in mice with CKD. As shown in Figure 7A, AAV1‐shAtrolnc‐1 was injected into TA muscles of mice 3 weeks after subtotal nephrectomy. The mice were then paired‐fed for 3 weeks before TA muscles were examined. The RNA level of Atrolnc‐1 was reduced as much as 76% compared with the results from CKD mice injected with control AAV1 (Figure 7B). In mice with CKD, the ratio of TA muscle weight to tibia bone length was remarkably decreased; in contrast, this index of muscle atrophy was significantly improved in CKD mice treated with AAV1‐shAtrolnc‐1 (Figure 7C), indicating inhibition of Atrolnc‐1 prevents skeletal muscle mass loss in mice despite CKD. This improvement was confirmed by an increase in CSA of the myofibers (Figure 7d, up‐panel) and a rightward shifting in the distribution of myofiber sizes in TA muscles (Figure 7D, low‐panel). Concomitant with these results, the expression of MuRF‐1 significantly decreased in TA muscles of CKD mice with Atrolnc‐1 knockdown (Figure 7E). Thus, inhibition of Atrolnc‐1 prevents muscle wasting in mice with CKD and suppresses MuRF‐1 expression.
Figure 7.
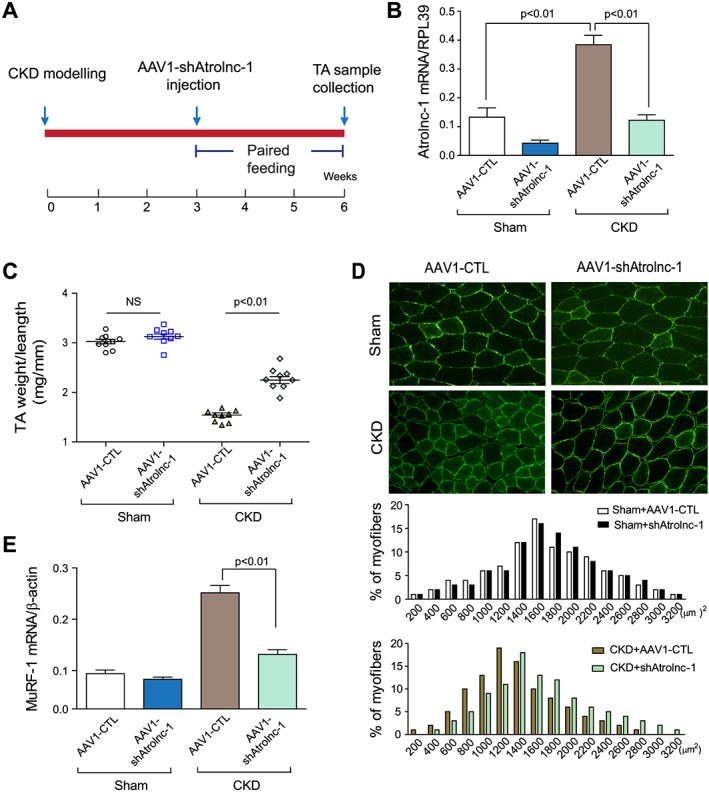
Knockdown of Atrolnc‐1 improves muscle atrophy in mice with chronic kidney disease (CKD). (A) Timeline of experimental design. Arrow denotes time point of AAV1‐shArolnc‐1 injection and subtotal nephrectomy. (B) Tibialis anterior (TA) muscles of normal C57BL/6 mice and CKD mice were transfected with AAV1‐shAtrolnc‐1, while AAV1‐CTL was transfected as control. The Atrolnc‐1 mRNA level was significantly reduced after the knockdown of Atrolnc‐1 (mean ± SEM; n = 9). (C) The weight of TA muscles (normalized by tibia length) was significantly lower in CKD mice transfected with AAV1‐CTL, compared with muscles transfected by AAV1‐shAtrolnc‐1 (mean ± SEM; n = 9). (D) After 3 weeks of transfection with AAV1‐shAtrolnc‐1, the cross‐sectional area of cryosections (6 μm) from TA muscle was shown by immunostaining with anti‐dystrophin antibody. Scale bars: 50 μm. The distribution of myofiber cross‐sectional area was shifted rightward in TA muscles transfected with AAV1‐shAtrolnc‐1 compared with AAV1‐CTL (n = 5). (E) The decrease of MuRF‐1 mRNA in TA muscles with Atrolnc‐1 knockdown was confirmed by RT‐qPCR (mean ± SEM; n = 5).
Discussion
Our current study uncovered a lncRNA, which we named Atrolnc‐1, may regulate MuRF‐1 expression through an interaction with NF‐κB signalling. Specifically, our results suggest that Atrolnc‐1 stimulates muscle protein breakdown by increasing the expression of MuRF‐1. Moreover, we found that Atrolnc‐1 interacts with ABIN‐1, an endogenous NF‐κB inhibitor. This interaction impairs the inhibitive function of ABIN‐1, leading to enhanced NF‐κB activity and resulting in increasing MuRF‐1 expression and muscle proteolysis (Figure 8). Besides providing evidence that Atrolnc‐1 is one of the mechanisms to stimulate MuRF‐1 expression, we also demonstrate that overexpression of Atrolnc‐1 in mouse muscles, even in normal condition, is sufficient to cause MuRF‐1 induction and muscle atrophy; conversely, inhibition of Atrolnc‐1 blocks the induction of MuRF‐1 and accelerated muscle wasting in mice with CKD.
Figure 8.
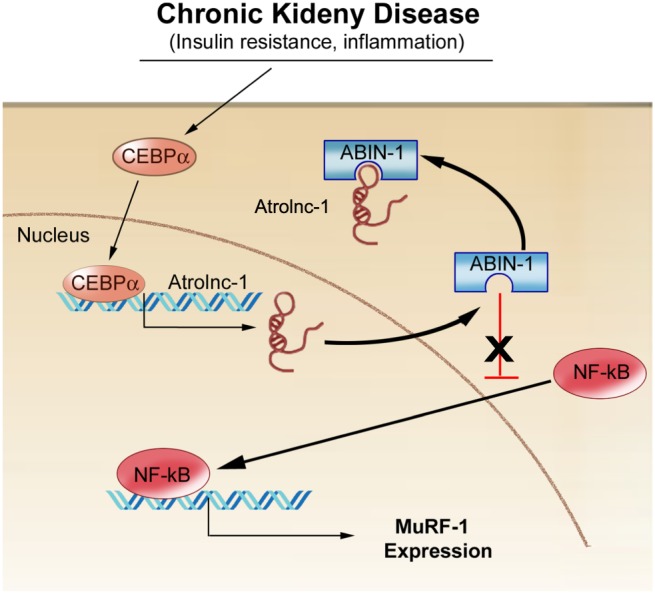
A summative diagram of Atrolnc‐1 stimulates MuRF‐1 transcription. Atrolnc‐1 interacts with an endogenous NF‐κB inhibitor, ABIN‐1, and this association impedes ABIN‐1 inhibitive function, leading to NF‐κB activation, hence increasing MuRF‐1 expression and muscle proteolysis.
Our results indicate that the expression of Atrolnc‐1 increases in several catabolic conditions, including CKD, STV, and cancer. All these conditions are associated with impaired insulin/IGF signaling3; therefore, we tested the possibility that insulin‐signalling regulates Atrolnc‐1 expression. Indeed, we found that insulin can suppress the transcription of Atrolnc‐1 (Figure 2). We also identified that there are many C/EBPs transcription factors binding sites located in the promoter region of Atrolnc‐1 gene and C/EBP‐α functionally regulates Atrolnc‐1 expression. These results are comparable with the previous reports that insulin‐signalling can inhibit CEBPs transcriptional activity,25, 28 but also highlight a critical role of C/EBP‐α in lncRNAs transcription.29
It has been recognized that the biological activities of lncRNAs are dictated by their localization in the cell.30 We found that Atrolnc‐1 localizes both in cytoplasm and in nucleus. We focused on the function of Atrolnc‐1 in the cytoplasm because our proteomics result indicated that Atrolnc‐1 predominately interacted with cytoplasmic proteins (Figure 5). Many lncRNA‐mediated mechanisms of gene regulation have been identified in the cytoplasm through modulating mRNA stability, regulating mRNA translation, serving as competing endogenous RNAs, and mediating protein modifications.20, 31 Recently, several lncRNAs have been identified to modulate the function of cytoplasmic proteins by interfering with their protein–protein interaction, suggesting that the interplay between lncRNAs and cytoplasm proteins constitutes an integral aspect of both their biological activities. For example, lincRNA‐p21 reportedly binds to HIF‐1α under hypoxia condition. This binding blocks the interaction between HIF‐α and von Hippel–Lindau tumour suppressor (VHL) protein as a result of promoting HIF‐1α mediated glycolytic response.32 Similarity, we also found Atrolnc‐1 binding with ABIN‐1, and this interaction inhibited ABIN‐1 activity and leaded to NF‐κB activation. However, the precision mechanism by which Atrolnc‐1 modifies ABIN‐1 needs to be unravelled in further studies. Although we have focused on the function of Atrolnc‐1 in the cytoplasm in this study, the results cannot exclude the possibility that Atrolnc‐1 could regulate genes expression in the nucleus because a single lncRNA can have multiple functions.33, 34
Our future work will identify the equivalent lncRNA in muscle from human subjects. It may not be a practical approach using evolutional history to predict a function of lncRNA in different species because the current comparative genomic tools cannot easily detect homology among lncRNAs from different species.35, 36 Therefore, it remains a challenge to identify a human ‘homolog’ of Atrolnc‐1, which has a similar structure or function similar to mouse Atrolnc‐1. With this consideration, we plan to use anti‐ABIN‐1 antibody to reciprocally pull‐down the lncRNAs, which associated with ABIN‐1 in muscles from human samples. By using RNA‐sequence techniques, we will identify the lncRNAs, which might modulate ABIN‐1 function and examine their functions in regulating of muscle protein turnover. Considering thousands of uncharacterized lncRNAs that could have important physiological functions, our study provides a practical and efficient approach for the identification and characterization of functional lncRNAs in the pathophysiological process of muscle diseases.
In conclusion, we demonstrate that Atrolnc‐1 interacts with ABIN‐1, promoting the activation of NF‐κB and resulting in the increase of MuRF‐1 transcriptional output in muscle. Inhibition of Atrolnc‐1 in atrophying muscles suppresses MuRF‐1 expression and ameliorating muscle wasting. The results of our study also provide further evidence for an important regulatory crosstalk between lncRNAs and NF‐κB signaling that could have broader relevance beyond the pathogenesis of muscle diseases.
Disclosure
None of the authors have a conflict of interest with respect to this work.
Supporting information
Data S1. Supporting Information
Data S2. Supporting Information
Acknowledgements
This work was supported by National Institutes of Health grants (5RO1‐AR063686 to Z.H). L.S. was supported by the National Natural Science Foundation of China (NSFC81603558). H.P. thanks the National Natural Science Foundation of China for supporting through grant NSFC81470955. S.S.T was supported by VA Career Development Award 1IK2 BX002492 to SST from the United States Department of Veterans Affairs, Biomedical Laboratory Research and Development Program. The work in the laboratory of Z.H. is partially funded by Selzman Institute for Kidney Health. The authors certify that they comply with the ethical guidelines for authorship and publishing of the Journal of Cachexia, Sarcopenia and Muscle.37
Sun, L. , Si, M. , Liu, X. , Choi, J. M. , Wang, Y. , Thomas, S. S. , Peng, H. , and Hu, Z. (2018) Long‐noncoding RNA Atrolnc‐1 promotes muscle wasting in mice with chronic kidney disease. Journal of Cachexia, Sarcopenia and Muscle, 9: 962–974. 10.1002/jcsm.12321.
Contributor Information
Hui Peng, Email: elizapeng01@hotmail.com.
Zhaoyong Hu, Email: zhaoyonh@bcm.edu.
References
- 1. Kalantar‐Zadeh K, Rhee C, Sim JJ, Stenvinkel P, Anker SD, Kovesdy CP. Why cachexia kills: examining the causality of poor outcomes in wasting conditions. J Cachexia Sarcopenia Muscle 2013;4:89–94. [DOI] [PMC free article] [PubMed] [Google Scholar]
- 2. Mak RH, Ikizler AT, Kovesdy CP, Raj DS, Stenvinkel P, Kalantar‐Zadeh K. Wasting in chronic kidney disease. J Cachexia Sarcopenia Muscle 2011;2:9–25. [DOI] [PMC free article] [PubMed] [Google Scholar]
- 3. Wang XH, Mitch WE. Mechanisms of muscle wasting in chronic kidney disease. Nat Rev Nephrol 2014;10:504–516. [DOI] [PMC free article] [PubMed] [Google Scholar]
- 4. Peng H, Cao J, Yu R, Danesh F, Wang Y, Mitch WE, et al. CKD stimulates muscle protein loss via rho‐associated protein kinase 1 activation. J Am Soc Nephrol 2016;27:509–519. [DOI] [PMC free article] [PubMed] [Google Scholar]
- 5. Xu J, Li R, Workeneh B, Dong Y, Wang X, Hu Z. Transcription factor FoxO1, the dominant mediator of muscle wasting in chronic kidney disease, is inhibited by microRNA‐486. Kidney Int 2012;82:401–411. [DOI] [PMC free article] [PubMed] [Google Scholar]
- 6. Ding H, Zhang G, Sin KW, Liu Z, Lin RK, Li M, et al. Activin A induces skeletal muscle catabolism via p38beta mitogen‐activated protein kinase. J Cachexia Sarcopenia Muscle 2017;8:202–212. [DOI] [PMC free article] [PubMed] [Google Scholar]
- 7. Verzola D, Bonanni A, Sofia A, Montecucco F, D'Amato E, Cademartori V, et al. Toll‐like receptor 4 signalling mediates inflammation in skeletal muscle of patients with chronic kidney disease. J Cachexia Sarcopenia Muscle 2017;8:131–144. [DOI] [PMC free article] [PubMed] [Google Scholar]
- 8. Zhou J, Liu B, Liang C, Li Y, Song YH. Cytokine signaling in skeletal muscle wasting. Trends Endocrinol Metab 2016;27:335–347. [DOI] [PubMed] [Google Scholar]
- 9. Shintaku J, Peterson JM, Talbert EE, Gu JM, Ladner KJ, Williams DR, et al. MyoD regulates skeletal muscle oxidative metabolism cooperatively with alternative NF‐kappaB. Cell Rep 2016;17:514–526. [DOI] [PMC free article] [PubMed] [Google Scholar]
- 10. Cai D, Frantz JD, Tawa NE Jr, Melendez PA, Oh BC, Lidov HG, et al. IKKbeta/NF‐kappaB activation causes severe muscle wasting in mice. Cell 2004;119:285–298. [DOI] [PubMed] [Google Scholar]
- 11. Liu X, Yu R, Sun L, Garibotto G, Lin X, Wang Y, et al. The nuclear phosphatase SCP4 regulates FoxO transcription factors during muscle wasting in chronic kidney disease. Kidney Int 2017;92:336–348. [DOI] [PMC free article] [PubMed] [Google Scholar]
- 12. Lee D, Goldberg AL. Muscle wasting in fasting requires activation of NF‐kappaB and inhibition of AKT/mechanistic target of rapamycin (mTOR) by the protein acetylase, GCN5. J Biol Chem 2015;290:30269–30279. [DOI] [PMC free article] [PubMed] [Google Scholar]
- 13. Hindi SM, Mishra V, Bhatnagar S, Tajrishi MM, Ogura Y, Yan Z, et al. Regulatory circuitry of TWEAK‐Fn14 system and PGC‐1alpha in skeletal muscle atrophy program. FASEB J 2014;28:1398–1411. [DOI] [PMC free article] [PubMed] [Google Scholar]
- 14. Komander D, Reyes‐Turcu F, Licchesi JD, Odenwaelder P, Wilkinson KD, Barford D. Molecular discrimination of structurally equivalent Lys 63‐linked and linear polyubiquitin chains. EMBO Rep 2009;10:466–473. [DOI] [PMC free article] [PubMed] [Google Scholar]
- 15. Hooper C, Jackson SS, Coughlin EE, Coon JJ, Miyamoto S. Covalent modification of the NF‐kappaB essential modulator (NEMO) by a chemical compound can regulate its ubiquitin binding properties in vitro. J Biol Chem 2014;289:33161–33174. [DOI] [PMC free article] [PubMed] [Google Scholar]
- 16. Mauro C, Pacifico F, Lavorgna A, Mellone S, Iannetti A, Acquaviva R, et al. ABIN‐1 binds to NEMO/IKKgamma and co‐operates with A20 in inhibiting NF‐kappaB. J Biol Chem 2006;281:18482–18488. [DOI] [PubMed] [Google Scholar]
- 17. G'Sell RT, Gaffney PM, Powell DW. A20‐binding inhibitor of NF‐kappaB activation 1 is a physiologic inhibitor of NF‐kappaB: a molecular switch for inflammation and autoimmunity. Arthritis Rheumatol 2015;67:2292–2302. [DOI] [PMC free article] [PubMed] [Google Scholar]
- 18. Djebali S, Davis CA, Merkel A, Dobin A, Lassmann T, Mortazavi A, et al. Landscape of transcription in human cells. Nature 2012;489:101–108. [DOI] [PMC free article] [PubMed] [Google Scholar]
- 19. Guttman M, Amit I, Garber M, French C, Lin MF, Feldser D, et al. Chromatin signature reveals over a thousand highly conserved large non‐coding RNAs in mammals. Nature 2009;458:223–227. [DOI] [PMC free article] [PubMed] [Google Scholar]
- 20. Batista PJ, Chang HY. Long noncoding RNAs. cellular address codes in development and disease. Cell 2013;152:1298–1307. [DOI] [PMC free article] [PubMed] [Google Scholar]
- 21. Clark MB, Mattick JS. Long noncoding RNAs in cell biology. Semin Cell Dev Biol 2011;22:366–376. [DOI] [PubMed] [Google Scholar]
- 22. Guttman M, Donaghey J, Carey BW, Garber M, Grenier JK, Munson G, et al. lincRNAs act in the circuitry controlling pluripotency and differentiation. Nature 2011;477:295–300. [DOI] [PMC free article] [PubMed] [Google Scholar]
- 23. Neguembor MV, Jothi M, Gabellini D. Long noncoding RNAs, emerging players in muscle differentiation and disease. Skelet Muscle 2014;4:8. [DOI] [PMC free article] [PubMed] [Google Scholar]
- 24. Simionescu‐Bankston A, Kumar A. Noncoding RNAs in the regulation of skeletal muscle biology in health and disease. J Mol Med (Berl) 2016;94:853–866. [DOI] [PMC free article] [PubMed] [Google Scholar]
- 25. Wang GL, Iakova P, Wilde M, Awad S, Timchenko NA. Liver tumors escape negative control of proliferation via PI3K/Akt‐mediated block of C/EBP alpha growth inhibitory activity. Genes Dev 2004;18:912–925. [DOI] [PMC free article] [PubMed] [Google Scholar]
- 26. Yu R, Chen JA, Xu J, Cao J, Wang Y, Thomas SS, et al. Suppression of muscle wasting by the plant‐derived compound ursolic acid in a model of chronic kidney disease. J Cachexia Sarcopenia Muscle 2017;8:327–341. [DOI] [PMC free article] [PubMed] [Google Scholar]
- 27. Rashid F, Shah A, Shan G. Long non‐coding RNAs in the cytoplasm. Genomics Proteomics Bioinformatics 2016;14:73–80. [DOI] [PMC free article] [PubMed] [Google Scholar]
- 28. Chen Q, Lu M, Monks BR, Birnbaum MJ, Insulin I. Required to maintain albumin expression by inhibiting forkhead box o1 protein. J Biol Chem 2016;291:2371–2378. [DOI] [PMC free article] [PubMed] [Google Scholar]
- 29. Hughes JM, Salvatori B, Giorgi FM, Bozzoni I, Fatica A. CEBPA‐regulated lncRNAs, new players in the study of acute myeloid leukemia. J Hematol Oncol 2014;7:69. [DOI] [PMC free article] [PubMed] [Google Scholar]
- 30. Fatica A, Bozzoni I. Long non‐coding RNAs: new players in cell differentiation and development. Nat Rev Genet 2014;15:7–21. [DOI] [PubMed] [Google Scholar]
- 31. Ingolia NT, Lareau LF, Weissman JS. Ribosome profiling of mouse embryonic stem cells reveals the complexity and dynamics of mammalian proteomes. Cell 2011;147:789–802. [DOI] [PMC free article] [PubMed] [Google Scholar]
- 32. Yang F, Zhang H, Mei Y, Wu M. Reciprocal regulation of HIF‐1alpha and lincRNA‐p21 modulates the Warburg effect. Mol Cell 2014;53:88–100. [DOI] [PubMed] [Google Scholar]
- 33. Cai H, Xue Y, Wang P, Wang Z, Li Z, Hu Y, et al. The long noncoding RNA TUG1 regulates blood‐tumor barrier permeability by targeting miR‐144. Oncotarget 2015;6:19759–19779. [DOI] [PMC free article] [PubMed] [Google Scholar]
- 34. Long J, Badal SS, Ye Z, Wang Y, Ayanga BA, Galvan DL, et al. Long noncoding RNA Tug1 regulates mitochondrial bioenergetics in diabetic nephropathy. J Clin Invest 2016;126:4205–4218. [DOI] [PMC free article] [PubMed] [Google Scholar]
- 35. Hezroni H, Koppstein D, Schwartz MG, Avrutin A, Bartel DP, Ulitsky I. Principles of long noncoding RNA evolution derived from direct comparison of transcriptomes in 17 species. Cell Rep 2015;11:1110–1122. [DOI] [PMC free article] [PubMed] [Google Scholar]
- 36. Ulitsky I, Bartel DP. lincRNAs: genomics, evolution, and mechanisms. Cell 2013;154:26–46. [DOI] [PMC free article] [PubMed] [Google Scholar]
- 37. von Haehling S, Morley JE, Coats AJS, Anker SD. Ethical guidelines for publishing in the Journal of Cachexia, Sarcopenia and Muscle: update 2017. J Cachexia Sarcopenia Muscle 2017;8:1081–1083. [DOI] [PMC free article] [PubMed] [Google Scholar]
Associated Data
This section collects any data citations, data availability statements, or supplementary materials included in this article.
Supplementary Materials
Data S1. Supporting Information
Data S2. Supporting Information


