

Abstract
Background
Titin is an elastic sarcomeric filament that has been proposed to play a key role in mechanosensing and trophicity of muscle. However, evidence for this proposal is scarce due to the lack of appropriate experimental models to directly test the role of titin in mechanosensing.
Methods
We used unilateral diaphragm denervation (UDD) in mice, an in vivo model in which the denervated hemidiaphragm is passively stretched by the contralateral, innervated hemidiaphragm and hypertrophy rapidly occurs.
Results
In wildtype mice, the denervated hemidiaphragm mass increased 48 ± 3% after 6 days of UDD, due to the addition of both sarcomeres in series and in parallel. To test whether titin stiffness modulates the hypertrophy response, RBM20ΔRRM and TtnΔIAjxn mouse models were used, with decreased and increased titin stiffness, respectively. RBM20ΔRRM mice (reduced stiffness) showed a 20 ± 6% attenuated hypertrophy response, whereas the TtnΔIAjxn mice (increased stiffness) showed an 18 ± 8% exaggerated response after UDD. Thus, muscle hypertrophy scales with titin stiffness. Protein expression analysis revealed that titin‐binding proteins implicated previously in muscle trophicity were induced during UDD, MARP1 & 2, FHL1, and MuRF1.
Conclusions
Titin functions as a mechanosensor that regulates muscle trophicity.
Keywords: Diaphragm, Denervation, Muscle stretch, Hypertrophy, Titin, Mechanosensing
Introduction
Muscle is an exquisitely fine‐tuned biological machine that in response to increased mechanical load increases in size, i.e. muscle cells hypertrophy. The underlying mechanism has been extensively studied in contracting muscles, and calcium‐dependent activation of the calmodulin/calcineurin pathway has been identified as an important mediator of hypertrophy.1, 2 Whether calcium‐independent mechanisms play a role in muscle hypertrophy is poorly understood. Such mechanisms might involve mechanosensory proteins, of which the giant protein titin is an attractive candidate because it forms a continuous filament along the myofibril and contains elastic segments that have been proposed to sense muscle stretch.3, 4, 5 Titin‐based mechanosensing might involve titin‐binding proteins that form several signalling ‘hubs’ along the titin molecule. In line with a mechanosensing role for titin, disruption of two of these hubs depresses muscle gene expression.3, 4 Furthermore, decreasing titin stiffness in the heart blunts hypertrophy development during mechanical overload6 and increasing titin's stiffness has the opposite effect,7, 8 processes that presumably involve titin‐binding proteins (e.g. FHL1/2,5 MARP1–39, 10, 11, 12 and CAPN313, 14). However, the results of these studies are confounded by the fact that not only was titin‐based stiffness altered, so was active force generation,15, 16, 17 which itself modulates muscle growth. Thus, the role of titin‐based mechanosensing in muscle hypertrophy is speculative, due to the lack of appropriate experimental approaches to directly test this role.
The goal of the present study was to establish whether titin‐based mechanosensing per se affects muscle hypertrophy. To this end, we turned to unilateral diaphragm denervation (UDD) which induces a transient but strong hypertrophy response in the denervated, inactive hemidiaphragm.18, 19 This makes UDD ideal for directly testing the role of titin‐based mechanosensing in muscle hypertrophy. UDD was applied in two mouse models in which titin stiffness is genetically altered: the RBM20ΔRRM model. which disables Rbm20 splicing activity of titin RNA, resulting in more compliant titin molecules, and the TtnΔIAjxn model which deletes a small portion of titin, resulting in stiffer titin molecules. We hypothesized that (1) UDD‐associated hypertrophy of the denervated hemidiaphragm is caused by cyclic stretch imposed by the contracting contralateral hemidiaphragm, and (2) the level of hypertrophy depends on the stiffness of titin, with high stiffness resulting in an exaggerated hypertrophy response and low stiffness resulting in an attenuated response. The findings establish UDD as a model to study passive stretch‐induced hypertrophy and support that titin functions as a mechanosensor that modulates muscle hypertrophy.
Methods
Mouse models and unilateral diaphragm denervation
Both RBM20ΔRRM and TtnΔIAjxn mouse models have previously been described.8, 20 Briefly, the RBM20ΔRRM model deletes the RNA recognition motif (exons 6 & 7) of the Rbm20 gene, disabling its splicing function, leading to a longer more compliant titin isoform. The TtnΔIAjxn model deletes the IA junction (exons 251–269) of the Ttn gene, shortening the titin protein and creating a stiffer isoform. We used 3 month old wildtype (WT) and homozygous mice of either genotype (referred to as Δ) on the C57BL6j background to perform UDD surgery. Mice were anaesthetized with a ketamine/xylazine 120/16 mg/kg, a small incision was made in the neck area just above the clavicle. The phrenic nerve was isolated behind the sternohyoid muscle, and a 3–4 mm section was transected at the height of the supraclavicular nerve branch. Mice were closed up and allowed to recover, and were sacrificed 6 days after denervation for morphometric analysis and tissue harvest. All experiments were done in accordance with the University of Arizona Institutional Animal Care and Use Committee and followed the US National Institutes of Health Using Animals in Intramural Research guidelines for animal use.
Diaphragm electromyography and telemetry
Two weeks prior to UDD, WT mice were anaesthetized with 1–3% isoflurane. An incision was made in the abdomen just below the ribcage. The liver was gently moved aside to reveal the diaphragm and the electrodes were glued to the right costal diaphragm near the phrenic nerve innervation. The electrode lead was also sutured to the ribcage to provide stability and prevent electrode interference with diaphragm movement. The telemetry implant HD‐X11 (DSI; St. Paul, USA) was inserted subcutaneously on the back of the mouse and tested for successful recording of EMG signal before closing up the mouse and allowing it to recover. Two weeks after implantation a baseline measurement was taken of unrestrained spontaneously breathing mice, before receiving UDD or Sham surgery as described before. EMG was visualized using Ponemah analysis software (DSI; St. Paul, USA).
Diaphragm echomyography
One day after UDD, mice were anesthetized with 1–3% isoflurane and the abdomen was shaved for diaphragm echo imaging. Mice were maintained at a respiration rate of 140–200 and imaged with a Vevo 2100 Imaging System, MS550D probe (Fujifilm VisualSonics; Toronto, Canada) for murine cardiac imaging, with a frequency of 40 MHz. The probe was put on the abdomen of the mouse, just below the ribcage, at a 45° angle aiming under the thorax, with mild pressure to visualize the diaphragm. Standard B‐mode images of the diaphragm were obtained, using the vena cava as a reference point to consistently image the midcostal region. Images where subsequently analysed using Vevo Strain software (Fujifilm VisualSonics; Toronto, Canada) that measured the strain of the diaphragm (Figure 1C). A reiterated M‐mode image was used to select a single respiration cycle and a 4‐ to 5‐point region of interest was set in the arching region (Figure 1C, dotted‐green line) of the costal diaphragm dome using free curve to measure longitudinal strain.
Figure 1.
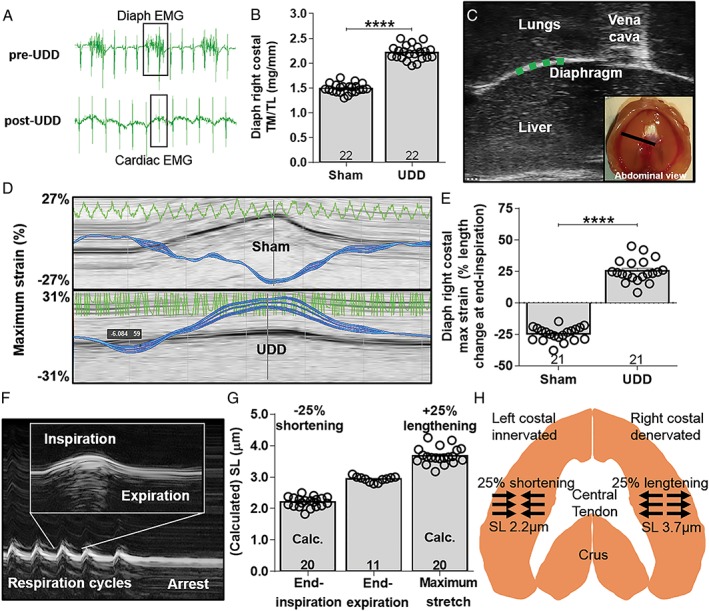
(A) EMG signal from implanted telemetry device showing electrical activity in the right hemi‐diaphragm pre‐UDD (top) and absence of activity post‐UDD (bottom). Data are from the same mouse and confirm successful denervation. Note that both before and after UDD the telemetry device recorded bleed‐through EMG signal from the myocardium. (B) Diaphragm right costal weight normalized to tibia length (TL) from Sham and UDD operated WT mice. UDD induces a strong increase in tissue mass (TM) in the right costal hemidiaphram 6 days post‐UDD. (C) B‐mode image from the right hemidiaphragm, the vena cava was used as reference. The green dotted line denotes the position of strain measurement in the right costal diaphragm. Inset shows an abdominal view of the diaphragm and the black line the plane of B‐mode imaging. (D) Strain analysis showing maximum strain in the contracting right hemidiaphragm (top image; shortening) in Sham mice and stretching in the denervated hemidiaphragm (bottom image; lengthening) in UDD mice. Zero percent represents length at end‐expiration. (E) Maximum strain in the right hemidiaphragm before and after UDD, indicating that after UDD the hemidiaphragm stretches by ~25% during inspiration. (F) Representative M‐mode image of the right costal diaphragm during whole body formaldehyde perfusion, showing arrest during end‐expiration. (G) Sarcomere length in the perfused diaphragm fibres was ~2.9 μm (middle bar), and the strain data (in e) were used to calculate end‐inspiration sarcomere length before (left bar) and after UDD (right bar). (H) Schematic representation of the length changes in the diaphragm after UDD. Bars, mean ± SEM.
Whole body perfusion and sarcomere length measurements
Mice were anaesthetised with a ketamine/xylazine solution, a small incision was made in the neck area where the jugular vein was cannulated and securely tied off. The diaphragm was visualized using echomyography as previously described. M‐mode images were taken before and after perfusion to show the position of the diaphragm at arrest. Mice were perfused with a solution consisting of 4% formaldehyde, with 70 U/mL of heparin in phosphate buffered saline (PBS), after which the diaphragm was removed and stored in 4% formaldehyde in PBS overnight for complete fixation. Diaphragm midcostal strips were gently flattened between glass slides and sarcomere lengths were measured using a He/Ne laser diffraction system.21, 22
Whole body (unrestrained) plethysmography
Mice were put in Buxco FinePointe whole body plethysmography chambers (DSI; St. Paul, USA) and acclimated for a minimum of 2 h to allow the mice to enter a resting state before starting respiratory measurements. Various parameters were recorded, including respiration rate, tidal volume, and minute volume. Data were analysed with Buxco FinePointe software.
Diaphragm fibre passive tension
Diaphragm midcostal sections were skinned overnight in solution containing relaxing solution (in mM; 20 BES, 10 EGTA, 6.56 MgCl2, 5.88 NaATP, 1 DTT, 46.35 K‐propionate, 15 creatine phosphate, pH 7.0), with 1% Triton‐X‐100 at 4°C, and protease inhibitors (phenylmethylsulfonyl fluoride (PMSF), 0.25 mM; leupeptin, 0.04 mM; E64, 0.01 mM, at 4°C), and subsequently stored in a 50% (v/v) glycerol/relax solution at −20°. Single fibres were dissected and mounted with aluminium T‐clips between a length motor (ASI 403A, Aurora Scientific Inc., Ontario, Canada) and a force transducer element (ASI 315C‐I, Aurora Scientific Inc., Ontario, Canada) in a single fibre apparatus (ASI 802D, Aurora Scientific Inc., Ontario, Canada) that was mounted on the stage of an inverted microscope. Sarcomere length was set using a high‐speed VSL camera and ASI 900B software (Aurora Scientific Inc., Ontario, Canada). Passive tension was measured using two protocols: (1). a standard stepwise stretch‐hold protocol (referred to as static stretch), and 2. a stretch‐release protocol (referred to as dynamic stretch), in which fibres were stretched 20 times from sarcomere length 2.9–3.7 μm at a velocity of 5.56 ± 0.49 μm/s/sarcomere, consistent with diaphragm stretch velocity as derived from echomyography analyses (Figure 2A). Fibre cross‐sectional area (CSA) was determined at three points along the fibre, assuming an elliptical cross section. All experiments were performed in relaxing solution with inhibitors. The temperature of the relaxing solution was kept constant at 20°C using a TEC controller (ASI 825A, Aurora Scientific Inc. Ontario, Canada). During the experiment, data were automatically collected by a data acquisition board (sampling rate 10 kHz), figures represent data from the ascending limb of stretch number 20.
Figure 2.
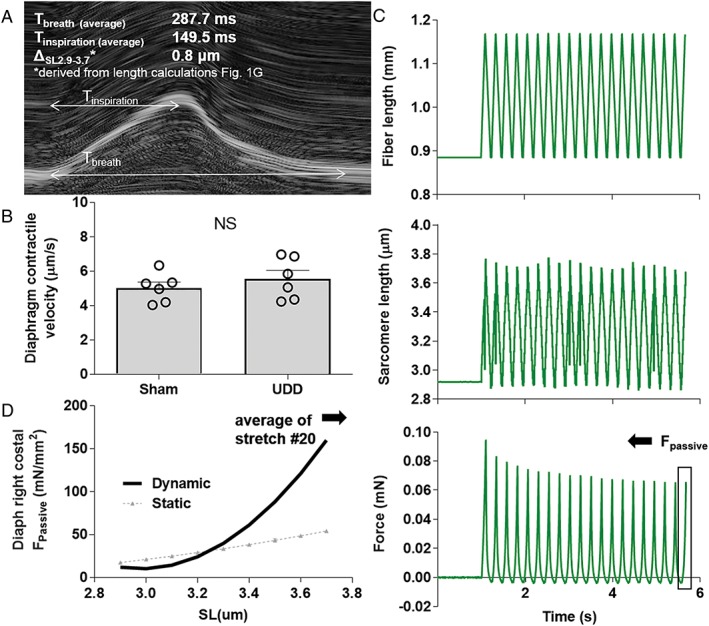
(A) M‐mode image of the left hemidiaphragm during normal inspiration. (B) Using the average inspiration time and the sarcomere length change during inspiration (0.8 μm), contractile velocity of the left hemidiaphragm was determined. (C) We assumed that after UDD the contractile velocity of the left hemidiaphragm equals the stretch velocity of the right hemidiaphragm, and used the derived value (in B) in a stretch‐release protocol imposed on single diaphragm fibres to mimic the kinetics of in vivo stretching of the right hemidiaphragm after UDD. Top: the length change imposed on the muscle fibre during the protocol of 20 stretches; middle: the corresponding sarcomere length change from 2.9– to 3.7 μm; bottom: passive force generated by the muscle fibres (data from the 20th cycle, to account for hysteresis, was used to determine passive tension. (D) Average passive tension (n = 6; 20 fibres) during the 20th stretch. Note that passive tension during this in vivo dynamic protocol is higher compared to that during a static stepwise fibre stretch protocol (grey curve, n = 12; 54 fibres); for protocol comparison see Supporting Information, Figure S1.
Immunohistochemistry/structured illumination microscopy
Diaphragm midcostal sections were stretched to slack length and embedded in Tissue‐Tek O.C.T. compound (Ted Pella Inc.; Redding, USA) and immediately frozen through 2‐methylbutane‐cooled in liquid N2 and then stored at −80°C. Tissue was sectioned into 10 μm thick sections, cross‐ and longitudinal cut, on a Microm HM 550 cryostat (Thermo Scientific; Waltham, USA) and placed on super frost slides. Sections were blocked with 10% goat serum in PBS and incubated overnight with primary antibodies diluted in blocking solution. Primary antibodies were detected with Alexa Fluor conjugated secondary antibodies. Sections were repeatedly washed with PBS for 20 min and incubated with secondary antibodies at room temperature in a dark box for 1 h. Coverslips were mounted onto slides with Fluoromount G (Thermo Scientific; Waltham, USA) and imaged promptly. A Zeiss Axio Imager M1 microscope (Zeiss; Oberkochen, Germany) at ×100 magnification was used to image complete cross sections and ×640 for longitudinal sections along four points of the fibre bundles for sarcomere lengths, and captured using a AxioCam MRc with Axiovision software (Zeiss; Oberkochen, Germany). Images were calibrated using a 0.01 mm stage micrometre (Edmund Optics; Barrington, USA). For MARP1 localization we co‐labelled sections with MARP1, MyHC2x exclusion ab and DAPI (4′,6‐diamidino‐2‐phenylindole), and used ImageJ to generate plot profiles. For CSA and fibre type determination we used serial cut slides stained with three antibody combinations to cover all myosin heavy chain (MyHC) fibre types: (1) Laminin, MyHC1 and MyHC2b; (2) laminin, MyHC2x exclusion ab, pan MyHC; (3) Laminin, MyHC2a (see Supporting Information, Table S1 for further details). MyHC2ax hybrid fibres were determined by overlaying images of slides stained with antibody combinations 2 and 3. All images were analysed by subtracting the laminin stained matrix from the MyHC stain, to demarcate fibre edges, and using the threshold and particle analyser functions in ImageJ, with exclusion criteria set to exclude fibres with a circularity of <0.5 and size smaller than 100 μm2 for MyHC1 and 150 μm2 MyHC2 fibres. Longitudinal sections from the same samples were stained for α‐actinin (see Supporting Information, Table S1) and sarcomere length was determined ~100 μm along the fibres at random locations. Sarcomere lengths were used to normalize the CSA of the fibres to a length of 2.6 μm.
For MARP1 localization, we applied a comparable protocol, except that 4 μm thick longitudinal sections were cut. Sections were permeabilised with 0.2% Triton X‐100 in PBS and placed on a light box to bleach autofluorescence for 10 min, followed by a 1 h blocking step in 2% fetal bovine serum in PBS. Antibodies directed against MARP1, titin's N2A segment and α‐actinin (see Supporting Information, Table S1) were diluted in the blocking solution and stained at 4°C overnight. Sections were washed four times in cold PBS and incubated for 3 h with appropriated secondary antibodies (see Supporting Information, Table S1). After washes in cold PBS, sections were covered with Vectashield Antifade Mounting Medium (H‐1000, Vector laboratories, Burlingame, USA) and covered with precision coverslips (1.5H, thickness: 170 μm, Bioscience tools; San Diego, USA). Slides were imaged with a Zeiss Elyra S.1 (Zeiss; Oberkochen, Germany) structured illumination microscope (SR‐SIM), using an α‐Plan‐APO 100x/1.46 Oil objective, solid‐state lasers (488/561/642 nm) and a sCMOS camera. All images were channel‐aligned using a slide with 0.2 μm T7280, TetraSpeck Microspheres fluorescent beads (Invitrogen Molecular Probes; Eugene, USA). Images were captured with Zen 2.3 (Zeiss Microscopy; Jena, Germany) software using the same scanning intensities for all images. Image stacks were acquired with 0.101 μm Z‐steps, five angles and five phases/angle for each slice and SIM processed. ImageJ was used to derive colour plot profiles using an RGB profiler plugin.
The number of sarcomeres in series
Diaphragm right midcostal regions were excised and fixed for 24 h in 4% formaldehyde, 11 mM thymol, fortified with 15% ethanol in distilled water. After stringent washes with distilled water diaphragm strips were incubated in 26% HNO3 for 4 h to dissolve the extra‐cellular matrix. HNO3‐treated diaphragm strips were washed in distilled water and stored in 50% glycerol for 7–14 days before fibre bundle isolations started.23 Small fibre bundles were isolated with microforceps and transferred to glass slides for visualization. Fibre bundles were imaged with a Zeiss Axio Imager M1 microscope (Zeiss; Oberkochen, Germany) at ×50 magnification for total fibre length, and ×640 at four points along the fibre bundles for sarcomere length, and captured using a AxioCam MRc with Axiovision software (Zeiss; Oberkochen, Germany). Images were analysed using ImageJ, measuring complete bundle length as well as determining the number of sarcomeres using 1D plot profile within a minimum of 200 μm of the fibres, to define the total number of sarcomeres in series.
SDS gel electrophoresis, western blotting, and titin mobility gels
The ventral part of the diaphragm right costal were flash‐frozen in liquid nitrogen and stored at −80°C. Tissue was ground to a fine powder using Dounce homogenizers cooled in liquid nitrogen and acclimated to –20°C for 30 min before continuing. Tissue powder was resuspended in a 1:1 mixture of an 8 M urea buffer (in M; 8 urea, 2 thiourea, 0.05 Tris–HCl, 0.075 dithiothreitol, as well as 3% SDS and 0.03% bromophenol blue, pH 6.8) and 50% glycerol containing protease inhibitors (in mM; 0.04 E‐64, 0.16 leupeptin, and 0.2 PMSF). The solutions were mixed for 4 min, followed by 10 min of incubation at 60°C. Samples were centrifuged at 12.000 rpm and the supernatant was divided into smaller aliquots and flash frozen for storage at −80°C. SDS‐agarose (SDS‐AGE) 1% were run on in a Hoefer SE600X vertical gel system (Hoefer Inc; Holliston, USA) was used to electrophoretically separate titin from other proteins.24 Gels were run at 15 mA per gel for 3 h and 15 min, then stained using Neuhoff's Coomassie brilliant blue staining protocol, scanned using a commercial scanner (Epson 800, Epson Corporation, Long Beach CA). For titin size estimations in the mouse models, we essentially ran the same protocol with the addition of co‐migrating the samples with: human soleus N2A (3700 kDa), human cardiac (N2B 3000 kDa, N2BA 3300 kDa) and mouse RBM20Δ cardiac (N2BA 4000kDA, largest known titin isoform) samples, in the same lane and using imageJ to measure the migration distance of the reference samples relative to MyHC. By taking the logarithm of the migration distance of the reference samples, an exponential fit could be used to calculate the relative size of mouse wildtype, diaphragm RBM20ΔRRM and TtnΔIAjxn titin.
Titin binding and Z‐disc associated proteins: MARP1–3, CAPN3, MuRF1 & 2, FHL1 & 2, MYPN, CaM, Csrp3, CaN and Ldb3, were quantified using western blot. MyHC levels were determined from Coomassie stained initial gels to determine equalized loading for each sample. Samples were run on 10% acrylamide gels at 100 V for 1.5 h and subsequently transferred onto Immobilon‐P PVDF 0.45 μm membranes (Millipore, Billerica, USA) using a Trans‐Blot Turbo Transfer System (Bio‐Rad, Hercules, USA) for 30 min at 1.0 A. Membranes were incubated with primary antibodies (see Supporting Information, Table S1) at 4°C overnight. IR Western blots were analysed using Odyssey Infrared Imaging System (Li‐Cor Biosciences, USA). All proteins were normalized against GAPDH, and subsequently UDD samples were normalized to Sham diaphragms to determine relative changes in protein quantity.
Statistics
All data were analysed using Graphpad Prism software, using unpaired t‐tests (Figure 1, 2), nonlinear regression (Figures 2, 3), or 2‐way ANOVA (Figures 3, 4, 5) if applicable. The significance in nonlinear regression represents the difference in fit between equations, an extra sum‐of‐squares F test determined whether the data sets differed from each other. The following symbols indicate significance in the figures: *P < 0.05, **P < 0.01, ***P < 0.001, ****P < 0.0001 and interaction factor from 2‐way ANOVA is represented as: # P < 0.05, ## P < 0.01, ### P < 0.001, #### P < 0.0001 vs. results from Sham diaphragms.
Figure 3.
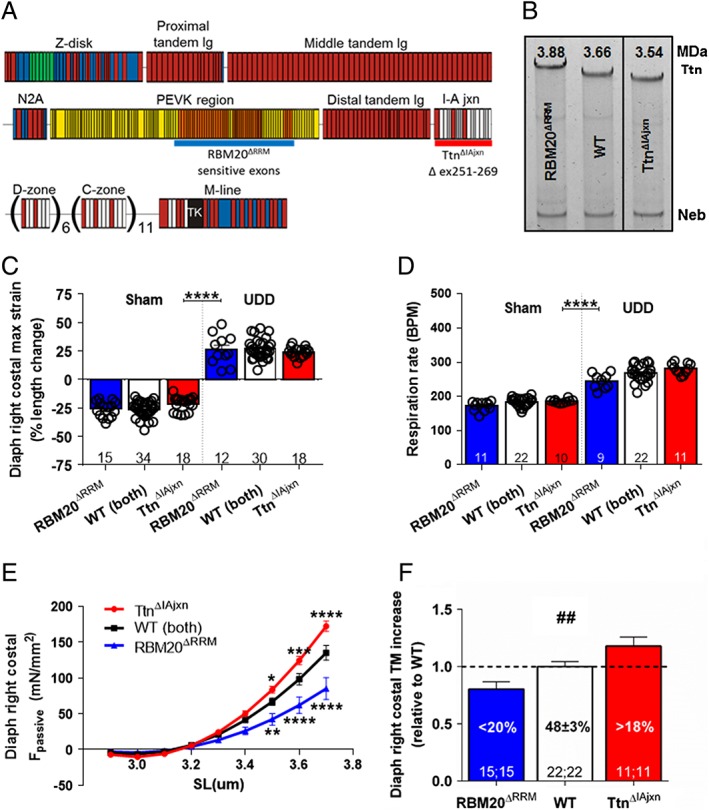
(A) Domain structure of titin in skeletal muscle. Immunoglobulin (Ig)‐like domains in red; fibronectin type III (Fn) domains in white; PEVK in yellow; titin kinase in black; unique sequence in blue. The exons targeted for insertion in RBM20ΔRRM model (orange exons, approximation of RBM20 splice targets; underlined blue) and deletion in the TtnΔIAjxn mouse model (underlined red). (B) These deletions result in a difference in titin (Ttn) migration, relative to nebulin (neb) on SDS‐AGE (note that TtnΔIAjxn sample was not co‐migrated next to WT sample, hence the black line separation, however they were run on the same gel. For titin size estimation, see text. (C) Maximum strain in the denervated hemidiaphragm was not different between RBM20ΔRRM, TtnΔIAjxn, and wt mice after UDD. (D) Similarly, respiration rate (i.E. strain rate) in the denervated hemidiaphragm was not different between conscious RBM20ΔRRM, TtnΔIAjxn, and wt mice after UDD. Tidal and minute volume were also unaffected by the genotype, see Supporting Information, Figure S2. (E) Passive tension, as determined by the stretch‐release protocol, was significantly lower in the RBM20ΔRRM mice (n = 4; 13 fibres) and higher in the TtnΔIAjxn (n = 4; 13 fibres) mice compared to WT mice (n = 6; 19 fibres). (F) the increase in diaphragm right costal (denervated) tissue mass (TM) after UDD is attenuated in the RBM20ΔRRM mice and exaggerated in the TtnΔIAjxn mice (n = Sham; UDD). Graphs represent mean ± SEM.
Figure 4.
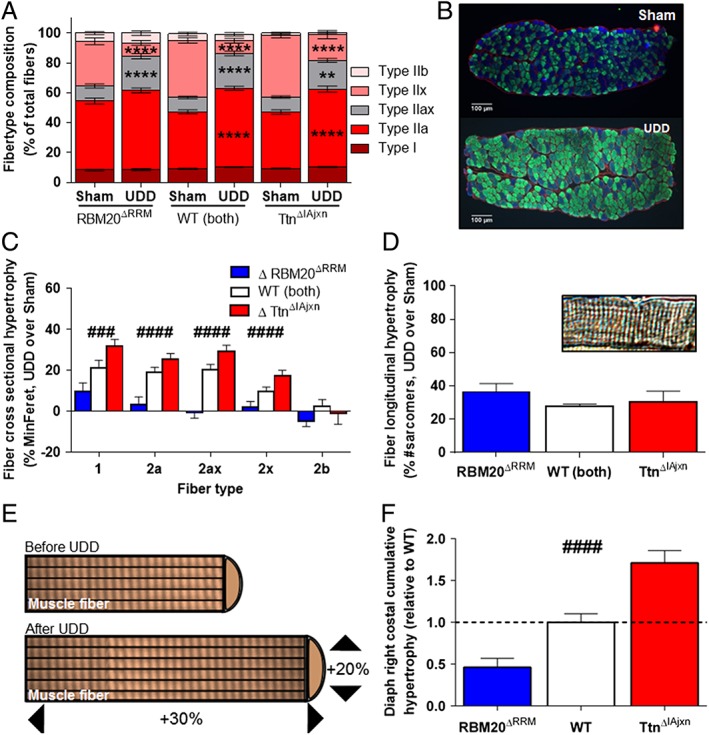
(A) Fibre type composition before and after UDD. Note that UDD induces a shift toward slower fibre types (WT: n = 21 mice; RBM20ΔRRM: n = 14; TtnΔIAjxn: n = 11); (B) representative cross sections of right costal diaphragm in Sham and UDD mice. Red = ɑ‐laminin, blue = ɑ‐type 2x fibres, green = ɑ‐type 1 & 2a fibres. (C) Changes (%) in MinFeret after UDD in WT (n = 20), RBM20ΔRRM (n = 13) and TtnΔIAjxn (n = 9) mice compared to Sham mice. Note the differential response in the two titin models. (D) Effect of UDD on the number of sarcomeres in series; top right: representative fibre segment used for assay. (E) Schematic illustration showing the nature of the diaphragm fibre hypertrophy after UDD. (F) The cumulative hypertrophy (longitudinal combined with cross‐sectional hypertrophy) accounts for the mass increase observed in Figure 3F. Graphs represent mean ± SEM.
Figure 5.
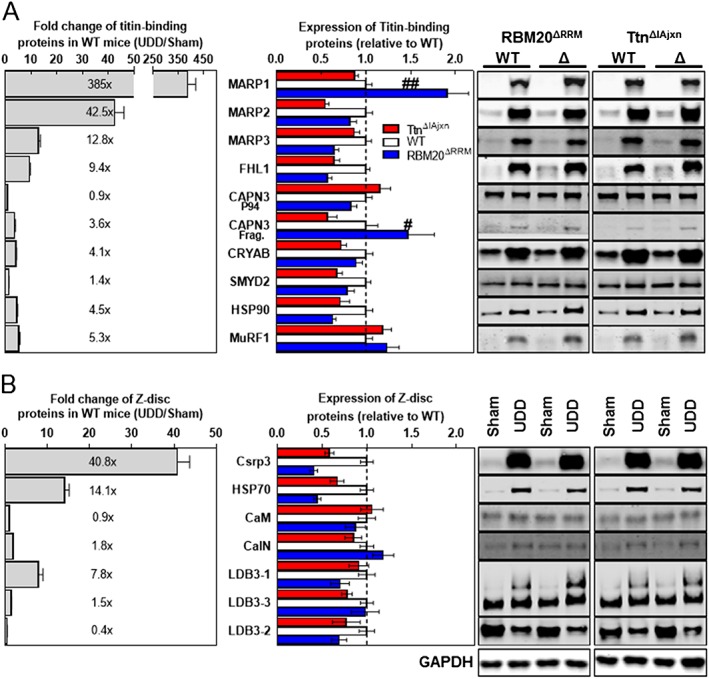
(A) Left panel: Several titin‐binding proteins are upregulated after UDD (grey bars; levels normalized to GAPDH levels; n = 15–18). Middle panel: MARP1 and CAPN3 are differentially upregulated in the two titin models, with exaggerated upregulation in the RBM20ΔRRM (blue bars) and attenuated upregulation in the TtnΔIAjxn model (red bars); n = 9 for the titin models. Right panel: Representative images of the corresponding western blots. We also probed for FHL2, MuRF2 and MYPN, but these were undetectable in both Sham and UDD samples. (B) Upregulation of z‐disc proteins after UDD (left panel, grey bars; levels normalized to gapdh levels; n = 17). Note that none of these proteins was differentially upregulated in the two titin models (middle panel). Left panel shows the corresponding western blots.
Results
Unilateral diaphragm denervation induces cyclic stretch and hypertrophy in passive muscle
To establish UDD as a model for stretch hypertrophy, we first corroborated previous observations that severing one (of two) phrenic nerve leads to paralysis and hypertrophy of the hemidiaphragm.25, 26, 27, 28 We transected the right phrenic nerve and using an implanted telemetry device, measured electrical activity in the right costal before and after UDD to confirm denervation. Before denervation the telemetry device recorded a steady electromyography (EMG) signal consistent with diaphragm muscle activity (Figure 1A; pre‐UDD), which disappeared after transecting the right phrenic nerve (Figure 1A; post‐UDD). To assess the effect of UDD on muscle mass, the right costal diaphragm was dissected 6 days after denervation (the peak of the transient hypertrophy25, 27) and we observed a significant increase in wet tissue mass (48.2 ± 6.6% vs. Sham) (Figure 1B). Skeletal muscle denervation is usually associated with atrophy, and we hypothesized that the hypertrophic response of the denervated right hemidiaphragm is caused by cyclic passive stretch imposed by the contracting contralateral hemidiaphragm. To determine whether the denervated hemidiaphragm stretches during inspiration, we used echomyography in combination with strain analysis in the costal diaphragm. We observed that a contracting costal diaphragm shortens 24.8 ± 1.2% during inspiration and that the denervated hemidiaphragm antagonistically lengthens during inspiration by 25.4 ± 2.0% (Figure 1C–E). Thus, UDD results in cyclic stretch of the denervated right hemi‐diaphragm and induces a marked hypertrophic response.
High passive tension in stretched diaphragm fibres during UDD
The determined strain amplitude in the denervated hemidiaphragm suggests that passive tension development is substantial during inspiration. To determine the effect of diaphragm strain on passive tension development, we first measured the sarcomere length in diaphragm strips dissected from mice that received whole body perfusion fixation, with the diaphragm fixed at end‐expiration (as determined by echomyography; Figure 1F). Sarcomere length in the right costal diaphragm was 2.93 ± 0.04 μm (Figure 1G). Next, we used the end‐expiration sarcomere length and the strain measured during UDD (i.e. maximum stretch, Figure 1E) to calculate the sarcomere length range during the respiration cycle. Results indicate that during inspiration the non‐denervated hemidiaphragm contracts to 2.20 ± 0.04 μm and the denervated hemidiaphragm is stretched to a sarcomere length of 3.68 ± 0.06 μm (Figure 1G, left and right bars, respectively). Figure 1H shows a schematic of the length change of the denervated right hemi‐diaphragm during inspiration. The passive tension generated during stretch of the denervated hemidiaphragm was measured in permeabilized diaphragm fibres that underwent a stretch‐release protocol similar to that determined in vivo (for details, see Methods, Figure 2 and Supporting Information, Figure S1). This protocol was designed to mimic in vivo diaphragm kinetics (stretch velocity of 5.6 μm/s, 3 ms hold, release velocity of 6.4 μm/s, 20 ms hold; based on echomyography (Figure 2A, B), and sarcomere length change from 2.9 to 3.7 μm). Passive tension at sarcomere lengths that represent those at maximum stretch (3.7 μm; end‐inspiration) were 135.0 ± 25.8 mN/mm2 and those at end‐expiration (SL 2.9 μm) 17.5 ± 7.1 mN/mm2 (Figure 2D). Thus, cyclic stretch after UDD leads to development of high passive tension in the denervated hemidiaphragm. Titin being an important contributor to passive tension generation in striated muscle, and a protein implicated in mechanosensing activity, we hypothesized that titin‐based passive tension modulates the stretch‐induced hypertrophy in the denervated hemidiaphragm after UDD.
Titin based tension modulates stretch‐induced hypertrophy
To assess whether titin‐based passive tension plays a role in passive stretch‐induced hypertrophy, we used two mouse models with changes in titin‐based passive tension. First, a model in which RBM20 splicing activity is disabled (the RBM20ΔRRM mouse model), increasing titin isoform size by ~220 kDa (as determined by titin mobility shift in SDS‐AGE gels, Figure 3A,B). Second, a model in which titin's IA junction region is deleted (the TtnΔIAjxn mouse model), decreasing titin size by ~120 kDa (Figure 3A,B). We hypothesized that an increase in titin isoform size (and the concomitant reduction in passive tension) reduces the hypertrophy response to passive stretch and, vice versa, that a decreased titin isoform size (and the concomitant increase of passive tension) increases the hypertrophic response.
First, we tested whether the diaphragm strain after UDD was comparable between the two models: echomyography analysis after UDD showed ~25% lengthening of the denervated hemi‐diaphragm during inspiration in both models (Figure 3C). No differences were observed in respiratory parameters after UDD, as measured with unrestrained whole body plethysmography: both models showed a comparable decrease in tidal volume, and a comparable increase in respiratory rate (Figure 3D) and minute volume after UDD, (Supporting Information, Figure S2). Thus, the effect of UDD on diaphragm strain and strain rate (i.e. respiratory) was comparable in wildtype, RBM20ΔRRM and TtnΔIAjxn mice.
To assess the effect of UDD on passive tension generation in these models, we repeated the stretch‐release protocol and found that passive tension was lower in RBM20ΔRRM mice and increased in the TtnΔIAjxn mice (in‐line with the larger and smaller titin isoform size, respectively), compared to wildtype mice (Figure 3E). Importantly, these differential changes in passive tension during stretch were associated with differential changes in costal tissue mass after 6 days UDD: in wildtype mice the mass increase was 48.2 ± 6.6% in UDD vs. Sham. This hypertrophy response was attenuated by 20% (40.5 ± 3.2% increase vs. Sham) in the RBM20ΔRRM model, and was exaggerated by 18% in the TtnΔIAjxn model (54.3 ± 3.6% increase vs. Sham) (Figure 3f). The denervated right crus leaf (a region of the hemidiaphragm that has a distinctly different fibre direction compared to the costal region) showed no signs of mass increase after 6 days (Supporting Information, Figure S3), further supporting the notion that stretch induces mass increase, with titin being a modifier in a passive tension dependent manner.
Titin‐based passive tension affects stretch‐induced hypertrophy of diaphragm fibres
To assess that the tissue mass increase was due to an increase in diaphragm fibre size, we performed immunohistochemistry on cryosections to determine fibre CSA per fibre type. MinFeret measurements revealed a fibre size increase after UDD in most fibre types, with the most pronounced increase in type 1, 2a, and the hybrid 2a/2x fibres (Figure 4A–C; for more detail see Supporting Information, Table S2). Two‐way ANOVAs for the individual fibre types revealed a significantly different response in the different genotypes, with an attenuated increase in minFeret in diaphragm fibres of the RBM20ΔRRM mice when compared to wildtype mice, and an exaggerated increase in the TtnΔIAjxn mice (Figure 4C). UDD elicited a shift in fibre type toward type 2a‐like fibres at the cost of 2x fibres (Figure 4A,B). This shift was comparable in wildtype and TtnΔIAjxn mice, but different in RBM20ΔRRM mice which had a higher presence of type 2a fibres before UDD (Figure 4A).
The increase in fibre size and the fibre type shift combined cannot fully explain the increase in tissue mass. To evaluate whether UDD also results in longitudinal hypertrophy, we isolated full length fibre bundles (from central tendon to rib cage) from Sham and UDD mice, and determined the number of sarcomeres in series. This revealed that after 6 days of UDD, the number of sarcomeres in series had increased by ~30%. The extent of this increase was comparable between wildtype, RBM20ΔRRM and TtnΔIAjxn mice (Figure 4D and Supporting Information, Table S2). The combined changes in CSA, fibre type and sarcomeres in series accounts for the increase in tissue mass after UDD (Figure 4E). Importantly, this cumulative hypertrophic response was attenuated in RBM20ΔRRM and exaggerated in TtnΔIAjxn compared to wildtype mice (Figure 4F), with the differential response between the models mainly caused by differential changes in fibre CSA.
The changes in hypertrophy coincided with high upregulation of both titin‐binding proteins and Z‐disc associated proteins (Figure 5A,B, grey bars), both mechanosensors implicated in trophic signalling. Of these proteins, only the titin‐binding proteins MARP1 (P = 0.0014) and CAPN3 autolytic fragment (P = 0.0379) were differentially regulated, with higher levels in the RBM20ΔRRM model and lower levels in the TtnΔIAjxn model (Figure 5A, blue and red bars, respectively). Z‐disc associated proteins such as Csrp3 and CalN, although upregulated, were insensitive to titin‐based passive stiffness (Figure 5A, blue and red bars, respectively), suggesting that Z‐disc mechanosensing operates independent of passive tension and does not determine the extent of hypertrophy, further supporting the concept that titin is a mechanosensor that modulates stretch hypertrophy. To account for altered splicing of other proteins than titin in RBM20ΔRRM mice, which might affect hypertrophy development and confound the results, we targeted two known splice targets of RBM2029, 30: FHL1 and LDB3 (Figure 5). LDB3 isoform levels in RBM20ΔRRM mice are not significantly different from wild type mice in Sham‐operated mice, and also not after UDD. In Sham‐operated mice, FHL1 levels are higher in the RBM20ΔRRM mice compared to wild type mice, however the same is true in the TtnΔIAjxn mice, and although the relative levels of FHL1 in UDD‐operated mice are lower the total FHL1 levels do not differ between wild type, RBM20ΔRRM and TtnΔIAjxn mice. This suggests that the higher FHL1 levels are not related to altered splicing by Rbm20 and that FHL1 does not directly regulate the extent of hypertrophy development.
To evaluate the localization of MARP1, we performed immuno‐labelling on diaphragm cross sections with MARP1 antibodies. These studies revealed that in Sham‐operated mice MARP1 signal was low and nonspecific in nature, with random distribution in the fibres and non‐detectable signal in western blot (Figure 5A). Following UDD, MARP1 primarily localizes to the sarcomere and cytosol (Figure 6A–F), with minor signal in the nucleus (Figure 6F). To determine the sarcomeric localization with high spatial resolution, we applied super‐resolution microscopy on longitudinal sections and localized MARP1 to the N2A‐segment of titin (Figure 6G–P).
Figure 6.
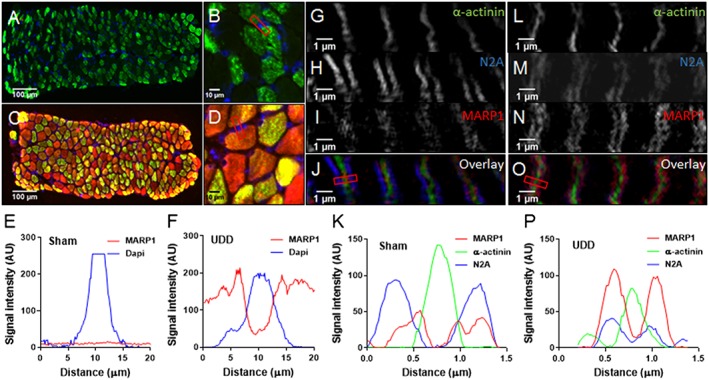
Cross sections stained for MARP1 (red), BF‐35 (green; MyHC2x exclusion) and DAPI (blue), showing absence of MARP1 signal in Sham‐operated mice (A; n = 4) and myofilament/cytosol localization in mice after UDD (B; n = 4). No MARP1 nuclear localization was observed in Sham‐operated mice (C) and in mice after UDD (D); plot profiles of representative images illustrate the absence of MARP1 in nuclei in Sham‐operated mice (E) and in mice after UDD (F). Using SIM, we determined that after UDD MARP1 (red) localizes to the N2A‐segment of titin (blue), visualized as doublets flanking the z‐disc (α‐actinin; green). Representative images of Sham‐operated mice (G–J) and mice after UDD (I‐O), with plot profiles [(K) and (P)] showing the co‐localization of MARP1 and N2A (n = 3).
Discussion
In this work it was tested whether titin‐based mechanosensing modulates muscle hypertrophy. We used unilateral diaphragm denervation, an in vivo model that induces rapid, massive hypertrophy of the denervated diaphragm. A unique feature of UDD is that the hypertrophy develops in the absence of calcium‐cycling. This is in contrast to limb muscle hypertrophy models, in which hypertrophy is induced by mechanical overload and mediated by calcium‐dependent activation of the calmodulin/calcineurin pathway.1, 2 Hence, the mechanism underlying hypertrophy in the UDD surgery model could be fundamentally different from limb muscle models. Our results show that UDD‐induced hypertrophy is caused by cyclic stretch of the diaphragm and that the extent of the hypertrophy is dictated by titin‐based passive stiffness: high stiffness results in a stronger hypertrophic response and low stiffness in an attenuated response. These findings support that titin is a mechanosensing protein that modulates muscle hypertrophy.
Muscle cyclic passive stretching and hypertrophy
UDD is known to induce a transient hypertrophy,18, 19 yet, the trigger for this hypertrophy response was unknown. We show that this trigger is the passive, cyclic stretch of the denervated hemidiaphragm, imposed by the contracting contralateral diaphragm. A role for neural growth factors is unlikely as hypertrophy did not develop following bilateral diaphragm denervation (data not shown). Diaphragm length changes were established by measuring the spatial movement of echo‐sensitive speckles along the costal diaphragm fibres, i.e. strain analysis (Figure 1). This measurement is independent of diaphragm curvature, providing a non‐invasive method for measuring muscle shortening or lengthening. In Sham‐operated mice, we observed ~25% shortening of the costal diaphragm during inspiration (Figure 1C–E), a percentage that is consistent with recent studies on human diaphragm.31 Combining the echomyography findings with the measured sarcomere length at end‐expiration (2.9 μm; Figure 1F–H; note that similar end‐expiratory sarcomere lengths have been reported in other mammals32, 33) suggest that in diaphragm of mice the operating sarcomere length range is ~2.2–2.9 μm during normal breathing (Figure 1F). UDD caused stretch of the denervated diaphragm fibres during inspiration, with sarcomere length extending by 25%, from 2.9 to 3.7 um. Importantly, this strain in the denervated hemidiaphragm was comparable between RBM20ΔRRM, TtnΔIAjxn and wild type mice (Figure 3C), indicating that the ‘pulling force’ exerted by the innervated hemidiaphragm was not affected by the changes in titin isoform size. Thus, the differential hypertrophy response in the mouse models is not caused by differential passive stretch of the denervated diaphragm fibres.
Static stretch of active muscle is known to induce increases in muscle mass by increasing the number of sarcomeres in series, i.e. longitudinal hypertrophy.34, 35, 36 The current findings show that cyclic stretch of passive muscle is a strong stimulus for longitudinal growth of muscle fibres. This growth is expected to reduce the strain on the sarcomeres during stretch and to restore thick‐thin filament overlap. Indeed, immediately after the UDD surgery we determined that the muscle fibres contain ~3200 serially‐linked sarcomeres (Supporting Information, Table S2) that are stretched to a sarcomere length of ~3.7 μm at end of inspiration. This corresponds to fibre a length at end of inspiration of 3200 × 3.7 μm, or 11840 μm. Our findings show that after 6 days of UDD, the number of sarcomeres has increased to ~4100. Assuming a similar total fibre length, this corresponds to an end‐inspiration sarcomere length of 11840/4100, or 2.9 μm, i.e. at end‐inspiration the denervated sarcomere length is now the same as that of the innervated diaphragm. This adaptation in sarcomere length also explains the transient nature of hypertrophy: as sarcomere length normalizes due to the addition of sarcomeres in series, the hypertrophic stimulus diminishes. Interestingly, the increased muscle mass was not only caused by addition of sarcomeres in series but also by addition of sarcomeres in parallel (cross‐sectional hypertrophy). The increase in cross‐sectional area is another mechanism to reduce sarcomere strain by increasing the resisting force of the muscle fibre during stretch.
Titin‐based mechanosensing modulates hypertrophy
Our findings show that titin‐based passive tension modulates the hypertrophy response during passive muscle stretch (Figures 3F and 4). There are multiple previous studies that support titin mechanosensing activity through the elastic cardiac‐specific N2B element, where hypertrophy seems to be regulated through the four‐and‐a‐half LIM domains proteins (FHL) and the mitogen‐activated protein kinases (MAPK).4, 5, 37, 38 Also deletion of the serine/threonine kinase (TK) domain of titin results in hypertrophy in the heart39 and deletion of part of the skeletal muscle elastic N2A domain results in severe dystrophy,40 highlighting the importance of the various titin signalling hubs in muscle growth. However, these studies were performed in intact, contracting muscle. Consequently, the results might be confounded by the presence of calcium cycling: calcium binds to the PEVK spring‐domain of titin, changing its stiffness,15, 16, 17 and titin‐based stiffness modulates contractility20, 41, 42, 43, 44 which in turn might affect muscle growth. The importance of the current findings is that they show that the effects of titin‐based mechanosensing occur independent of contractile activity, and can be ascribed to titin's elastic properties. The differential hypertrophy response in the two models with altered titin stiffness was not due to changes in muscle strain (Figure 3C) or in respiration frequency (Figure 3D), showing that titin stiffness directly modulates the hypertrophy response at the sarcomere level. Interestingly, titin stiffness modulates cross‐sectional hypertrophy of muscle fibres, more than longitudinal hypertrophy (Figure 4). We speculate that the longitudinal hypertrophy, presumably driven by the need to maintain optimal thick‐thin filament overlap, requires a second sensor in addition to titin. The z‐disc might be such a sensor, as multiple of its signalling proteins (Figure 5B) are upregulated in response to UDD, albeit independent of titin stiffness. In particular, cysteine and glycine‐rich protein 3 (Csrp3; muscle LIM protein; MLP) showed strong upregulation and has been linked to both z‐disc‐ and costamere‐based hypertrophy signalling.45 Another potential sensor might be the m‐band, where both the titin kinase domain and obscurin form a mechanosensing complex.3, 46 We observed upregulation of m‐line proteins CAPN3 and MuRF1 (Figure 5A), with the latter regulated independent of titin stiffness. Future studies are needed to resolve the intricacies of longitudinal hypertrophy following passive stretch.
To study how titin stiffness modulates cross‐sectional hypertrophy during cyclic, passive muscle stretch, we probed several titin‐binding proteins, focusing on titin's N2A region. Two of these proteins, CAPN3 and MARP1 (Figure 5A), were differentially upregulated in the two mouse models with altered titin stiffness, suggesting that they might play a central role. Normally, MARP1 is expressed at low‐to‐undetectable levels in skeletal muscle,47 but during UDD the levels massively increase (385‐fold, Figure 5A). This upregulation was exaggerated in the RBM20ΔRRM model (1.9 ± 0.2 fold) and attenuated in the TtnΔIAjxn model (0.9 ± 0.1 fold; relative to wildtype upregulation) (Figure 5A). MARP1 binds to titin's elastic N2A region (Figure 6). MARP proteins have been proposed to be stretch responsive9 and have been implicated in hypertrophy signalling, through interaction with the Erk‐GATA4 complex.48 As following UDD MARP1 shows no evidence of nuclear localization (Figure 6A–F), therefore interaction with GATA4 is unlikely. However, by binding to titin's N2A region (Figure 6G–P), MARP1 might increase titin‐based stiffness, cross‐link titin filaments12, 49 to sterically hinder signalling, or even form a scaffold for other binding proteins to facilitate N2A‐based hypertrophy signalling. Binding of MARP1 to titin's N2A segment might be facilitated by the differential upregulation of CAPN3, which in its active state (autolytic fragments) is capable of cleaving MARP1, thereby increasing its binding affinity to titin N2A.9 Thus, titin stiffness modulates muscle trophicity, and we propose hypertrophy signalling intimately involves titin's I‐band region and its binding partners (Figure 7 ).
Figure 7.
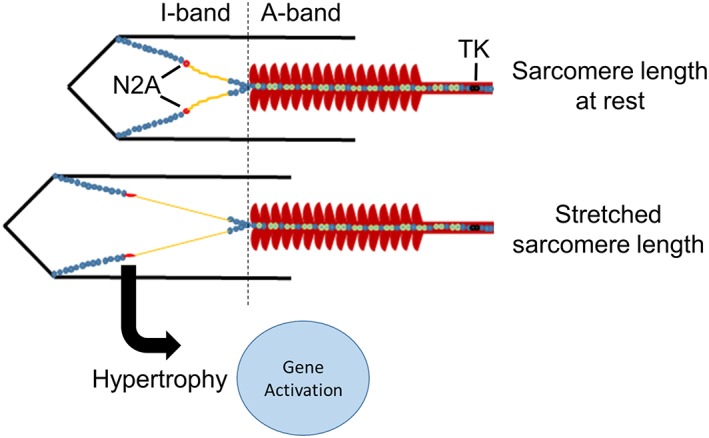
Titin‐based mechanosensing model for muscle trophicity, wherein hypertrophy signalling is induced by muscle stretch and regulated through titin‐binding proteins in the I‐band region. TK denotes kinase‐domain.
Conclusions
In conclusion, the findings of the present study establish that titin‐based mechanosensing modulates muscle hypertrophy. Cyclic, passive muscle stretch induces diaphragm hypertrophy, both longitudinally and cross‐sectionally, and is dependent on titin stiffness. Cyclic stretch of skeletal muscle to long sarcomere lengths (as occurred during UDD) may not occur during daily‐life activities. However, it is likely that the increase in titin‐based passive tension that is associated with the normal operating sarcomere length range in contracting muscle (with sarcomere length changes from 2.2–2.9 μm in the murine diaphragm (current study) and in human skeletal muscle from ~2.8 to 3.4 μm50, 51 is sufficient to activate mechanosensing activity. Furthermore, a similar mechanism might be activated in peripheral muscle where passive stretch is often induced by activated antagonist muscles. Finally, from a clinical perspective, passive muscle stretch might prove an applicable therapeutic strategy during conditions associated with rapid decrease of muscle mass. For example, to combat ICU‐acquired muscle weakness which develops in critically ill patients following long periods of muscle inactivity.52 Indeed, studies in large animal models suggest that passive muscle stretch spares muscle mass during inactivity.53
Conflict of interest
Robbert van der Pijl, Joshua Strom, Stefan Conijn, Johan Lindqvist, Siegfried Labeit, Henk Granzier, and Coen Ottenheijm declare that they have no conflict of interest.
Supporting information
Figure S1. Comparison of dynamic vs. static stretch protocols for passive tension determination in permeabilized diaphragm fibres. (A) Left: Stepwise increase in fibre length. Right: Fibre length change corresponding to the in vivo diaphragm kinetics and sarcomere length changes during UDD as determined by echomyography. (B) The corresponding changes in sarcomere length in the fibres. (C) The corresponding passive force. (D) Plateau forces from the static protocol (C; left) are lower than forces at the same sarcomere length during the stretch‐release protocol (C; right), highlighting the importance of in vivo stretch speed in passive tension development.
Figure S2. Whole body plethysmography in the titin models. Respiration frequency (A), tidal volume (B), and (C) minute volume during UDD were not affected by the genotype of the mice. Graphs represent mean ± SEM.
Figure S3. Tissue mass changes of the whole diaphragm and various regions of the diaphragm (excluding the right costal) after UDD. (A) Whole diaphragm tissue mass (TM; normalized to tibia length (TL)) is increased after UDD in all genotypes, which reflects the increase in mass of the denervated right costal (Figure 1b). (B) The innervated left costal and right crus (C) do not hypertrophy after UDD. (D) The mass of the left (innervated) crus increases in WT and in TtnΔIAjxn mice after UDD. Graphs represent mean ± SEM.
Table S1 Supporting information
Table S2 Supporting information
Supporting info item
Acknowledgements
Support was provided to Coen Ottenheijm by National Institutes of Health grant R01HL121500. This project was supported by MSCA‐RISE‐2014 project 645648 (Muscle Stress Relief), and the Foundation Leducq (network 13CVD04). The authors certify that they comply with the ethical guidelines for authorship and publishing of the Journal of Cachexia, Sarcopenia and Muscle.54
van der Pijl, R. , Strom, J. , Conijn, S. , Lindqvist, J. , Labeit, S. , Granzier, H. , and Ottenheijm, C. (2018) Titin‐based mechanosensing modulates muscle hypertrophy. Journal of Cachexia, Sarcopenia and Muscle, 9: 947–961. 10.1002/jcsm.12319.
References
- 1. Semsarian C, Wu MJ, Ju YK, Marciniec T, Yeoh T, Allen DG, Harvey RP, Graham RM. Skeletal muscle hypertrophy is mediated by a Ca2+‐dependent calcineurin signalling pathway. Nature 1999;400:576–581. [DOI] [PubMed] [Google Scholar]
- 2. Wilkins BJ, Molkentin JD. Calcium‐calcineurin signaling in the regulation of cardiac hypertrophy. Biochem Biophys Res Commun 2004;322:1178–1191. [DOI] [PubMed] [Google Scholar]
- 3. Lange S, Xiang F, Yakovenko A, Vihola A, Hackman P, Rostkova E, Kristensen J, Brandmeier B, Franzen G, Hedberg B, Gunnarsson LG, Hughes SM, Marchand S, Sejersen T, Richard I, Edström L, Ehler E, Udd B, Gautel M. The kinase domain of titin controls muscle gene expression and protein turnover. Science 2005;308:1599–1603. [DOI] [PubMed] [Google Scholar]
- 4. Radke MH, Peng J, Wu Y, McNabb M, Nelson OL, Granzier H, Gotthardt M. Targeted deletion of titin N2B region leads to diastolic dysfunction and cardiac atrophy. Proc Natl Acad Sci U S A 2007;104:3444–3449. [DOI] [PMC free article] [PubMed] [Google Scholar]
- 5. Sheikh F, Raskin A, Chu PH, Lange S, Domenighetti AA, Zheng M, Liang X, Zhang T, Yajima T, Gu Y, Dalton ND, Mahata SK, Dorn GW 2nd, Brown JH, Peterson KL, Omens JH, McCulloch AD, Chen J. An FHL1‐containing complex within the cardiomyocyte sarcomere mediates hypertrophic biomechanical stress responses in mice. J Clin Invest 2008;118:3870–3880. [DOI] [PMC free article] [PubMed] [Google Scholar]
- 6. Methawasin M, Strom JG, Slater RE, Fernandez V, Saripalli C, Granzier HL. Experimentally increasing titin's compliance through RBM20 inhibition improves diastolic function in a mouse model of HFpEF. Circulation 2016;20: 10.1161/CIRCULATIONAHA.116.023003. [DOI] [PMC free article] [PubMed] [Google Scholar]
- 7. Granzier HL, Radke MH, Peng J, Westermann D, Nelson OL, Rost K, King NM, Yu Q, Tschöpe C, McNabb M, Larson DF, Labeit S, Gotthardt M. Truncation of titin's elastic PEVK region leads to cardiomyopathy with diastolic dysfunction. Circ Res 2009;105:557–564. [DOI] [PMC free article] [PubMed] [Google Scholar]
- 8. Granzier HL, Hutchinson KR, Tonino P, Methawasin M, Li FW, Slater RE, Bull MM, Saripalli C, Pappas CT, Gregorio CC, Smith JE 3rd. Deleting titin's I‐band/A‐band junction reveals critical roles for titin in biomechanical sensing and cardiac function. Proc Natl Acad Sci U S A 2014;111:14589–14594. [DOI] [PMC free article] [PubMed] [Google Scholar]
- 9. Miller MK, Bang ML, Witt CC, Labeit D, Trombitas C, Watanabe K, Granzier H, McElhinny AS, Gregorio CC, Labeit S. The muscle ankyrin repeat proteins: CARP, ankrd2/Arpp and DARP as a family of titin filament‐based stress response molecules. J Mol Biol 2003;333:951–964. [DOI] [PubMed] [Google Scholar]
- 10. Barash IA, Bang M‐L, Mathew L, Greaser ML, Chen J, Lieber RL. Structural and regulatory roles of muscle ankyrin repeat protein family in skeletal muscle. Am J Physiol Cell Physiol 2007;293:C218–C227. [DOI] [PubMed] [Google Scholar]
- 11. Lun AS, Chen J, Lange S. Probing muscle ankyrin‐repeat protein (MARP) structure and function. Anat Rec 2014;297:1615–1629. [DOI] [PMC free article] [PubMed] [Google Scholar]
- 12. Lange S, Gehmlich K, Lun AS, Blondelle J, Hooper C, Dalton ND, Alvarez EA, Zhang X, Bang ML, Abassi YA, Dos Remedios CG, Peterson KL, Chen J, Ehler E. MLP and CARP are linked to chronic PKCalpha signalling in dilated cardiomyopathy. Nat Commun 2016;7:12120. [DOI] [PMC free article] [PubMed] [Google Scholar]
- 13. Hayashi C, Ono Y, Doi N, Kitamura F, Tagami M, Mineki R, Arai T, Taguchi H, Yanagida M, Hirner S, Labeit D, Labeit S, Sorimachi H. Multiple molecular interactions implicate the connectin/titin N2A region as a modulating scaffold for p94/calpain 3 activity in skeletal muscle. J Biol Chem 2008;283:14801–14814. [DOI] [PubMed] [Google Scholar]
- 14. Ojima K, Kawabata Y, Nakao H, Nakao K, Doi N, Kitamura F, Ono Y, Hata S, Suzuki H, Kawahara H, Bogomolovas J, Witt C, Ottenheijm C, Labeit S, Granzier H, Toyama‐Sorimachi N, Sorimachi M, Suzuki K, Maeda T, Abe K, Aiba A, Sorimachi H. Dynamic distribution of muscle‐specific calpain in mice has a key role in physical‐stress adaptation and is impaired in muscular dystrophy. J Clin Invest 2010;120:2672–2683. [DOI] [PMC free article] [PubMed] [Google Scholar]
- 15. Labeit D, Watanabe K, Witt C, Fujita H, Wu Y, Lahmers S, Funck T, Labeit S, Granzier H. Calcium‐dependent molecular spring elements in the giant protein titin. Proc Natl Acad Sci U S A 2003;100:13716–13721. [DOI] [PMC free article] [PubMed] [Google Scholar]
- 16. Fujita H, Labeit D, Gerull B, Labeit S, Granzier HL. Titin isoform‐dependent effect of calcium on passive myocardial tension. Am J Physiol Heart Circ Physiol 2004;287:H2528–H2534. [DOI] [PubMed] [Google Scholar]
- 17. Forbes JG, Jin AJ, Ma K, Gutierrez‐Cruz G, Tsai WL, Wang K. Titin PEVK segment: charge‐driven elasticity of the open and flexible polyampholyte. J Muscle Res Cell Motil 2005;291–301. [DOI] [PMC free article] [PubMed] [Google Scholar]
- 18. Argadine HM, Hellyer NJ, Mantilla CB, Zhan W‐Z, Sieck GC. The effect of denervation on protein synthesis and degradation in adult rat diaphragm muscle. J Appl Physiol 2009;107:438–444. [DOI] [PMC free article] [PubMed] [Google Scholar]
- 19. Norrby M, Evertsson K, Fjallstrom A‐K, Svensson A, Tagerud S. Akt (protein kinase B) isoform phosphorylation and signaling downstream of mTOR (mammalian target of rapamycin) in denervated atrophic and hypertrophic mouse skeletal muscle. J Mol Signal 2012;7:7. [DOI] [PMC free article] [PubMed] [Google Scholar]
- 20. Methawasin M, Hutchinson KR, Lee EJ, Smith JE, Saripalli C, Hidalgo CG, Ottenheijm CA, Granzier H. Experimentally increasing titin compliance in a novel mouse model attenuates the frank‐starling mechanism but has a beneficial effect on diastole. Circulation 2014;129:1924–1936. [DOI] [PMC free article] [PubMed] [Google Scholar]
- 21. Slater RE, Strom JG, Granzier H. Effect of exercise on passive myocardial stiffness in mice with diastolic dysfunction. J Mol Cell Cardiol 2017;108:24–33. [DOI] [PubMed] [Google Scholar]
- 22. Lieber RL, Yeh Y, Baskin RJ. Sarcomere length determination using laser diffraction. Effect of beam and fiber diameter. Biophys J 1984;45:1007–1016. [DOI] [PMC free article] [PubMed] [Google Scholar]
- 23. Zuurbier CJ, Heslinga JW, Lee‐de Groot MBE, Van der Laarse WJ. Mean sarcomere length‐force relationship of rat muscle fibre bundles. J Biomech 1995;28:83–87. [DOI] [PubMed] [Google Scholar]
- 24. Warren CM, Krzesinski PR, Greaser ML. Vertical agarose gel electrophoresis and electroblotting of high‐molecular‐weight protiens. Electrophoresis 2003;24:1695–1702. [DOI] [PubMed] [Google Scholar]
- 25. Martin AW, Stewart DM. Hypertrophy of the denervated hemidiaphragm. Am J Physiol 1956;186:497–500. [DOI] [PubMed] [Google Scholar]
- 26. Stewart DM, Sola OM, Martin AW. Hypertrophy as a response to denervation in skeletal muscle. Z Verg Physiol 1972;76:146–167. [Google Scholar]
- 27. Yellin H. Changes in fiber types of the hypertrophying denervated hemidiaphragm. Exp Neurol 1974;42:412–428. [DOI] [PubMed] [Google Scholar]
- 28. Khurram OU, Sieck GC, Mantilla CB. Compensatory effects following unilateral diaphragm paralysis. Respir Physiol Neurobiol 2017;246:39–46. [DOI] [PMC free article] [PubMed] [Google Scholar]
- 29. Maatz H, Jens M, Liss M, Schafer S, Heinig M, Kirchner M, Adami E, Rintisch C, Dauksaite V, Radke MH, Selbach M, Barton PJ, Cook SA, Rajewsky N, Gotthardt M, Landthaler M, Hubner N. RNA‐binding protein RBM20 represses splicing to orchestrate cardiac pre‐mRNA processing. J Clin Invest 2014;124:3419–3430. [DOI] [PMC free article] [PubMed] [Google Scholar]
- 30. Hinze F, Dieterich C, Radke MH, Granzier H, Gotthardt M. Reducing RBM20 activity improves diastolic dysfunction and cardiac atrophy. J Mol Med (Berl) 2016;94:1349–1358. [DOI] [PMC free article] [PubMed] [Google Scholar]
- 31. Oppersma E, Hatam N, Doorduin J, van der Hoeven JG, Marx G, Goetzenich A, Fritsch S, Heunks LMA, Bruells CS. Functional assessment of the diaphragm by speckle tracking ultrasound during inspiratory loading. J Appl Physiol 2017;123:1063–1070. [DOI] [PubMed] [Google Scholar]
- 32. Poole DC, Mathieu‐Costello O. Capillary and fiber geometry in rat diaphragm perfusion fixed in situ at different sarcomere lengths. J Appl Physiol 1992;73:151–159. [DOI] [PubMed] [Google Scholar]
- 33. Reid MB, Parsons DB, Giddings CJ, Gonyea WJ, Johnson RLJ. Capillaries measured in canine diaphragm by two methods. Anat Rec 1992;234:49–54. [DOI] [PubMed] [Google Scholar]
- 34. Pearson AM. Muscle growth and exercise. Crit Rev Food Sci Nutr 1990;29:167–196. [DOI] [PubMed] [Google Scholar]
- 35. Zollner AM, Abilez OJ, Bol M, Kuhl E. Stretching skeletal muscle: chronic muscle lengthening through sarcomerogenesis. PLoS One 2012;7:e45661. [DOI] [PMC free article] [PubMed] [Google Scholar]
- 36. Yang H, Schmidt LP, Wang Z, Yang X, Shao Y, Borg TK, Markwald R, Runyan R, Gao BZ. Dynamic myofibrillar remodeling in live cardiomyocytes under static stretch. Sci Rep 2016;6:20674. [DOI] [PMC free article] [PubMed] [Google Scholar]
- 37. Voelkel T, Linke WA. Conformation‐regulated mechanosensory control via titin domains in cardiac muscle. Pflugers Arch 2011;462:143–154. [DOI] [PMC free article] [PubMed] [Google Scholar]
- 38. Linke WA, Kruger M. The giant protein titin as an integrator of myocyte signaling pathways. Physiology (Bethesda) 2010;25:186–198. [DOI] [PubMed] [Google Scholar]
- 39. Gotthardt M, Hammer RE, Hubner N, Monti J, Witt CC, McNabb M, Richardson JA, Granzier H, Labeit S, Herz J. Conditional expression of mutant M‐line titins results in cardiomyopathy with altered sarcomere structure. J Biol Chem 2003;278:6059–6065. [DOI] [PubMed] [Google Scholar]
- 40. Garvey SM, Rajan C, Lerner AP, Frankel WN, Cox GA. The muscular dystrophy with myositis (mdm) mouse mutation disrupts a skeletal muscle‐specific domain of titin. Genomics 2002;79:146–149. [DOI] [PubMed] [Google Scholar]
- 41. Fukuda N, Sasaki D, Ishiwata S, Kurihara S. Length dependence of tension generation in rat skinned cardiac muscle: role of titin in the Frank‐Starling mechanism of the heart. Circulation 2001;104 VN‐r:1639–1645. [DOI] [PubMed] [Google Scholar]
- 42. Cornachione AS, Leite F, Bagni MA, Rassier DE. The increase in non‐cross‐bridge forces after stretch of activated striated muscle is related to titin isoforms. Am J Physiol Cell Physiol 2015;310:C19–C26. [DOI] [PMC free article] [PubMed] [Google Scholar]
- 43. Li Y, Lang P, Linke WA. Titin stiffness modifies the force‐generating region of muscle sarcomeres. Sci Rep 2016;6:24492. [DOI] [PMC free article] [PubMed] [Google Scholar]
- 44. Pulcastro HC, Awinda PO, Methawasin M, Granzier H, Dong W, Tanner BCW. Increased titin compliance reduced length‐dependent contraction and slowed cross‐bridge kinetics in skinned myocardial strips from RBM20ΔRRM mice. Front Physiol 2016;7:322. [DOI] [PMC free article] [PubMed] [Google Scholar]
- 45. Vafiadaki E, Arvanitis DA, Sanoudou D. Muscle LIM protein: master regulator of cardiac and skeletal muscle functions. Gene 2015;566:1–7. [DOI] [PMC free article] [PubMed] [Google Scholar]
- 46. Bogomolovas J, Gasch A, Simkovic F, Rigden DJ, Labeit S, Mayans O. Titin kinase is an inactive pseudokinase scaffold that supports MuRF1 recruitment to the sarcomeric M‐line. Open Biol 2014;4:140041. [DOI] [PMC free article] [PubMed] [Google Scholar]
- 47. Wette SG, Smith HK, Lamb GD, Murphy RM. Characterization of muscle ankyrin repeat proteins in human skeletal muscle. Am J Physiol Cell Physiol 2017;313:C327–C339. [DOI] [PMC free article] [PubMed] [Google Scholar]
- 48. Zhong L, Chiusa M, Cadar AG, Lin A, Samaras S, Davidson JM, Lim CC. Targeted inhibition of ANKRD1 disrupts sarcomeric ERK‐GATA4 signal transduction and abrogates phenylephrine‐induced cardiomyocyte hypertrophy. Cardiovasc Res 2015;106:261–271. [DOI] [PMC free article] [PubMed] [Google Scholar]
- 49. Zhou T, Fleming JR, Franke B, Bogomolovas J, Barsukov I, Rigden DJ, Labeit S, Mayans O. CARP interacts with titin at a unique helical N2A sequence and at the domain Ig81 to form a structured complex. FEBS Lett 2016;590:3098–3110. [DOI] [PubMed] [Google Scholar]
- 50. Llewellyn ME, Barretto RPJ, Delp SL, Schnitzer MJ. Minimally invasive high‐speed imaging of sarcomere contractile dynamics in mice and humans. Nature 2008;454:784–788. [DOI] [PMC free article] [PubMed] [Google Scholar]
- 51. Chen X, Sanchez GN, Schnitzer MJ, Delp SL. Changes in sarcomere lengths of the human vastus lateralis muscle with knee flexion measured using in vivo microendoscopy. J Biomech 2016;49:2989–2994. [DOI] [PMC free article] [PubMed] [Google Scholar]
- 52. Puthucheary ZA, Rawal J, McPhail M, Connolly B, Ratnayake G, Chan P, Hopkinson NS, Phadke R, Dew T, Sidhu PS, Velloso C, Seymour J, Agley CC, Selby A, Limb M, Edwards LM, Smith K, Rowlerson A, Rennie MJ, Moxham J, Harridge SD, Hart N, Montgomery HE. Acute skeletal muscle wasting in critical illness. JAMA 2013;310:1591–1600. [DOI] [PubMed] [Google Scholar]
- 53. Renaud G, Llano‐Diez M, Ravara B, Gorza L, Feng H‐Z, Jin J‐P, Cacciani N, Gustafson AM, Ochala J, Corpeno R, Li M, Hedström Y. Sparing of muscle mass and function by passive loading in an experimental intensive care unit model. J Physiol 2013;591:1385–1402. [DOI] [PMC free article] [PubMed] [Google Scholar]
- 54. von Haehling S, Morley JE, Coats AJS, Anker SD. Ethical guidelines for publishing in the journal of cachexia, sarcopenia and muscle: update 2017. J Cachexia Sarcopenia Muscle 2017;8:1081–1083. [DOI] [PMC free article] [PubMed] [Google Scholar]
Associated Data
This section collects any data citations, data availability statements, or supplementary materials included in this article.
Supplementary Materials
Figure S1. Comparison of dynamic vs. static stretch protocols for passive tension determination in permeabilized diaphragm fibres. (A) Left: Stepwise increase in fibre length. Right: Fibre length change corresponding to the in vivo diaphragm kinetics and sarcomere length changes during UDD as determined by echomyography. (B) The corresponding changes in sarcomere length in the fibres. (C) The corresponding passive force. (D) Plateau forces from the static protocol (C; left) are lower than forces at the same sarcomere length during the stretch‐release protocol (C; right), highlighting the importance of in vivo stretch speed in passive tension development.
Figure S2. Whole body plethysmography in the titin models. Respiration frequency (A), tidal volume (B), and (C) minute volume during UDD were not affected by the genotype of the mice. Graphs represent mean ± SEM.
Figure S3. Tissue mass changes of the whole diaphragm and various regions of the diaphragm (excluding the right costal) after UDD. (A) Whole diaphragm tissue mass (TM; normalized to tibia length (TL)) is increased after UDD in all genotypes, which reflects the increase in mass of the denervated right costal (Figure 1b). (B) The innervated left costal and right crus (C) do not hypertrophy after UDD. (D) The mass of the left (innervated) crus increases in WT and in TtnΔIAjxn mice after UDD. Graphs represent mean ± SEM.
Table S1 Supporting information
Table S2 Supporting information
Supporting info item