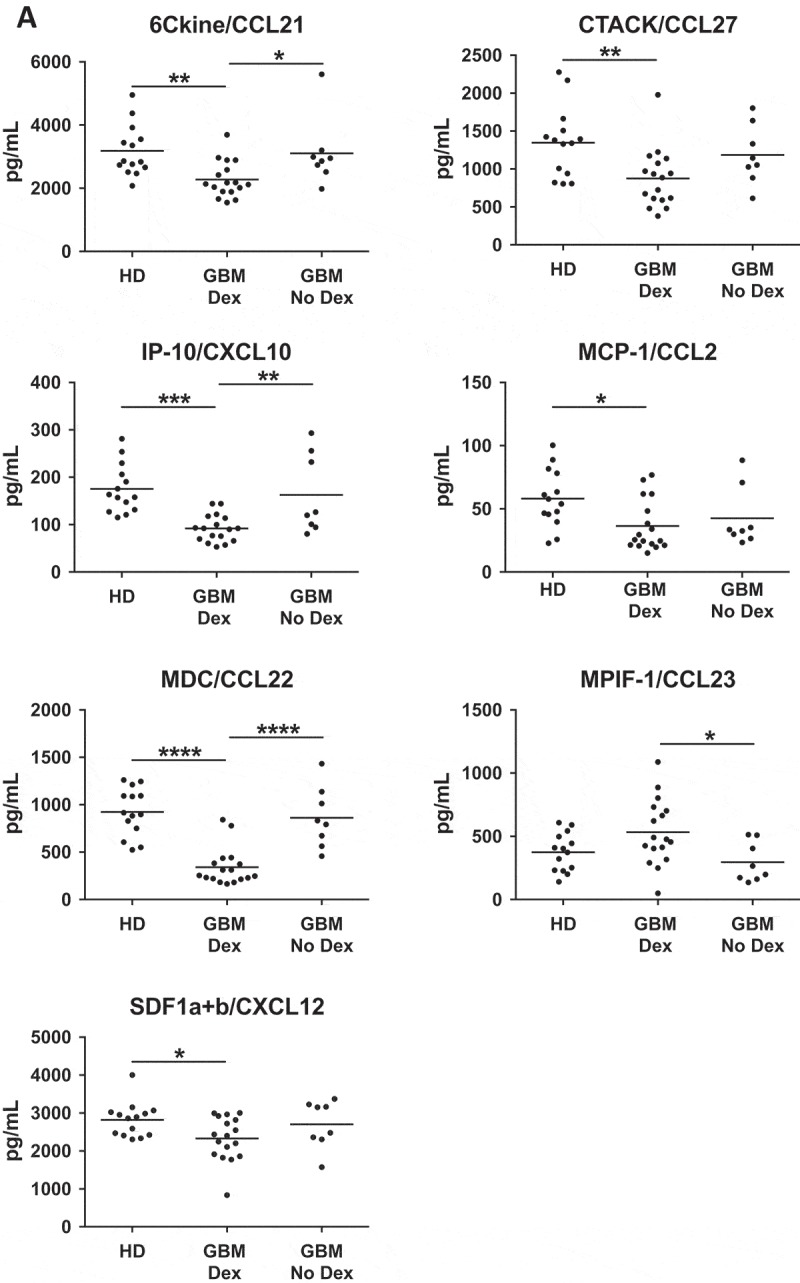
Figure 4.

Chemokine levels are influenced by Dex-treatment. (A) Serum samples from healthy donors (HD) or Dex-treated and naïve GBM patients were analysed using the Biorad Human Chemokine Panel 40-plex. Dex-dependent differences were found in 6Ckine (CCL21), CTACK (CCL27), IP-10 (CXCL10), MCP-1 (CCL2), MDC (CCL22), MPIF-1 (CCL23), and SDF-1 (CXCL12). P-values calculated using one-way ANOVA followed by Tukey’s multiple comparisons test. Line indicates mean. (B) Representative cores from gliosis, grade I, III and GBM TMAs stained for MCP-1. (C-D) Quantitative analysis of TMAs represented as (C) % of total cells that are MCP-1+, or (D) number of MCP-1+ cells per square millimeter. P-values calculated with the Kruskal–Wallis one-way ANOVA followed by Dunn’s multiple comparisons test. Line indicates median. Linear regression analysis of MCP-1 versus CD163 positivity in (E) grade I pilocytic astroctyoma and (F) GBM. P-values indicate the slope does not significantly deviate from zero. Comparison of MCP-1 positivity in Dex treated and Dex naïve samples from (G) gliosis (H) grade I, and (I) grade II-III TMAs.
