

ABSTRACT
Pediatric deaths due to children being left in hot cars remain a significant yet preventable public health concern. The current study aims to demonstrate the influence of vehicle type, time of day, and solar exposure (sun or shade) on the energy balance and core temperature (Tc) of a hypothetical two-year old boy left in a vehicle on a hot day. Cabin temperatures and relative humidity were collected within six enclosed vehicles under sun or full shade in Tempe, Arizona. These variables and radiation estimates were used to estimate the human energy balance and final Tc across 76 measurement cycles lasting approximately 60minutes.
Interior temperatures averaged 39.5°C and 47.6°C in the shade and sun, respectively, at steady-state. Based on the specific heat of a human body, the average Tc after 60 minutes in shaded or sun-exposed vehicles was estimated to reach 38.2±0.29°C and 39.1±0.41°C, respectively, with a significantly higher final Tc in sun-exposed vehicles across all days and in the shaded minivan. Extrapolation to 2 hours is estimated to result in heat injury in the sun.
Results demonstrate the influence of radiation on a child's thermal balance in a hot and dry environment. In real-world situations, it is critical to acknowledge variability between children, the starting car environment, and climate (e.g., humid versus dry), and that a child left in any vehicle car can experience potentially lethal core temperatures if forgotten, as shown by vehicular heat stroke statistics. Findings may improve public messaging and reinforce the need for policy action and technological adoption to prevent injury and death.
KEYWORDS: Pediatric, heatstroke, solar radiation, core temperature, heat balance, shade, vehicle, hyperthermia, children
Abbreviations and Units
- Aeff
Effective area factor
- B
Energy budget (W m−2)
- BSA
Body surface area (m2)
- C
Convective heat losses from a person (W m−2)
- E
Evaporative heat losses from a person (W m−2)
- Emax
Maximum evaporation (W m−2)
- Ereq
Required evaporation (W m−2)
- e
Interior vapor pressure (hPa)
- Icl
Clothing insulation (clo)
- k
Heat transfer coefficient (K W−1m−2)
- K
Conductive heat flux (W m−2)
- Kabs
Absorbed incoming radiation (W m−2)
- Kin
Incoming solar radiation (W m−2)
- Kr
Reflected radiation (W m−2)
- La
Atmospheric longwave radiation (W m−2)
- Lemit
Long-wave radiation emitted (W m−2)
- Lin
Incoming longwave radiation (W m−2)
- Lsfc
Longwave emitted from vehicle surfaces (W m−2)
- M
Net metabolic heat generated by a person (W m−2)
- Mact
Metabolic activity rate (W m−2)
- NSRDB
National Solar Radiation Database
- P
Standard air pressure (hPa)
- PVH
Pediatric vehicular hyperthermia
- Rabs
Radiation absorbed by human (W m−2)
- RH
Relative humidity (%)
- R
Net radiation on body (W m−2)
- Ta
Ambient (outdoor) air temperature (°C)
- Tac
Cabin air temperature (°C)
- Tc
Core temperature (°C)
- Tcf
Final core temperature (°C)
- Tceq
Equilibrium core temperature (°C)
- Tsfc
Surface temperature (°C)
- Tseat
Seat surface temperature (°C)
- Tsk
Skin temperature (°C)
Difference between Tc0 and Tceq (°C)
- va
Air movement due to activity (m s−1)
- vw
Wind speed (m s−1)
Skin wettedness
- αh
Average albedo of a human
- εh, εa, εs
Emissivity of human, air, and surface, respectively.
Boltzmann's constant (5.67 × 10⁻⁸ Wm−2 K−4)
1. Introduction
Over the last 18 years, between 30 and 60 children per year in the United States have succumbed to extreme heat from being left unattended in a parked vehicle [1]. In 2017 alone, 42 children were victims of pediatric vehicular hyperthermia (PVH) deaths in the United States [1], which persists as the leading cause of non-crash, vehicle-related deaths in children [2], and results in preventable illness in hundreds of children annually [3]. Often, children are simply forgotten (54% of deaths) or are playing unattended in a car (28%), yet 17% of situations are intentional [1,4]. PVH rates have also risen since air bags were installed in the front seats, requiring car seats to be placed the back [5]. The problem is not confined to the U.S. — 21 fatalities were reported in Brazil between 2006 and 2015 [6], with seven deaths in France and Belgium between 2007 and 2009 and others noted in the Netherlands, Iceland, Hungary, and Israel [7].
Vehicle heating rates under various outdoor weather conditions are well-studied, with minor cooling effects of ‘cracking’ a window and small differences by car type or color [3,8,9]. Lethal in-vehicle temperatures are also reached on cloudy days, even though ambient air temperatures can be up to 10°C less when compared to sunny days [10]. In direct solar radiation, a greenhouse situation occurs within the vehicle, trapping longwave radiation and heating the vehicle interior to a steady-state with little-to-no airflow [11]. This situation of radiation trapping highlights the importance of solar exposure in vehicle heating and child vulnerability [12,13], even on milder days [14]. In as little as five minutes under an ambient temperature of 30°C, interior car temperatures can rise to 57–68°C [9]. Only one study [15] has investigated the impact of shade on interior heating.
Young children are vulnerable to the impacts of extreme heat [16], with increased emergency department visits found during heat waves [17–20]. As compared to adults, children have a higher surface-area-to-mass ratio and heat production per unit body mass [21], a quicker rise in core temperature [22,23], and a lower efficiency at cooling through evaporation [24]. Further, children and infants are unable to control the environment, communicate well, and often fall asleep during car rides [25]. Although many studies have monitored the micro-environment dynamics of the heating of vehicle interiors, few studies have addressed the impact of interior heat loads in terms of children's overall heat balance, physiology, and radiation loads. Such studies assess children's energy balance and core temperature [26–28], and have examined death caused by asphyxia or heat stroke in an enclosed space [29].
A rise in core temperature (Tc) is the best determinant of heat injury occurring, and the rate at which an individual's Tc rises and the value at which hyperthermia and illness occur differs due to attributes such as body size, gender, and age, among other factors [30–32]. A Tc value of 40°C is related to the most extreme form of heat illnesses and may be of greater consequence to the very vulnerable (i.e., children, elderly), and a value of 42°C is shown as the critical thermal maximum for adults [33]. Heatstroke is represented by a continuum of symptoms that may ultimately lead to death [34]; survivors may also suffer brain damage [35,36], with one study [37] finding hyperactivity, attention deficit, and epilepsy in child heatstroke survivors. The avenues and magnitudes of heat loss (evaporative, radiant, convective, and/or conductive exchanges) depend on the environment as well as human physiology/behavior, and are part of an intricate thermoregulatory feedback in the human body [38]. Thermal balance models can help estimate heat stress and strain in an enclosed space, whether environmentally- or forensically-based [3,27], and further extend the modeled data for more effective communication to parents and caregivers.
The current study assesses core temperature rise and the influence of shade on the thermal environment of an enclosed vehicle. Utilizing in-vehicle measurements, we predict pediatric vehicular hyperthermia (PVH) through heat balance modeling of a small child. The study makes use of six vehicles in Arizona positioned in sun or under solar structure shade to address the following research questions: What is the thermal environment and potential danger to a child left unattended in a shaded versus sun-exposed vehicle during summer, and at what timescale might dangers begin to arise in each exposure condition?
2. Methods
2.1. Experimental Set Up
We use interior vehicle and ambient data from multiple trials over three days between June 25 and July 11, 2014. Beginning at 9:00 a.m. in Tempe, AZ, three pairs of identical-model vehicles (silver mid-size sedans, silver economy cars, white minivans; see Figure 1) were parked in the sun and solar canopy shade for a given time (average of 60 minutes) to simulate a shopping trip. After this ‘heating period’, all vehicles were brought into the sun, and the air conditioning was run to cool each vehicle's cabin to either equal outdoor air temperature (Ta) or to 85°F (29.4°C), whichever was cooler. The cycle was repeated 3–5 times each day until 5:00 p.m. The interior relative humidity (RH) and cabin Ta (Tac) were monitored at 1-minute intervals using LASCAR Electronics EL-USB-2+ sensors. Surface temperatures (Tsfc) were measured on the steering wheel, dashboard, and shaded seats at the start and end of each cycle using a handheld infrared thermometer (DeltaTRAK-15002).
Figure 1.
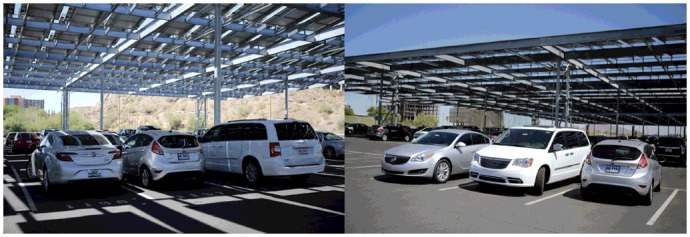
Exposure of vehicles (Midsize Sedan, Minivan, Economy Car) shaded by a solar structure (left) and of those in the direct sun (right).
2.2. Energy Balance Modeling of Child
Modeling the human heat balance of a standard child, age two, and sitting, was accomplished via a human heat balance approach. Model inputs include cabin Tac, RH, wind speed, solar radiation, Tsfc, clothing insulation (Icl), and metabolic rate (Mact). The overall heat balance relies on the standard energy balance equation:
| (1) |
where B represents the net energy budget, through summing absorbed radiation (Rabs), net metabolic heat (M), conductive heat gain or loss (K), convective heat gain or loss (C), evaporative heat loss (E), and emitted longwave radiation (Lemit) (Wm−2). Excluding conduction, all fluxes are based on the air-exposed area of a seated child [effective area (Aeff) of 0.76], where conduction (torso, legs, and head in contact with the seat) was applied to the remaining 0.24 [39].
We apply principles from the COMFA [40–42] energy balance model, with the addition of conduction and the use of an alternative evaporation model (Section 2.2.5) to estimate heat exchange based on biophysical principles in a stressful environment. Below, we outline the adjustments made for the standard COMFA model given the available input data and study specifics (e.g., car interior, child, effective area, core temperature estimation), with the full model found elsewhere [43–46]. The general COMFA model has been applied in the Phoenix, AZ climate by Harlan et al. [47] to generate a Human Thermal Comfort Index.
2.2.1. Metabolic Heat Production
The basal metabolic rate (BMR) in watts of a child aged 1–3 can be calculated from the following empirical equation by Schofield et al. [48]
| (2) |
where mb is the body mass of a child (kg) and h is height (m). Based on an average height and weight for a 2-year old from standardized growth tables (h = 1.0m, mb = 13.4kg), Equation 2 provides a BMR of 43.7 W. Converting this to an energy flux with body surface area (BSA) [49] gives 72 W m−2 (which is similar to the value of 69 W m−2 used by Grundstein et al. [28]). This value was used as the metabolic rate, Mact, for the modeling hereafter. The model incorporates equations from Fanger [50] sensible heat loss (SE) (or convective respiration) and latent heat losses (LA) (or evaporative respiration) to Tair and vapor pressure (e), respectively, based on metabolic rate. Converting to W m−2, kPa, and °C, we obtain the total heat loss due to respiration [40]:
| (3) |
The metabolic rate (M), in W m−2, is:
| (4) |
2.2.2. Absorbed Radiation
To calculate the Rabs of a child in a car seat, we determined the combination of solar and longwave radiation absorbed by the child in the vehicle. The incoming solar radiation hitting the window (Kin) was calculated from hourly values of normal direct irradiance for Phoenix from the National Solar Radiation Database [51] and the cosine of the zenith angle at the given time. The solar canopy structure effectively blocks approximately 95% of the direct incoming solar radiation. The Kin hitting the window was multiplied by a window attenuation factor of 0.5 based on in-vehicle data from Grundstein et al. [26]
Given the low likelihood of the child being directly in the sun, we do not account for direct incoming Kin as part of the radiation imposed on the child. However, the amount of Kin entering the car and being reflected at the child (Kr) remains an important component. In-vehicle Kr was based on a 10% reflection of the attenuated Kin due to the absorbing dark nature of the interior surfaces. Thus, the final absorbed solar radiation (Kabs) was calculated as:
| (5) |
where Kr equals the attenuated Kin × 0.1, is the average albedo of a clothed human (0.37) [52,53], and Aeff is 0.76 [54].
The infrared (longwave) radiation gained by the child within the vehicle (Lin) is a sum of in-vehicle atmospheric longwave (La) and longwave emitted from vehicle surfaces (Lsfc). The La was calculated from the MENEX model [55]:
| (6) |
where is the emissivity of air (0.97), is Boltzmann's constant (5.67 × 10⁻⁸ Wm−2 K−4), and e is vehicle interior vapor pressure (hPa). Lsfc was calculated based on a mean Tsfc from the steering wheel, seats, and dashboard (see Table 1):
| (7) |
where is emissivity of the surface (0.97). The final Labs was calculated as:
| (8) |
where is emmsivity of the human (0.95). Finally, the total Rabs (W m−2) by the child was calculated by summing and .
Table 1.
Heating trial (start and end times) by car type, day, and time, aligned with final surface temperature (Tsfc) and cabin air temperature (Tac) conditions in sun and shade.
| SHADE |
SUN |
|||||||||||||||
|---|---|---|---|---|---|---|---|---|---|---|---|---|---|---|---|---|
| Final Interior Temperatures (°C) |
Final Interior Temperatures (°C) |
|||||||||||||||
| Vehicle | Date | Ta (°C) | Trial | Time Start | Time End | Car Tac | Dashboard Tsfc | Wheel Tsfc | Seat Tsfc | Trial | Time Start | Time End | Car Tac | Dashboard Tsfc | Wheel Tsfc | Seat Tsfc |
| Midsize Sedan | Jun-25 | 37.2 | B | 11:00 | 11:55 | 43.2 | 60.0 | 44.4 | 46.1 | B | 11:05 | 12:00 | 48.9 | 85.0 | 59.4 | 62.8 |
| 41.5 | C | 12:30 | 13:25 | 42.0 | 76.1 | 48.9 | 45.6 | C | 13:00 | 14:00 | 49.5 | 76.1 | 61.1 | 60.0 | ||
| 41.0 | D | 13:45 | 14:45 | 42.5 | 51.1 | 46.7 | 44.4 | D | 14:20 | 15:20 | 47.4 | 73.9 | 56.1 | 63.3 | ||
| 40.8 | E | 15:05 | 16:00 | 39.9 | 42.8 | 42.8 | 42.8 | – | – | – | – | – | – | |||
| Jun-26 | 32.8 | A | 10:20 | 11:20 | 35.3 | 41.1 | 37.8 | 37.8 | A | 10:00 | 11:00 | 40.2 | 76.1 | 47.2 | 56.1 | |
| 36.6 | B | 11:35 | 12:35 | 41.6 | 41.7 | 42.8 | 43.3 | B | 11:15 | 12:15 | 49.5 | 82.8 | 54.4 | 53.9 | ||
| 38.0 | C | 13:00 | 14:00 | 39.9 | 40.0 | 40.6 | 42.2 | C | 12:40 | 13:35 | 48.7 | 54.4 | 56.1 | 52.2 | ||
| 39.5 | D | 14:20 | 15:20 | 38.4 | 37.8 | 37.2 | 37.2 | D | 13:50 | 14:50 | 49.8 | 55.6 | 54.4 | 53.3 | ||
| Jul-11 | 36.3 | A | 9:40 | 10:40 | 37.6 | 39.6 | 37.3 | 37.0 | A | 9:45 | 10:45 | 45.5 | 76.1 | 53.3 | 51.1 | |
| 37.4 | B | 10:50 | 11:50 | 39.4 | 50.8 | 42.2 | 41.5 | B | 11:00 | 12:00 | 50.1 | 82.2 | 53.9 | 46.1 | ||
| 38.4 | C | 12:10 | 13:10 | 40.9 | 62.2 | 43.9 | 40.6 | C | 12:30 | 13:30 | 51.3 | 82.2 | 75.0 | 51.1 | ||
| 40.0 | D | 13:40 | 14:40 | 40.4 | 42.9 | 40.3 | 39.6 | D | 14:00 | 15:00 | 51.8 | 76.7 | 52.2 | 51.7 | ||
| 40.3 | E | 14:50 | 15:50 | 41.1 | 44.3 | 41.0 | 39.0 | E | 15:20 | 16:20 | 51.4 | 63.9 | 55.6 | 45.6 | ||
| Minivan | Jun-25 | 37.2 | B | 10:55 | 11:55 | 39.4 | 43.3 | 42.2 | 43.9 | B | 11:00 | 12:00 | 45.6 | 51.7 | 51.1 | 55.0 |
| 41.5 | C | 12:30 | 13:30 | 38.9 | 56.1 | 43.3 | 43.9 | C | 12:50 | 13:50 | 45.7 | 54.4 | 56.7 | 55.6 | ||
| 41.0 | D | 14:00 | 15:00 | 38.4 | 45.6 | 46.1 | 44.4 | D | 14:25 | 15:25 | 45.7 | 80.6 | 59.4 | 62.2 | ||
| 40.8 | E | 15:20 | 16:20 | 41.4 | 43.3 | 43.9 | 43.9 | – | – | – | – | – | – | – | ||
| Jun-26 | 36.6 | A | 10:20 | 11:20 | 36.0 | 37.8 | 37.8 | 38.3 | A | 10:15 | 11:15 | 45.1 | 77.9 | 51.4 | 51.9 | |
| 38.0 | B | 11:45 | 12:45 | 38.6 | 41.7 | 42.2 | 43.3 | B | 11:45 | 12:45 | 45.9 | 49.9 | 51.1 | 50.3 | ||
| 39.5 | C | 13:05 | 14:05 | 41.2 | 43.3 | 43.3 | 43.9 | C | 13:20 | 14:20 | 48.3 | 52.8 | 52.2 | 54.4 | ||
| 39.5 | D | 14:35 | 15:35 | 41.1 | 46.1 | 42.8 | 44.4 | D | – | – | – | – | – | – | ||
| Jul-11 | 36.3 | A | 9:40 | 10:40 | 36.9 | 40.6 | 37.8 | 37.2 | A | 9:40 | 10:35 | 42.5 | 71.1 | 49.4 | 50.6 | |
| 37.4 | B | 10:50 | 11:50 | 38.3 | 46.1 | 39.4 | 38.9 | B | 10:55 | 11:55 | 46.3 | 79.4 | 56.1 | 45.6 | ||
| 38.4 | C | 12:10 | 13:10 | 39.2 | 53.9 | 41.7 | 41.1 | C | 12:30 | 13:30 | 46.7 | 76.7 | 54.4 | 47.2 | ||
| 40.0 | D | 13:50 | 14:50 | 39.3 | 46.7 | 40.6 | 40.6 | D | 14:00 | 15:00 | 48.6 | 77.8 | 50.6 | 56.1 | ||
| 40.6 | E | 15:25 | 16:25 | 38.7 | 43.3 | 41.7 | 38.3 | E | 15:30 | 16:30 | 52.2 | 63.3 | 52.2 | 50.6 | ||
| Economy Car | Jun-25 | 36.0 | A | 10:05 | 11:05 | 42.6 | 58.9 | 45.0 | 44.4 | – | – | – | – | – | – | – |
| 41.5 | C | 12:35 | 13:35 | 42.2 | 47.2 | 48.9 | 47.8 | C | 13:10 | 14:10 | 49.7 | 80.6 | 60.6 | 56.1 | ||
| 41.0 | D | 14:05 | 15:00 | 41.2 | 47.8 | 45.6 | 45.0 | D | 14:50 | 15:40 | 45.6 | 54.4 | 58.3 | 53.3 | ||
| 40.8 | E | 15:20 | 16:20 | 38.3 | 45.0 | 43.9 | 43.3 | E | 15:55 | 16:45 | 51.4 | 63.3 | 53.9 | 50.6 | ||
| Jun-26 | 36.6 | B | 10:20 | 11:20 | 39.7 | 68.9 | 38.3 | 41.1 | B | 9:55 | 10:55 | 45.4 | 46.7 | 49.4 | 48.9 | |
| 38.0 | C | 11:40 | 12:40 | 39.0 | 38.9 | 44.4 | 40.6 | C | 11:20 | 12:20 | 46.8 | 51.7 | 54.4 | 50.6 | ||
| 39.5 | D | 12:50 | 13:50 | 40.5 | 42.2 | 42.8 | 41.7 | D | 12:50 | 13:30 | 47.5 | 78.3 | 56.7 | 58.9 | ||
| 39.7 | E | 14:30 | 15:25 | 40.8 | 40.6 | 40.6 | 41.1 | E | 13:50 | 14:50 | 48.8 | 70.0 | 55.0 | 60.6 | ||
| Jul-11 | 36.3 | A | 9:40 | 10:40 | 36.5 | 40.6 | 37.8 | 37.2 | A | 9:35 | 10:35 | 42.5 | 79.4 | 53.9 | 53.3 | |
| 37.4 | B | 10:50 | 11:50 | 34.7 | 45.6 | 40.6 | 40.0 | B | 10:55 | 11:55 | 47.5 | 82.2 | 78.9 | 55.0 | ||
| 38.4 | C | 12:05 | 13:05 | 38.1 | 61.1 | 43.3 | 40.0 | C | 12:20 | 13:20 | 49.2 | 81.1 | 76.1 | 52.2 | ||
| 40.0 | D | 13:35 | 14:35 | 37.8 | 58.3 | 41.1 | 41.1 | D | 13:50 | 14:50 | 49.8 | 79.4 | 52.2 | 53.3 | ||
| 40.3 | E | 14:55 | 15:55 | 38.9 | 45.0 | 41.1 | 41.7 | E | 15:30 | 16:30 | 46.0 | 63.3 | 54.4 | 52.2 | ||
2.2.3. Conductive Heat Gain
Since 24% of a child's body is estimated to be touching the car seat, conductive heat gain (K) in W m−2 was calculated as [26]:
| (9) |
where k is the heat transfer coefficient (K W−1 m−2) through clothing calculated as [55]:
| (10) |
P is standard pressure (hPa), vw is windspeed (m s−1), and va is air movement due to activity (m s−1). A nominal value of 0.1 m s−1 was assumed for va, which is similar to values used in indoor studies [56]. Given the ambient temperature, it was assumed that a child would be dressed in T-shirt, light athletic shorts, socks, and shoes (Icl = 0.33 clo [0.051 m2 K W−1]).
2.2.4. Convection
Convective heat losses were calculated based on Ohm’s law analogy (e.g., Campbell and Norman [54]), where the heat flux rate—determined based on the temperature gradient between the skin and air—is divided by the resistances to the flow of energy from one surface to the other (s m−1):
| (11) |
where ρCp is the volumetric heat capacity of air (J m−3 K−1), Tsk is the mean skin temperature, rc is the clothing resistance (s m−1) [set to 62 s m−1 (0.33 clo and 0.051 m2 K W−1)], and ra is the boundary air resistance (s m−1), calculated as:
| (12) |
where Re is Reynolds number , Pr is Prandtl number (0.71), υ is the kinematic viscosity of air (∼1.510−5 m2 s−1), is the thermal diffusivity of the air (∼2210−6 m2 s−1), and A and n are empirical constants derived from experiments of heat flow [57].
2.2.4. Evaporation
The maximum evaporative heat loss from the skin (Emax, W m−2) was determined as follows:
| (13) |
where qa and qsk are the specific humidity (kg of water vapor per kg of moist air) at Ta and Tsk, respectively, ρ is density of air (kg m−3), Lv is the latent heat of vaporization (J kg−1), rav is the vapor resistance of air (rav = 0.92ra) [40], and rcv is the vapor resistance of clothing (rcv = 154 s m−1). We determine the maximum skin wittedness () required for heat balance as the ratio of Ereq [M +(R–C)] to Emax. From this assumption, we then multiply by the Emax to obtain potential evaporative heat loss, in W m−2, from the exposed body under the given circumstances:
| (14) |
This method is based on sweating being triggered by a higher body temperature rather than metabolism. A maximum ω of 1.0 was assumed for this equation as one cannot evaporate more than Emax.
2.2.5. Core Temperature Estimations
Uncompensable heat stress (UCHS) occurs when evaporative cooling is not supported by the environment, with other conditions (e.g., air temperature levels) impeding cooling [58]. Although studies have used a Tc of 37°C as a level of UCHS [27,28], it is difficult to apply one value to estimate UCHS. This approximation becomes more complex when considering children, as very little empirical core temperature data under heat strain exist. In the current study, we focus on differences between the environmental exposure conditions and the rate of Tc increase, rather than a threshold Tc value, and assume a value of 40°C to be associated with the most extreme of heat illnesses for the vulnerable toddler group. We are not able to accurately predict when a given infant or toddler will experience heat stroke, and within a population there are heat-sensitive and heat-tolerant individuals.
We estimate the core temperature employing two methods. First, we apply a basic specific heat capacity approach by using the budget output in watts to determine the cumulative Tc rise throughout each trial, where 46,498 Joules represents an increase of 1ºC for a 13.4 kg boy. This method was also employed by Grundstein et al. [27] using the MENEX model [55], and by Alunni et al. [29]. From this estimation, we can assess the accumulation of heat (see example in Table 2) based on the energy balance (Equation 1). Estimates of the Tc up to 50 and 60 minutes are determined based on the amount of data collected (Table 1) and the time range at which in-vehicle conditions generally reach a steady-state across the vehicles, as also found by Horak et al. [11]
Table 2.
Sample computation of core temperature (Tc) from 0 minutes to 60 minutes in 5-minute intervals using specific heat capacity of a 13.4 kg boy and energy budget outputs. represents the cumulative rise in Tc at 5-minute intervals. Data is from the economy car in the sun on June 25 from 13:10 to 14:10.
| Time (min) | Net Heat (J) | Accumulated Heat (J) | (ºC) | Tc (ºC) |
|---|---|---|---|---|
| 0 | 0 | 0 | 0 | 36.80 |
| 5 | 10,278 | 10,278 | 0.22 | 37.02 |
| 10 | 10,886 | 10,886 | 0.41 | 37.21 |
| 15 | 11,490 | 32,655 | 0.83 | 37.63 |
| 20 | 12,088 | 44,743 | 0.83 | 37.63 |
| 25 | 12,673 | 57,416 | 1.06 | 37.86 |
| 30 | 13,277 | 70693 | 1.30 | 38.10 |
| 35 | 13,839 | 84,533 | 1.54 | 38.34 |
| 40 | 14,387 | 98,920 | 1.80 | 38.60 |
| 45 | 14,931 | 113,851 | 2.06 | 38.86 |
| 50 | 15,466 | 129,317 | 2.34 | 39.14 |
| 55 | 16,040 | 145,357 | 2.63 | 39.43 |
| 60 | 16,582 | 161,939 | 2.92 | 39.72 |
The specific heat method assumes a nearly linear increase in Tc with time, yet it is known that at a constant metabolic activity the rate of change will diminish while approaching a new equilibrium level given the environment [59,60]. Hence, we apply a core temperature lag model (Equation 15) to determine the equilibrium Tc from 0 to 60 minutes, as follows [59,61]:
| (15) |
where is the initial core temperature (36.8ºC), is the difference between and the Tc at 60 minutes, as determined through specific heat capacity calculations at steady-state (outlined above), and is the time constant (hr). Because children are smaller in size and mass, they heat up quicker than adults [23], yet a specific value for does not exist for children. Hence, the time constant was determined based on allometric scaling of body weight and BSA between the 2-year old and an adult male, finding an allometric scaling coefficient of 0.72; thus, given the average adult male of 0.5hr [59], the for the male child is estimated to be ∼0.2 hr. Estimation of from Equation 15 is used for comparative purposes in a graphical format to provide a more realistic non-linear pathway to the final core temperature.
Finally, we explore a second method for calculating the final core temperature (Tcf) at steady-state based on energy budget components. The Tcf represents the final equilibrium core temperature which would be achieved if the specified activity level and conditions are carried out over a steady-state [60], hence we used inputs within the 60-minute time frame to determine Tcf as follows:
| (16) |
where Ereq is the required evaporation (W m−2), M is the metabolic activity (W m−2), and is the mean skin temperature at steady-state on average in shade or sun. Equation 16 was originally created from tests of males walking at a constant M of 172 or 261 W m−2 in a steady state environment [59], and further applied for at rest individuals sitting at 83 W m−2 [60]. We acknowledge that 1) the equation was not designed based on infants or children (yet to our knowledge, a specific equation does not exist apart from the specific heat approach outlined above), and 2) the Tcf method does not account for the environmental changes between 0 and 60 minutes, but assumes the child sits in the steady-state environment. Hence, we do not provide time estimates from Equation 16 to reach a given core temperature value, but test the agreement of Tcf with the Tc estimated from the specific heat approach at steady-state.
2.2.5. Data Analysis
To determine differences among group means of the Tc value obtained using the specific heat capacity approach, we applied one-way analysis of variance, comparing Tc values reached in the shade versus sun, as well as between different vehicle types and days within the sun or shade. A p-value of 0.05 was used for all statistical tests. The data presented normality within each period compared, with no outliers and equal variance based on Levene's statistic. The rate of Tc increase was determined over 10-minute intervals and extrapolated to 2 hours.
3. Results
3.1. In-Vehicle Temperatures and Heating Rates
During the simulated shopping trips, the cabin Ta averaged 46.7°C in sun-exposed vehicles, with significantly lower values in the shade (38.3°C) after 60 minutes, similar to a shade/sun study by Surpure [15]. The RH was 4.9% higher in the shaded vehicles due to a lower mean Tac. In comparing the pre- and post-heating surface temperatures, significant higher final dashboard, steering wheel, and seat Tsfc were found in the sun-exposed vehicles. The average Tsfc for the vehicles in the sun were 68.9°C, 53.3°C, and 50.6°C for the dashboard, steering wheel, and seat, respectively, while the shaded vehicles reported 47.8°C, 41.7°C and 41.1°C, respectively (see Table 1). This variability among the three surfaces is expected given the dashboard is more directly exposed to solar radiation. The heating rates in sun-exposed vehicles ranged from an average of 0.30°C min−1 for the minivan to 0.42 °C min−1 for the economy car, which is largely due to the relative air volumes in the vehicles; however, similar equilibria are reached. These conditions are similar to those found by atmospheric models estimating in-vehicle steady-state conditions [11].
3.2. Thermal Energy Balance of Toddler
Figure 2 displays results for each average energy flux by day in the sun and shade during heating cycles only. Shaded vehicles showed a lower overall energy budget (20.6 W m−2 less) largely due to a lower absorbed radiation and convective heat gain, with significant differences in Rabs found between sun and shade (371 versus 342 W m−2, respectively). The higher cabin Ta in the sun (8.5°C on average) resulted in a slightly higher convective heat gain (16.3 versus and 3.8 W m−2 in the sun and shade, respectively). Conductive exchanges remained around a mean of ∼3.0 W m−2 in both exposure conditions, indicating a minimal seat-to-skin temperature difference. Evaporative heat losses did not vary significantly between the sun and shade, with a mean of 97.6 W m−2 across all conditions, reaching a maximum loss of 138.9 W m−2 in the midsize sedan (in sun). An example of the change in Emax, Ereq, and over time within the midsize sedan and minivan on June 26th is shown in Figure 3, demonstrating the convergence of Emax and Ereq with time, indicating increasingly stressful conditions. The skin wettedness rose above 1.0 in all sun-exposed situations on July 11 and stayed under 1.0 in the remaining situations.
Figure 2.
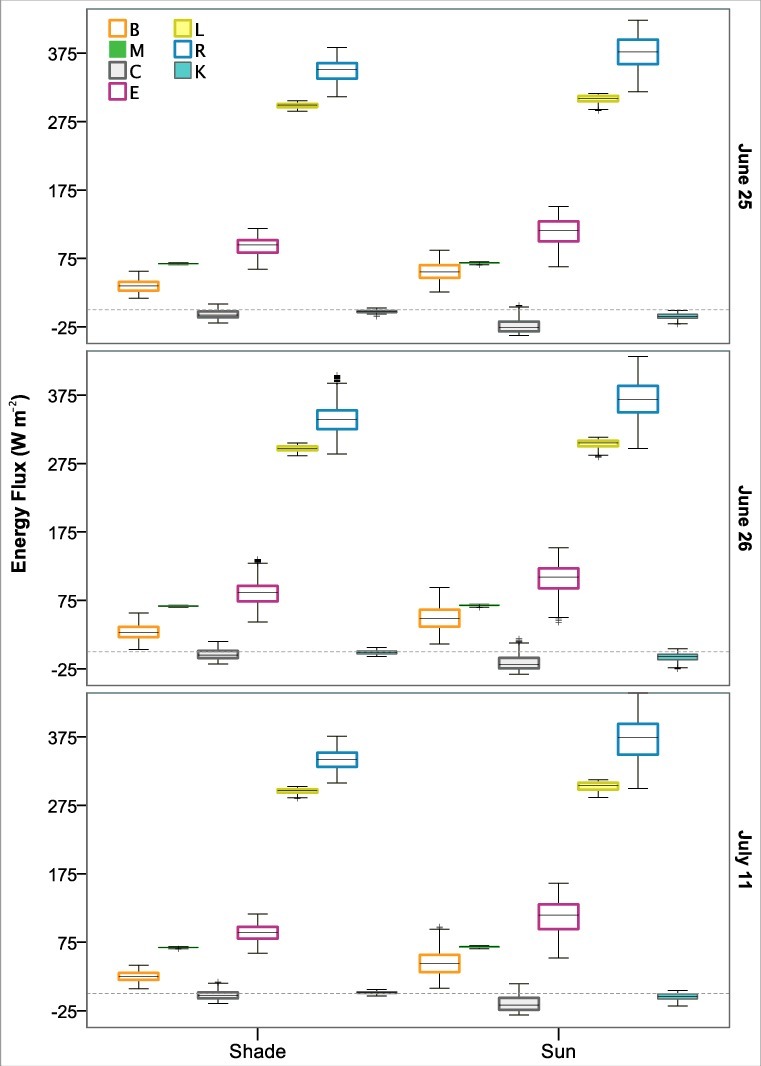
Box plot displaying the average human energy balance (B) fluxes (Wm−2) (from Equation 1) experienced by a model 2-year old boy in sun-exposed or shaded vehicles on three summer days (Jun 25 & 26, July 11, 2014). Data are averaged across vehicles types and within-day heating trials. [Metabolism (M), convective heat loss (C), absorbed radiation (R), emitted radiation (L), evaporative heat loss (E), and conduction (K)]. The interquartile range (IQR) is indicated by the length of each box plot (25th to 75th percentiles), with outliers (values 1.5–3 IQRs from box end) marked by ‘+’.
Figure 3.
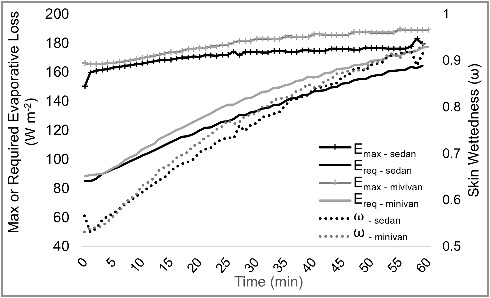
Example of the evaporative heat loss (W m−2) as a function of time for the June 26 midsize sedan and minivan morning trials.
3.3. Core Temperature Rise
3.3.1. Specific Heat Approach
Estimated core temperatures using the specific heat approach over time are presented in Figures 4–6 (dashed lines), along with the time-lag model approach from equation 15 (solid lines). All plots are based on 3–5 closely-matched trials per day, as listed in Table 1. A sample computation is provided in Table 2. The Tc values estimated with the heat capacity approach generally follow a linear pattern, with quicker non-linear increases in the values occurring, which are particularly evident when conditions of Emax are reached. Comparisons of the final Tc reached in sun-exposed and shaded cars indicate a significantly lower average Tc in the shade (Tc = 38.2±0.29°C) versus in the sun (Tc = 39.1±0.41°C) (p < 0.05). Furthermore, the Tc values across all cars within sun or shaded conditions showed little difference, with only the shaded minivan on June 26th displaying a significantly higher overall Tc than the sedan and economy car on the given day in the shade. The highest Tc values were reached mid-day to early afternoon (Trials C and D), on average across all days. The rate of increase in Tc per minute () is also listed in Table 3, with an average rise of 0.038 and 0.028 ºC min−1 in the sun and shade, respectively. A child in any of the vehicles for 60 minutes would reach a Tc 40°C in only one of the cases (June 25th in the midsize sedan in the sun), as is demonstrated in Figures 4–6. Extrapolating using results in an average time of 2.4 hours to reach 40°C in shaded vehicles (1.73–3.13 hr) and 1.43 (1.0–2.12 hr) in sun-exposed vehicles.
Figure 5.
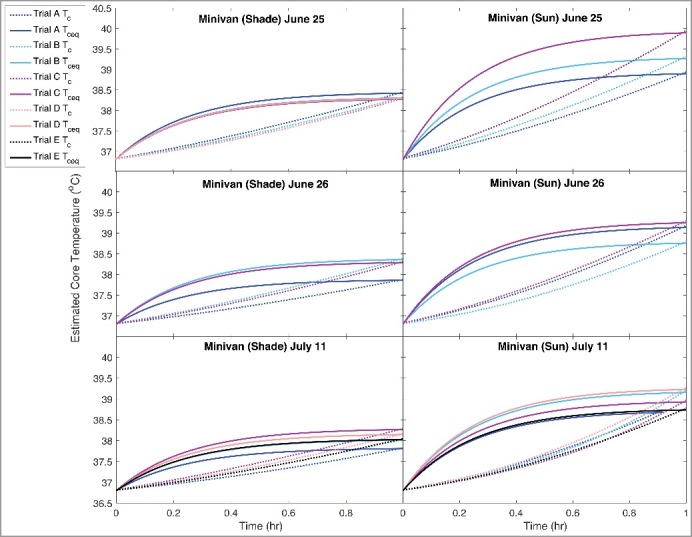
Estimated increase in core temperature as a function of time within a minivan (June 25 & 26, July 11). Dashed lines represent calculations assuming a 1ºC increase in Tc was required 4.65 J for 13.4 kg boy. Solid lines represent the lag model (Equation 15) for equilibrium core temperature () estimations at 60 minutes. Trials through each day presented align with Table 1.
Figure 4.
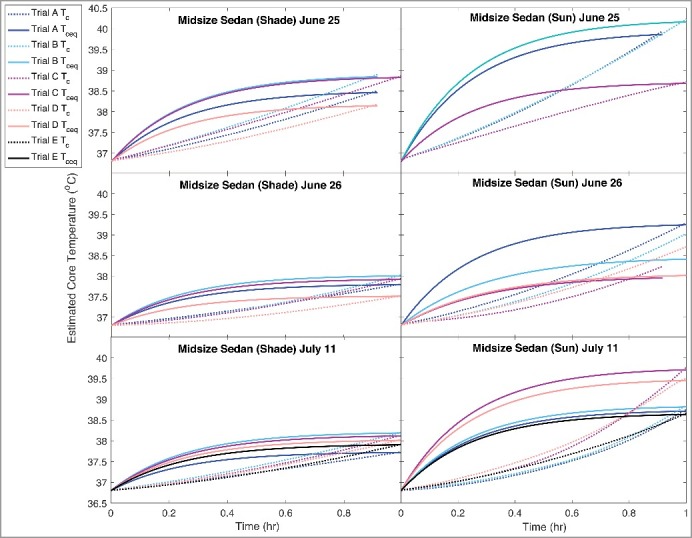
Estimated increase in core temperature as a function of time within a midsize sedan (June 25 & 26, July 11). Dashed lines represent calculations assuming a 1ºC increase in Tc was required 4.65 J for 13.4 kg boy. Solid lines represent lag model (Equation 15) for equilibrium core temperature () estimations at 60 minutes. Trials through each day presented align with Table 1.
Figure 6.
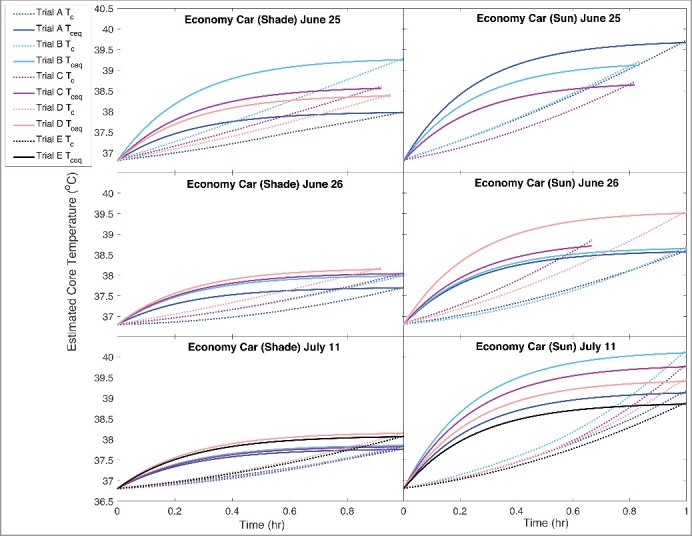
Estimated increase in core temperature as a function of time within an economy car (June 25 & 26, July 11). Dashed lines represent calculations assuming a 1ºC increase in Tc was required 4.65 J for 13.4 kg boy. Solid lines represent lag model (Equation 15) for equilibrium core temperature () estimations at 60 minutes. Trials through each day presented align with Table 1.
Table 3.
Core temperature estimations of Tcf (Equation 16) as compared to core temperature estimates using specific heat, i.e., assuming a 1ºC increase in body temperature required 4.65 J for a 13.4-kg boy (denoted Tc) in shade and sun. Difference represented by . All values are in ºC. Mean of each day by car and condition provided with standard deviations (SD) after 50min and 60min of time within the given vehicle.
| SHADE |
SUN |
|||||||||
|---|---|---|---|---|---|---|---|---|---|---|
| Vehicle Type | Date | Time from Start (min) | Tcf (ºC) | Tc (ºC) | Difference SD (ºC) | Rate (ºC min-1) | Tcf (ºC) | Tc (ºC) | Difference SD (ºC) | Rate (ºC min-1) |
| Midsize Sedan | 25-Jun | 50 | 38.2 | 38.4 | 0.130.19 | 0.029 | 38.9 | 39.2 | 0.250.67 | 0.045 |
| 60 | 38.3 | 38.6 | 0.30a0.21 | 39.1 | 39.5 | 0.380.98 | ||||
| 26-Jun^ | 50 | 37.8 | 37.6 | −0.260.22 | 0.017 | 38.6 | 38.4 | −0.240.45 | 0.035 | |
| 60 | 37.9 | 37.8 | −0.070.22 | 38.7 | 38.9 | 0.130.50 | ||||
| 11-Jul | 50 | 38.0 | 37.7 | −0.200.20 | 0.020 | 38.9 | 38.4 | −0.420.24 | 0.039 | |
| 60 | 38.0 | 38.0 | 0.000.22 | 38.9 | 39.1 | 0.230.42 | ||||
| Minivan | 25-Jun | 50 | 38.1 | 38.0 | −0.060.11 | 0.026 | 39.0 | 38.9 | −0.120.16 | 0.043 |
| 60 | 38.1 | 38.4 | 0.220.11 | 39.1 | 39.4 | 0.330.27 | ||||
| 26-Jun^ | 50 | 38.0 | 37.9 | −0.020.03 | 0.024* | 38.8 | 38.8 | 0.010.31 | 0.025 | |
| 60 | 38.0 | 38.2 | 0.240.08 | 38.7 | 38.3 | −0.430.32 | ||||
| 11-Jul | 50 | 37.9 | 37.8 | −0.040.11 | 0.021 | 38.7 | 38.5 | −0.200.16 | 0.039 | |
| 60 | 37.8 | 38.1 | 0.230.09 | 38.8 | 39.1 | 0.280.24 | ||||
| Economy Car | 25-Jun | 50 | 38.0 | 38.3 | 0.270.16 | 0.031 | 39.1 | 39.0 | −0.090.18 | 0.044 |
| 60 | 38.0 | 38.6 | 0.320.40 | 39.3 | 39.4 | 0.17b - | ||||
| 26-Jun^ | 50 | 37.9 | 37.7 | −0.170.09 | 0.019 | 38.7 | 38.2 | −0.530.25 | 0.031 | |
| 60 | 37.9 | 37.9 | −0.010.02 | 38.7 | 38.6 | −0.080.03 | ||||
| 11-Jul | 50 | 37.9 | 37.7 | −0.250.11 | 0.018 | 38.8 | 38.8 | 0.000.29 | 0.045 | |
| 60 | 38.0 | 37.9 | −0.050.10 | 38.7 | 39.5 | 0.780.35 | ||||
| Mean at 60min | 38.00.13 | 38.20.29 | 0.110.16 | 0.023 | 38.90.20 | 39.10.41† | 0.200.40 | 0.038 | ||
Value is for 55min; bOnly one value at 60min.
Minivan had a significantly higher mean Tc on June 26th in the shade than the remaining two car types.
June 26th resulted in significantly lower Tc values overall as compared to than June 25th and July 11th.
Significantly greater than mean in shade (significance testing only performed on Tc determined through the specific heat approach).
To account for the rise and equilibrating of the core temperature at steady-state to obtain a more realistic Tc pattern [59,60,62], we also plot the equivalent values based on in-vehicle steady-state conditions. In general, this secondary approach follows a similar rise in Tc as the vehicle's heating rate with a quicker temperature increase at the beginning of the period, followed by a leveling off based on the decay rate.
3.3.2. Final Core Temperature Comparisons
Comparisons between the final core temperature approach (Tcf) (Equation 16) and the specific heat capacity Tc estimation approach at 50 minutes and 60 minutes are presented in Table 3. In representing as Tc – Tcf, we find that overall, under all situations, the two estimation types are closely matched, with a mean difference (SD) of = 0.110.16°C in the shade and = 0.200.40°C in the sun. Variability exists between cars and days, however, the strongest agreement at 60 minutes is found in two scenarios: July 11 midsize sedan in shade ( = 0.00±0.22°C), and June 26 economy car in shade ( = 0.01 ± 0.02°C). The lowest agreement and greater variability were found in sun-exposed vehicles, with the poorest agreement in the economy car on July 11 ( = 0.78 ± 0.35°C) and the midsize sedan on June 25 ( = 0.38 ± 0.98°C). In general, the Tcf model predicted lower values than the heat capacity approach. As there are no measured core temperature data to know which method is more accurate, we cannot make assumptions as to which approach may be correct, yet we can conclude that there was strength in agreement between methods. Limitations are presented in Section 4.2.
4. Discussion
4.1. Measuring and Conveying Risk of Pediatric Vehicular Heat Stroke
Numerous studies have demonstrated the ability to easily collect environmental information within an enclosed vehicle to determine heating rates [1,8–10], yet few studies [26–29] have attempted to extend findings to physiological implications of said exposures to children. The current study furthers these efforts to demonstrate an ability to estimate the Tc progression and the time to reach potentially dangerous Tc value under differing solar exposure conditions, vehicle type, and day from similar starting cabin microclimate conditions. Similar research by Grundstein et al. [27,28] also demonstrates methods to estimate the rise in core temperature, showing a quicker increase to higher Tc values under lower temperatures but within higher humidity situations (lower Emax values). The higher humidity limits the potential for evaporative heat loss, whereas the relatively drier air in the current study allowed for a greater amount of evaporative heat loss and slower rise in Tc. The overall combination of extreme high temperature, high radiant loads, and low wind conditions (decreasing the ability to lose heat via evaporation) result in an inability for an infant or child to maintain a stable core temperature around 37°C, which is due to heat transport towards the body overriding heat transport away from the body to the environment [63]. Such conditions have proven to be deadly or cause serious injury as shown in pediatric vehicular heatstroke statistics and studies [1,4,64]. As a child's body heats up towards 40–42°C, an increase in cardiac output occurs, heat stress proteins are created for tissue protection and eventually may reach thermoregulatory failure and organ dysfunction [34,65,66].
Although the sun-exposed conditions are found to reach a Tc of 40°C in one instance after 60 minutes, the hottest days on June 26 and July 11 show the extrapolated values reaching this level in an average of 80 minutes across vehicles, and in just under 2 hours in shaded vehicles. Although these are quite long periods, most of child deaths instances (54%, or 400 deaths in the U.S.) are due to being forgotten in the vehicle [1], and thus not being discovered for 1–2 hours under these circumstances may lead to dangerous core temperatures. Shaded vehicles have less stressful conditions as shown by the slower heating rate of the vehicle and subsequently a slower increase in Tc, and the within-vehicle heat loads reach potentially lethal levels approximately one hour slower than those in the sun.
Although limitations exist due to the assumptions used to estimate Tc data availability (see Section 4.2), the current research aids in providing explanatory information as to why heat illness and death can occur quickly for an infant or small child in an enclosed vehicle, which is needed to emphasize the seriousness of the issue and convey more effective messaging to the public [28].
Even in our technologically-advanced world, human error results in an average of 37 children deaths per year in the U.S. [1], 74% of which are 2 years of age or less, all of which are 100% preventable. Infants and children who survive reaching a Tc of 40–42°C may sustain permanent neurologic damage [35,36]. Thus, although real Tc monitoring of a child entrapped in a hot vehicle is not possible, furthering our understanding of the time course of vehicle heating and Tc rise is needed to provide explanatory reasoning to the public and to support new interventions, including behavioral prevention [67], technological interventions [4], and appropriate actions to take if a child is found in a hot car [68].
Methods of warning or reminder are necessary to prevent death or permanent injury in children and animals [26,67,69]. Although the heat stress risk factors are similar between humans and animals, special thermoregulatory differences in dogs also highlight the seriousness of leaving children or animals in hot vehicles [11,70]. Drivers can be less aware of the issue of heat strain on their child or animal due to air conditioning in the car [67] creating localized thermal comfort. As thermal comfort has a major influence on human behavior and body temperature homeostasis [71], the adult is comfortable, and there may be an enhanced risk that they are unaware of a child's discomfort. Thus, in connection to and support of heat balance modeling, human-factors research strategies are warranted [67] to determine the optimal mechanism for alerting drivers of leaving infants, young children, and animals in parked vehicles.
Although many technological solutions and patents have been proposed [72–74], they have wavered due to industry disinterest, fear of sensor failure and liability, lack of market support, and cost [5]. Hence, educational programs for parents and the public [4], public health prevention literature or slogans [75], improved explanatory messaging, and phone warning applications (e.g. Kars4Kids [76]) remain essential [64]. The new methods and evidence provided here can be leveraged by safety advocates and public health experts in PHV prevention campaigns by providing a health endpoint-relevant explanations (i.e. core temperature leading to heat stroke under a given number of minutes) to increase public perception of the severity and susceptibility to PVH [27]. As we consider the ‘next generation’ of safety devices and policy, integrating data from an array of sensors, assessing real-time risk, and triggering appropriate corrective actions are necessary [74], yet policy is also vital to limit fears of manufacturer liability. For the public, the large majority of states have “Good Samaritan Laws” giving an individual immunity from a lawsuit if they act to protect a life of a child or animal inside of a hot car [77].
4.2. Study Limitations and Future Research
Limitations of this research study should be considered when interpreting results. The value 42°C for hyperthermia as a critical thermal maximum was developed based on adult or mice studies [33,35,78,79]. The value may be even lower for children due to their physiological vulnerabilities, and the baseline core temperature for children may be higher than for adults [80] (we assumed a baseline of 36.8°C). However, Tc measurements in young children and infants rising from a normal to hyperthermic value do not exist, to our knowledge, and experimental studies on infant core temperatures is limited [81], with forensic studies using similar specific heat methods to estimate Tc. We also assumed that the child was not in the sun, and that the actual evaporative heat loss could be estimated from the maximal skin wettedness required for heat balance. Both assumptions may result in an underestimation of the core temperature as higher solar load would increase the heat balance, and assuming a skin wettedness for heat balance lowers the heat balance. Results will also vary by child sex, size, and age, as will the Tc threshold for hyperthermia or heatstroke of the toddler. However, the approximations made are based on available data and average estimations.
In exploring the use of equation 16 to calculate Tcf, it is important to acknowledge that it was developed for men walking in indoor conditions with no solar heat load. However, both methods employed for core temperature estimations in the current study are adjusted for body mass and body surface area to represent exchanges experienced by a child within a car seat. Realistic estimations of core temperature were presented by both models and did not significantly differ when assessing steady state conditions after 60 minutes. Improved modeling can be achieved through measurements of radiation within the vehicle, more frequent measurements of surface temperatures, and modeling the sensitivity of the core temperature to different clothing amounts, size of the child, and/or potential vulnerabilities (dehydrated, ill, immunocompromised) [28].
Our findings constitute further efforts in providing a predictive tool that can be used to determine and convey time to hyperthermia to the public or in aiding with a forensic setting through the knowledge of cabin air temperature and humidity [27]. Further research is required in improved understanding of infants and small children's heat exchange (convection, evaporation, etc.) in stressfully hot conditions, and in improved methods to elicit behavioral changes to lessen the number of children forgotten in hot vehicles.
5. Conclusions
We examined the influence of shade on the thermal environment of three pairs enclosed vehicles in sun or shade across multiple time 60-minute periods on three summertime days in Tempe, AZ. The interior vehicle temperatures demonstrated very hot conditions, with quicker temperature rise in sun-exposed vehicles. In modeling the heat balance and core temperature of a 2-year old male child, the average Tc after 60 minutes in shaded or sun-exposed vehicles was estimated to reach 38.2±0.29°C and 39.1±0.41°C, respectively, with a significantly higher final Tc in sun-exposed vehicles across all days. Extrapolating the rate of Tc rise found an average time of 2.4 hours to reach 40°C in shaded vehicles (1.73–3.13 hr) and 1.43 (1.0–2.12 hr) in sun-exposed vehicles.
This is the first study to assess the impact of solar parasols on interior vehicle thermal environments and child core temperature variations by sun, shade, and car type under extreme temperature and sunny outdoor conditions. Findings and methods demonstrate an ability to provide explanatory reasoning to the public and for the support of new behavioral and technological interventions, as well as the progression towards high core temperatures for infants and toddlers left in hot cars, whether in the sun or shade. At a time when so much is known concerning heating of interior vehicle environments, there is pressing importance to improve health messaging [75], incorporate human behavior and human factors knowledge/research into what we currently know, and urge policy makers to enforce technological solutions.
Funding Statement
The study was supported by ASU Lightworks, PowerParasol®, the Julie Ann Wrigley Global Institute of Sustainability, the International Graduate School IRTG 2057 (DFG, German National Science Foundation), and the Earnhardt Automobile Dealership. M. Poletti was also supported by the National Science Foundation under grant number DEB-1026865, Central Arizona-Phoenix Long-Term Ecological Research (CAP LTER). Any opinions, findings, and conclusions or recommendations expressed in this material are those of the authors and do not necessarily reflect the views of the sponsoring organizations.
Acknowledgements
We extend a special thanks to Robert Boscamp and Kevin White for their assistance and for providing us with the opportunity to conduct this research project. We would also like to thank Courtney Russell, Benjamin Mackowski, and Chhatrapalsinh Jaydevsinh Sisodiya for downloading meteorological data from stationary sensors that provided background weather conditions for this study and for simulating the shopping trips in Lot 59. Additionally, a big thank you is extended to two anonymous reviewers for their very useful comments in helping improve the current paper. Finally, we would also like to thank Nalini Chhetri for managing and coordinating with various agencies in the summer of 2014, Dan Vecellio for help in reviewing, and Silvia Coccolo, Terry Gillespie, and Bob Brown for detailed methods discussions.
Disclosure of Potential Conflicts of Interest
The authors declare no competing conflicts of interest or financial interests to disclose.
References
- [1].Null J. Heatstroke Deaths of Children in Vehicles. http://noheatstroke.org. Published 2017.
- [2].NHSTA Traffic Safety Facts; 2009. [Google Scholar]
- [3].McLaren C, Null J, Quinn J. Heat stress from enclosed vehicles: moderate ambient temperatures cause significant temperature rise in enclosed vehicles. Pediatrics. 2005;116(1):e109–e112. doi: 10.1542/peds.2004-2368. PMID:15995010 [DOI] [PubMed] [Google Scholar]
- [4].Guard A, Gallagher SS. Heat related deaths to young children in parked cars: an analysis of 171 fatalities in the United States, 1995–2002. Inj Prev. 2005;11(1):33–37. doi: 10.1136/ip.2003.004044. PMID:15691987 [DOI] [PMC free article] [PubMed] [Google Scholar]
- [5].Weingarten G. Fatal Distraction: Forgetting a child in the backseat of a car is a horrifying mistake. Is it a Crime? Washington Post. July 2016. http://journalismcenter.org/when-a-child-dies/fatal-distraction.html [Google Scholar]
- [6].Costa D, Grundstein A. An analysis of children left unattended in parked motor vehicles in Brazil. Pike I, Macpherson A, eds. Int J Environ Res Public Health. 2016;13(7):649. doi: 10.3390/ijerph13070649. [DOI] [PMC free article] [PubMed] [Google Scholar]
- [7].Child Safety Europe Children in hot cars: hyperthermia. Birmingham, UK; 2014. http://www.childsafetyeurope.org/publications/info/factsheets/children-in-cars.pdf. [Google Scholar]
- [8].Null J. Study of excessive temperatures in enclosed vehicles. San Jose, CA: San Jose State University; 2003. http://ggweather.com/heat/heat%20study.pdf. [Google Scholar]
- [9].King K, Negus K, Vance JC. Heat stress in motor vehicles: a problem in infancy. Pediatrics. 1981;68(4):579–582. PMID:7322691 [PubMed] [Google Scholar]
- [10].Grundstein A, Meentemeyer V, Dowd J. Maximum vehicle cabin temperatures under different meteorological conditions. Int J Biometeorol. 2009;53(3):255–261. doi: 10.1007/s00484-009-0211-x. PMID:19234721 [DOI] [PubMed] [Google Scholar]
- [11].Horak J, Schmerold I, Wimmer K, et al. Cabin air temperature of parked vehicles in summer conditions: life-threatening environment for children and pets calculated by a dynamic model. Theor Appl Climatol. 2017;130(1–2):107–118. [Google Scholar]
- [12].Vanos J. Children's health and vulnerability in outdoor microclimates: A comprehensive review. Environ Int. 2015;76:1–15. doi: 10.1016/j.envint.2014.11.016. PMID:25497108 [DOI] [PubMed] [Google Scholar]
- [13].Dadour IR, Almanjahie I, Fowkes ND, et al. Temperature variations in a parked vehicle. Forensic Sci Int. 2011;207(1):205–211. doi: 10.1016/j.forsciint.2010.10.009. PMID:21067876 [DOI] [PubMed] [Google Scholar]
- [14].Roberts KB, Roberts EC. The automobile and heat stress. Pediatrics. 1976;58(1):101–104. PMID:934765 [PubMed] [Google Scholar]
- [15].Surpure JS. Heat-related illness and the automobile. Ann Emerg Med. 1982;11(5):263–265. doi: 10.1016/S0196-0644(82)80097-8. PMID:7073050 [DOI] [PubMed] [Google Scholar]
- [16].Kravchenko J, Abernethy AP, Fawzy M, et al. Minimization of heatwave morbidity and mortality. Am J Prev Med. 2013;44(3):274–282. doi: 10.1016/j.amepre.2012.11.015. PMID:23415125 [DOI] [PubMed] [Google Scholar]
- [17].Zhang K, Chen T-H, Begley CE. Impact of the 2011 heat wave on mortality and emergency department visits in Houston, Texas. Environ Heal. 2015;14(1):11. doi: 10.1186/1476-069X-14-11. [DOI] [PMC free article] [PubMed] [Google Scholar]
- [18].Knowlton K, Rotkin-Ellman M, King G, et al. The 2006 California heat wave: Impacts on hospitalizations and emergency department visits. Environ Health Perspect. 2009;117(1):61–67. doi: 10.1289/ehp.11594. PMID:19165388 [DOI] [PMC free article] [PubMed] [Google Scholar]
- [19].Calkins MM, Isaksen TB, Stubbs BA, et al. Impacts of extreme heat on emergency medical service calls in King County, Washington, 2007–2012: relative risk and time series analyses of basic and advanced life support. Environ Heal. 2016;15(1):13. doi: 10.1186/s12940-016-0109-0. [DOI] [PMC free article] [PubMed] [Google Scholar]
- [20].Basu R. High ambient temperature and mortality: a review of epidemiologic studies from 2001 to 2008. Env Heal. 2009;8(1):40. doi: 10.1186/1476-069X-8-40. [DOI] [PMC free article] [PubMed] [Google Scholar]
- [21].Fabbri K. Thermal comfort evaluation in kindergarten: PMV and PPD measurement through datalogger and questionnaire. Build Environ. 2013;68:202–214. doi: 10.1016/j.buildenv.2013.07.002. [DOI] [Google Scholar]
- [22].Falk B, Dotan R. Temperature regulation and elite young athletes. In: The Elite Young Athlete. Vol. 56 Basel: Karger Publishers; 2011. p. 126–149. [DOI] [PubMed] [Google Scholar]
- [23].Tsuzuki-Hayakawa K, Tochihara Y, Ohnaka T. Thermoregulation during heat exposure of young children compared to their mothers. Eur J Appl Physiol Occup Physiol. 1995;72(1):12–17. doi: 10.1007/BF00964108. PMID:8789564 [DOI] [PubMed] [Google Scholar]
- [24].Gomes LHLS, Carneiro-Júnior MA, Marins JCB. Thermoregulatory responses of children exercising in a hot environment. Rev Paul Pediatr. 2013;31(1):104–110. doi: 10.1590/S0103-05822013000100017. PMID:23703052 [DOI] [PubMed] [Google Scholar]
- [25].Duzinski S V, Barczyk AN, Wheeler TC, et al. Threat of paediatric hyperthermia in an enclosed vehicle: a year-round study. Inj Prev. 2013;(4):220–225. PMID:24246714 [DOI] [PubMed] [Google Scholar]
- [26].Grundstein A, Dowd J, Meentemeyer V. Quantifying the heat-related hazard for children in motor vehicles. Bull Am Meteorol Soc. 2010;91(9):1183–1191. doi: 10.1175/2010BAMS2912.1. [DOI] [Google Scholar]
- [27].Grundstein AJ, Duzinski S V, Dolinak D, et al. Evaluating infant core temperature response in a hot car using a heat balance model. Forensic Sci Med Pathol. 2015;11(1):13–19. doi: 10.1007/s12024-014-9619-7. PMID:25332172 [DOI] [PubMed] [Google Scholar]
- [28].Grundstein A, Duzinski S, Null J. Impact of dangerous microclimate conditions within an enclosed vehicle on pediatric thermoregulation. Theor Appl Climatol. 2017;127(1-2):103–110. doi: 10.1007/s00704-015-1636-2. [DOI] [Google Scholar]
- [29].Alunni V, Crenesse D, Pierccechi-Marti M-D, et al. Fatal heat stroke in a child entrapped in a confined space. J Forensic Leg Med. 2015;34:139–144. doi: 10.1016/j.jflm.2015.05.011. PMID:26165673 [DOI] [PubMed] [Google Scholar]
- [30].Székely M, Carletto L, Garami A. The pathophysiology of heat exposure. Temp Multidiscip Biomed J. 2015;2(4):452. [DOI] [PMC free article] [PubMed] [Google Scholar]
- [31].Gagnon D, Kenny GP. Sex modulates whole-body sudomotor thermosensitivity during exercise. J Physiol. 2011;589(24):6205–6217. doi: 10.1113/jphysiol.2011.219220. PMID:22005684 [DOI] [PMC free article] [PubMed] [Google Scholar]
- [32].Jay O, Cramer MN. A new approach for comparing thermoregulatory responses of subjects with different body sizes. 2015;2:42–43. doi: 10.1080/23328940.2014.996093 [DOI] [PMC free article] [PubMed] [Google Scholar]
- [33].Bynum GD, Pandolf KB, Schuette WH, et al. Induced hyperthermia in sedated humans and the concept of critical thermal maximum. Am J Physiol Integr Comp Physiol. 1978;235(5):R228–R236. [DOI] [PubMed] [Google Scholar]
- [34].Bouchama A, Knochel JP. Heat stroke. N Engl J Med. 2002;346(25):1978–1988. PMID:12075060 [DOI] [PubMed] [Google Scholar]
- [35].Knochel JP, Reed G. Disorders of heat regulation. Maxwell Kleeman's clin disord fluid electrolyte Metab. 5th ed New York: McGraw-Hill; Vol. 1994 p. 1549–1590. [Google Scholar]
- [36].Dematte JE, O'Mara K, Buescher J, et al. Near-fatal heat stroke during the 1995 heat wave in Chicago. Ann Intern Med. 1998;129(3):173–181. PMID:9696724 [DOI] [PubMed] [Google Scholar]
- [37].Koul R, Al-Futaisi A, Al-Sadoon M, et al. Vehicular entrapment and heat stroke in three children: is it a form of child neglect? Oman Med J. 2010;25(3):222–224. PMID:22043342 [DOI] [PMC free article] [PubMed] [Google Scholar]
- [38].Garami A, Székely M. Body temperature. Temperature. 2014;1(1):28–29. doi: 10.4161/temp.29060. [DOI] [PMC free article] [PubMed] [Google Scholar]
- [39].Raja IA, Nicol JF. A technique for postural recording and analysis for thermal comfort research. Appl Ergon. 1997;27(3):221–225. [DOI] [PubMed] [Google Scholar]
- [40].Brown RD, Gillespie TJ. Estimating outdoor thermal comfort using a cylindrical radiation thermometer and an energy budget model. Int J Biometeorol. 1986;30(1):43–52. PMID:3699925 [DOI] [PubMed] [Google Scholar]
- [41].Kenny NA, Warland JS, Brown RD, et al. Part B: Revisions to the COMFA outdoor thermal comfort model for application to subjects performing physical activity. Int J Biometeorol. 2009;53:429–441. PMID:19396619 [DOI] [PubMed] [Google Scholar]
- [42].Vanos J, Warland J, Gillespie T, et al. Thermal comfort modelling of body temperature and psychological variations of a human exercising in an outdoor environment. Int J Biometeorol. 2012;56(1):21–32. PMID:21188424 [DOI] [PubMed] [Google Scholar]
- [43].Vanos JK, Herdt AJ, Lochbaum MR. Effects of physical activity and shade on the heat balance and thermal perceptions of children in a playground microclimate. Build Environ. 2017;126:119–131. doi: 10.1016/j.buildenv.2017.09.026. PMID:2939877129398771 [DOI] [Google Scholar]
- [44].Kenny NA, Warland JS, Brown RD, et al. Part A: Assessing the performance of the COMFA outdoor thermal comfort model on subjects performing physical activity. Int J Biometeorol. 2009;53(5):415–428. PMID:19396470 [DOI] [PubMed] [Google Scholar]
- [45].Brown RD, Gillespie TJ. Microclimate Landscape Design: Microclimatic Landscape Design: Creating Thermal Comfort and Energy Efficiency. New York: John Wiley & Sons, Inc; 1995. [Google Scholar]
- [46].Vanos JK, Warland JS, Gillespie TJ, et al. Thermal comfort modelling of body temperature and psychological variations of a human exercising in an outdoor environment. Int J Biometeorol. 2012;56(1):21–32. doi: 10.1007/s00484-010-0393-2. [DOI] [PubMed] [Google Scholar]
- [47].Harlan SL, Brazel AJ, Prashad L, et al. Neighborhood microclimates and vulnerability to heat stress. Soc Sci Med. 2006;63(11):2847–2863. PMID:16996668 [DOI] [PubMed] [Google Scholar]
- [48].Schofield WN. Predicting basal metabolic rate, new standards and review of previous work. Hum Nutr Clin Nutr. 1985;39:5–41. PMID:4044297 [PubMed] [Google Scholar]
- [49].Dubois D, Dubois EF. A formula to estimate the surface area if height and weight are known. Arch Intern Med. 1916;17:863. [Google Scholar]
- [50].Fanger PO. Thermal Comfort. Analysis and Application in Environmental Engineering. Copenhagen: Danish Technical Press; 1970. [Google Scholar]
- [51].NSRDB National solar radiation 1998-2014 updated dataset. 2017. http://rredc.nrel.gov/solar/old_data/nsrdb/.
- [52].Montieth J, Unsworth M. Principles of environmental biophysics. 3rd ed Elsevier; 2008. [Google Scholar]
- [53].Kenny NA, Warland JS, Brown RD, et al. Estimating the radiation absorbed by a human. Int J Biometeorol. 2008;52(6):491–503. PMID:18273649 [DOI] [PubMed] [Google Scholar]
- [54].Campbell GS, Norman JM. An Introduction to Environmental Biophysics. Second ed New York: Springer; 1998. [Google Scholar]
- [55].Blazejczyk K. New climatological-and-physiological model of the human heat balance outdoor (MENEX) and its applications in bioclimatological studies in different scales. Zesz IgiPZ PAN. 1994;28:27–58. [Google Scholar]
- [56].Höppe P. Different aspects of assessing indoor and outdoor thermal comfort. Energy Build. 2002;34(6):661–665. [Google Scholar]
- [57].Kreith F, Black W. Basic heat transfer. New York: Harper and Row; 1980. [Google Scholar]
- [58].Leon LR, Bouchama A. Heat stroke. Compr Physiol. 2015;5:611–647. PMID:25880507 [DOI] [PubMed] [Google Scholar]
- [59].Givoni B, Goldman RF. Predicting rectal temperature response to work, environment, and clothing. J Appl Physiol. 1972;32(6):812–822. PMID:5034345 [DOI] [PubMed] [Google Scholar]
- [60].Chan NY, Stacey MT, Smith AE, et al. An empirical mechanistic framework for heat-related illness. Clim Res. 2001;16(2):133–143. [Google Scholar]
- [61].Vanos JK, Linseman M, Spreit L, et al. Validation of predictive sweat rate and core temperature equations during intense exercise through application of the COMFA outdoor energy budget model. 19th International Congress of Biometeorology; Auckland: NZ; 2011. [Google Scholar]
- [62].Havenith G, Fiala D. Thermal indices and thermophysiological modeling for heat stress. Compr Physiol. 2016;6(1):255–302. [DOI] [PubMed] [Google Scholar]
- [63].Kingma BRM, Frijns AJH, Schellen L, et al. Beyond the classic thermoneutral zone. Temperature. 2014;1(2):142–149. doi: 10.4161/temp.29702. [DOI] [PMC free article] [PubMed] [Google Scholar]
- [64].Ferrara P, Vena F, Caporale O, et al. Children left unattended in parked vehicles: a focus on recent italian cases and a review of literature. Ital J Pediatr. 2013;39(1):71. PMID:24195780 [DOI] [PMC free article] [PubMed] [Google Scholar]
- [65].Epstein Y, Roberts WO. The pathopysiology of heat stroke: an integrative view of the final common pathway. Scand J Med Sci Sports. 2011;21(6):742–748. PMID:21635561 [DOI] [PubMed] [Google Scholar]
- [66].Leon LR, Helwig BG. Heat stroke: role of the systemic inflammatory response. J Appl Physiol. 2010;109(6):1980–1988. PMID:20522730 [DOI] [PubMed] [Google Scholar]
- [67].Mawson AR, Guignard JC. Preventing heat-induced death in vehicles. Am J Prev Med. 2002;23(3):233–234. doi: 10.1016/S0749-3797(02)00504-4. PMID:12350460 [DOI] [PubMed] [Google Scholar]
- [68].Jardine DS. Heat illness and heat stroke. Pediatr Rev. 2007;28(7):249. PMID:17601937 [DOI] [PubMed] [Google Scholar]
- [69].Bruchim Y, Loeb E, Saragusty J, et al. Pathological findings in dogs with fatal heatstroke. J Comp Pathol. 2009;140(2):97–104. PMID:19111315 [DOI] [PubMed] [Google Scholar]
- [70].Bruchim Y, Horowitz M, Aroch I. Pathophysiology of heatstroke in dogs – revisited. Temperature. 2017;4(4):356–370. doi: 10.1080/23328940.2017.1367457. [DOI] [PMC free article] [PubMed] [Google Scholar]
- [71].Romanovsky AA. Thermoregulation: some concepts have changed. Functional architecture of the thermoregulatory system. Am J Physiol Integr Comp Physiol. 2007;292(1):R37–R46. [DOI] [PubMed] [Google Scholar]
- [72].Silveira OL. Vehicle alarm system for alerting a vehicle operator that the vehicle is still occupied with a child or pet. September 2014. https://www.google.com/patents/US8841997.
- [73].Hules FJ, Hoshide BA. Occupant Detection and Temperature Forewarn Safety System and Method. March 2008. [Google Scholar]
- [74].Aiello V, Borazjani PN, Battista E, et al. Next-generation technologies for preventing accidental death of children trapped in parked vehicles. Information Reuse and Integration (IRI), 2014 IEEE 15th International Conference on. IEEE; 2014. p. 508–513. [Google Scholar]
- [75].Williams C, Grundstein A. Children forgotten in hot cars: a mental models approach for improving public health messaging. Inj Prev. 2017. https://getd.libs.uga.edu/pdfs/williams_castle_a_201605_ms.pdf. PMID:28794064 [DOI] [PubMed] [Google Scholar]
- [76].Kars4Kids Kars 4 Kids Safety App. 2017. http://www.kars4kids.org/safety-app/.
- [77].Safe Kids Worldwide State Good Samaritan Laws. 2014. https://www.safekids.org/sites/default/files/documents/publicpolicylibrary/good_samaritan_laws.pdf.
- [78].Bouchama A, Knochel JP. Medical progress: heat stroke. N Engl J Med. 2002;346:1978–1988. PMID:12075060 [DOI] [PubMed] [Google Scholar]
- [79].Leon LR, Gordon CJ, Helwig BG, et al. Thermoregulatory, behavioral, and metabolic responses to heatstroke in a conscious mouse model. Am J Physiol Integr Comp Physiol. 2010;299(1):R241–R248. [DOI] [PubMed] [Google Scholar]
- [80].Niehues T. The febrile child: diagnosis and treatment. Dtsch Arztebl Int. 2013;110(45):764–774. doi: 10.3238/arztebl.2013.0764. PMID:24290365 [DOI] [PMC free article] [PubMed] [Google Scholar]
- [81].Garcia-Souto MDP, Dabnichki P. Core and local skin temperature: 3–24 months old toddlers and comparison to adults. Build Environ. 2016;104:286–295. [Google Scholar]