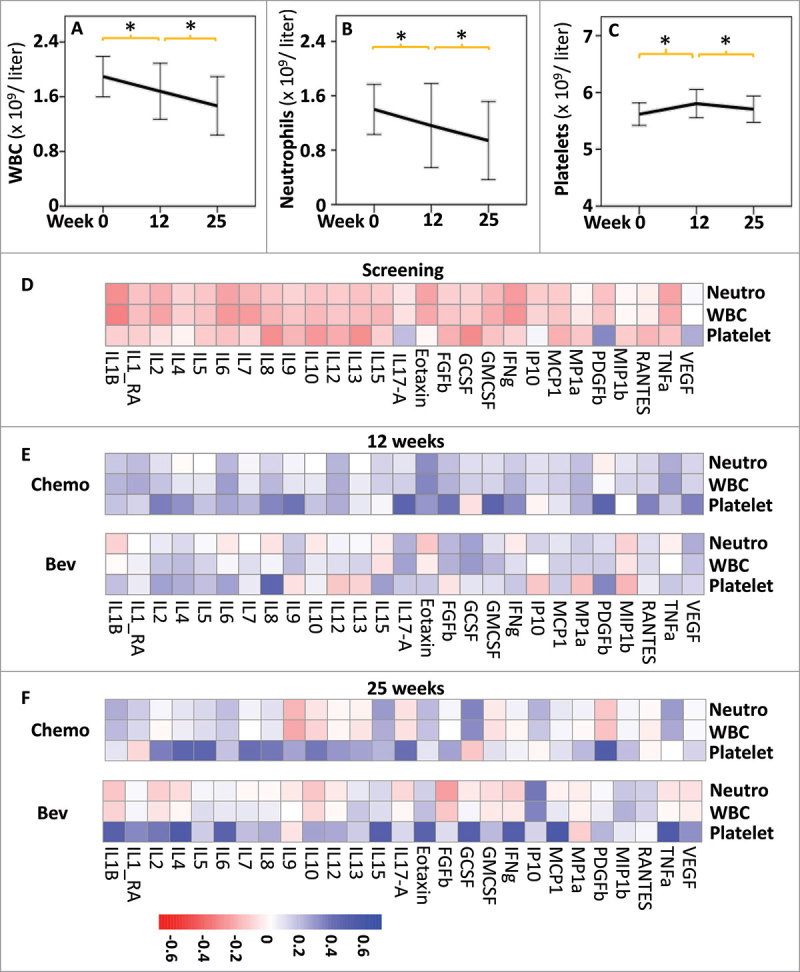
Figure 3.

Effects of treatments on blood cell counts and correlation with cytokines levels. Comparison of the blood cell counts (109 per liter): white blood cells (WBC, A), neutrophils (Neutro, B) and platelets (C), at the different time points of treatment. * indicates t-test P < 0.01 between two successive time points, error bars represent standard deviation. Heatmap showing Spearman rank correlations between cytokine levels and blood cell counts at screening n = 98, (D), 12 weeks, (n = 44, Bev; n = 41, Chemo) (E) and 25 weeks (n = 40, Bev; n = 40, Chemo) (F). All correlations are shown independently of p values. Heatmaps were obtained using the pheatmap R package.
