Abstract
Polyaniline in form of emeraldine salt and emeraldine base was used as a matrix to attach several labeled and non-labeled dioxin selective pentapeptides both directly to the polymer and using glutaraldehyde as a linker. The peptides have been selected as a model to study the binding process due to their smaller size, lower sensitivity to the environment and potential application as solid state extraction reagents for chlorinated toxins. The composition and the properties of the compounds were investigated by means of elemental analysis, XPS, FTIR, UV/vis, and fluorescence spectroscopy. The results have shown that 3.30–7.76% peptides were attached to the emeraldine base both with and without a linker. Glutaraldehyde and the peptides were connected to the matrix via chemical bond resulting in formation of compounds whit similar composition and stability in a broad pH range. The influence of the linker and the peptides on the electronic properties and composition of the polymer have been investigated by principal component analysis.
Keywords: Polyaniline, Glutaraldehyde, Small peptides, UV/vis, Fluorescence, PCA
1. Introduction
Polyaniline (PANI), a conducting polymer known for more than a century, has been rediscovered by the scientific community about three decades ago. Currently, it is one of the most studied polymers due to its electrical conductivity, low toxicity, environmental stability and broad application potential [1–17,33–40].
Polyaniline can easily be synthesized by oxidative or enzymatic polymerization of aniline. Material with desired structure and properties can be obtained by varying the reaction conditions, co-polymerization, and utilizing appropriate doping agents [1–17].
Because of its chemical and environmental stability, polyaniline can provide a suitable support for immobilization of binding agents for chemical and biological sensors [14–17].
Glutaraldehyde (GA) is one of the most popular bi-functional reagents used to provide crosslinking between the polymeric matrix and the corresponding ligands in a heterogeneous sensor. Despite its widespread application, the chemistry behind the binding is far from clear and sometimes controversial. The processes are very often oversimplified suggesting the formation of two Schiff bases involving both aldehyde groups of GA to be the only possible outcome of the reaction. In fact, GA itself undergoes variety of reactions thus existing in many different forms in aqueous solution. In addition to the Schiff base formation, GA may react with proteins by other means, including aldol condensation and Michael type addition [14–23].
The design and synthesis of an effective sensitizing agent requires deeper understanding about the binding and stability of the ligands on the heterogeneous carrier. It is important to assess the amount of ligands connected to the matrix, as well as their distribution, geometry, and resistance to the reaction media. While small molecules are less sensitive to geometrical changes, for proteins it is crucial to preserve the proper structure of the catalytic center and the molecule as a whole in order to effectively bind to the target species.
PCBs and dioxins are toxins readily available from industrial sources. They undergo biodegradation very slowly and can be used for malicious contamination for food and water for terrorist purposes. A monitoring program is available only for limited number of foods because the existing analytical procedures are time consuming, involve variety of chemicals and reagents and therefore are quite expensive. Decontamination procedures are also rarely applied due to high cost and low efficiency. Due to the low concentration of the analytes and the complicated sample matrixes the analysis as described in the current EPA protocol requires long preparation steps involving multiple solvent extractions, purifications and concentrations [24–32].
Recent research has shown that small peptides selected through combinatorial methods of computational simulations, have great potential to selectively bind PCBs and dioxins. They can eventually be used as solid phase extraction (SPE) media thus offering a promising alternative to both liquid–liquid and Soxhlet extraction [33,34].
The present study employs several dioxin-selective pentapeptides as a model to create a heterogeneous chemosensor on polyaniline matrix and investigate its stability and binding properties. The peptides have been selected by Nakamura et al. [33,34] using combinatorial approach and competitive binding reaction between chlorinated dioxins and labeled dioxin-like compound with peptide library on polymer beads. For the purposes of this study, the peptides have been labeled with fluorescence markers at the C- or N-end, thus leaving the other end available for binding. The original, dioxin-selective peptides have also been modified in order to study the role of some key amino acids in the binding process. The peptides were incorporated into the PANI matrix both with and without the GA linker. The interaction between the polymer, crosslinking reagent, and the peptides has been investigated by variety of methods: X-ray photoelectron spectroscopy (XPS), infrared spectroscopy (FTIR), elemental analysis, absorption spectroscopy (UV/vis), and fluorescence. Principal component analysis (PCA) has been applied to clarify the type of bonding between the peptides and the matrix.
2. Experimental
2.1. Materials and methods
Aniline (99.5%), ammonium persulfate (APS) (98%), phosphate buffer powder, 0.1 M, glutaraldehyde solution (25%), hydrochloric acid (37%), ammonium hydroxide (28–30%), isopropanol, HPLC grade, 1-methyl-2-pyrrolidinone (NMP, spectroscopic grade), and methanol (spectroscopic grade) were purchased from Sigma Aldrich. FLDQV, FLDGV, FLDQV-AMC and FLDGV-AMC were obtained from Biomatic, Inc., Ontario, Canada.
The absorption spectra were recorded on Shimadzu 240IPC spectrophotometer. The emission spectra were recorded on Perkin Elmer Lambda 55 spectrofluorimeter. The XPS measurements were performed on an SSX-100 system (Surface Science Instruments) quipped with a monochromated Al Kα X-ray source, a hemispherical sector analyzer (HSA) and a resistive anode detector. Each sample was mounted on a sample stage using a piece of adhesive Al tape on top of a double-side carbon tape. Care was taken to ensure that the samples fully covered the surfaces. The base pressure of the XPS system was 4.0 × 10⁻¹⁰ Torr. During the data collection, the pressure was 7.0 × 10⁻⁹ to 2.0 × 10⁻⁸ Torr.
The elemental analysis was done by Galbraight Labs, Inc.
2.2. Synthesis
2.2.1. Synthesis of polyaniline (PANI) as emeraldine salt (ES) and emeraldine base (EB)
Emeraldine salt (ES) and emeraldine base were synthesized as described previously [1,2,11].
20 mL (0.219 mol) of aniline was dissolved in 300 mL of 1 M HCl solution, and the solution was precooled to 0 °C. 11.57 g of (0.0504 mol) ammonium persulfate was dissolved in 200 mL 1 M HCl and also pre-cooled to 0 °C in ice bath.
The ammonium persulfate solution was slowly poured into the previously made aniline HCl solution in an ice bath. The mixture was stirred for 2 h at 0 °C.
The residue was collected by vacuum filtration and washed with 100 mL of 1 M HCl five times. This reaction was done both at 0 °C and room temperature. The ES polymer was recovered by filtration and washed 5× 100 mL 1 M HCl solution.
ES was resuspended in 250 mL of 0.1 M NH4OH and the mixture was left to stir for overnight at room temperature. The product was recovered by vacuum filtration, washed 5× 0.1 M 100 mL NH4OH, 3× 100 mL distilled H2O, and 3× 100 mL of 2-propanol. EB was then left to dry at room temperature first, then dried in vacuum at 50 °C.
2.2.2. Immobilization of GA on ES and EB (ES-GA and EB-GA)
2 g of dried PANI (EB and ES) was treated with 200 mL of glutaraldehyde solution 2.5% (v/v) prepared in 0.1 M phosphate buffer solution, pH 7.6. Two parallel samples were prepared; one was stirred under reflux and heating, and another solution was stirred at room temperature for overnight. EB-GA and ES-GA were collected on a Buchner funnel, washed with 0.1 M phosphate buffer, pH 7.6 and dried in vacuum at 50 °C [16–18].
2.2.3. Immobilization of peptides on EB, ES-GA and EB-GA
25 mg (3.5 × 10⁻⁵ mol L−1) of pentapeptide, FLDGV-AMC were dissolved in 50 mL of phosphate buffer and a few drops of methanol were added to homogenize the solution [15,16].
100 mg of EB, EB-GA, or ES-GA respectively were treated with the peptide solution, and left to stir for 24 h at room temperature.
The samples were filtered, washed with phosphate buffer solution and left to air dry before analysis.
All peptides employed in this study were immobilized similarly. We refer to the products of this reaction as follows: EB-FLDQV-AMC, EB-FLDGV-AMC, ES-GA-FLDQV-AMC, EB-GA-FLDQV-AMC, ES-GA-FLDGV-AMC, EB-GA-FLDGV-AMC, EB-GA-FLDQV, EB-GA-FLDGV, ES-GA-FLDQV, and ES-GA-FLDGV.
2.3. Spectroscopic measurements
2.3.1. UV/vis spectra
Solutions of the following compounds: EB, EB-GA, FLDGV-AMC, FLDQV-AMC, EB-FLDQV-AMC, EB-FLDGV-AMC, EB-GA-FLDQV-AMC, and EB-GA-FLDGV-AMC, were prepared in NMP in concentrations 0.01 mg/mL and 0.05 mg/mL. The absorption spectra were recorded five times and the data were subjected to PCA.
2.3.2. Fluorescence measurements
Solutions of FLDQV-AMC, FLDGV-AMC, EB-FLDQV-AMC, EB-FLDGV AMC, EB-GA-FLDQV-AMC, and EB-GA-FLDGV-AMC in NMP were prepared in concentrations from 10−3 to 10−6 mg/mL. The emission was measured at 391.5 nm (λex 334 nm).
2.3.3. Stability of the immobilized peptides on the matrix
The peptides immobilized on the polymer matrix with, or without linker, were tested for leaching as follows: 1.7–2.2 mg of the substance were suspended in buffers with different pH ranging from 1 to 10. The suspensions were stirred at room temperature and the solution was tested periodically by TLC for presence of the labeled peptide. The fluorescent spectra were recorded after 24 h and the amount of peptide in the solution was quantified using a standard curve based on the non-bonded labeled peptides.
2.4. Principal component analysis (PCA)
The absorption spectra measurements provide a representation of the samples in a high dimensional space with 1061 coordinates – the measured wavelengths. Thus, it becomes important to represent data in a more compact way while preserving the experimental variability. One of the commonly used in the field of chemometrics [41–43] dimensionality reduction approaches is PCA. The objective of this pattern recognition technique is to determine which variables account for the observed variability in data. In our specific case the variables of interest are the measured absorption wavelengths. PCA determines which linear combination of those variables contributes most significantly to data variability. The method also often leads to dimensionality reduction which is particularly important in the case of measuring absorption spectra. This particular aspect of PCA allows for regression testing in the reduced dimensionality data space which ultimately improves the statistical significance of the inferred regression models. Linear regression models of chemical mixtures are of special interest because linear dependencies of absorptions spectra between two or more compounds provide evidence for the absence of strong chemical bonds in the mixture.
3. Results and discussion
3.1. Elemental analysis, XPS data and FTIR spectra
According to Nakamura et al. [33], the internal amino acids, LDQ in the “original” dioxin binding pentapeptide FLDQV cannot be substituted by other amino acids. In this study, glutamine was substituted by glycine thus obtaining FLDGV, in order to study the binding ability of the compounds to the polyaniline matrix and later, the binding to PCBs and dioxins both in solution and in solid state. In order to trace the peptide on the heterogeneous sensor, it was labeled with AMC fluorescent marker at the C-end. FLDQV, FLDGV, FLDQV-AMC and FLDGV-AMC were attached to the ES and EB matrices with or without GA as a linker.
No functional groups belonging to GA, or any of the peptides, have been identified in the infrared spectra of ES-GA, EB-GA, EB-FLDQV-AMC, EB-FLDGV AMC, EB-GA-FLDQV-AMC, and EB-GA-FLDGV-AMC. This may be due to the small amount of GA and peptides on the surface of the polymer, as well to the closeness of some peptide frequencies to the high intensity absorptions of the EB and ES. In all derivatives, peaks corresponding to both reduced and oxidized units of the polymer were present, at 826, 1164, 1298, 1493 and 1588 cm−1, where the most intensive were the benzenoid and quinoid absorptions at 1493 and 1588 cm−1, correspondingly.
Elemental analysis and XPS analysis were further applied to confirm the attachment of GA and peptides to the polymer matrix. Table 1 summarizes the elemental analysis data. Oxygen is not a part of the polyaniline structure and its presence there has not been clarified. Our analysis showed 6.94% oxygen in the ES and 2.43% in the EB. Some studies [35,36] assign the oxygen to the presence of water in the polymer. The presence of oxygen was also confirmed by XPS analysis indicating that it is rather covalently bounded to the polymer. Treatment of the ES and EB with pH 7.6 buffer reduces the oxygen content by 1.18% in the former and increases it by 0.27% in the latter. Attachment of GA to the buffer treated species lead to 5.52% and 6.50% increase in oxygen content in the ES and EB correspondingly. Further increase of the oxygen content by 3.86% and 5.23% has been observed when peptides were attached to the GA treated samples. The same trend is also evident from the XPS data. Since the reaction media itself does not cause the increase in the oxygen amount, the latter is due to the covalent binding of the linker, GA, and the peptides, to the polyaniline matrix.
Table 1.
Elemental analysis and XPS elemental analysis data of the investigated substances.
| Elements | Methods | Substances | |||||||
|---|---|---|---|---|---|---|---|---|---|
|
|
|||||||||
| ES | EB | ES/buffer | EB/buffer | ES-GA | EB-GA | ES-GA-peptide | EB-GA-peptide | ||
| %C | EA | 60.15 | 75.00 | 68.78 | 73.33 | 67.49 | 68.89 | 62.99 | 63.81 |
| XPS | 61.00 | 78.00 | 81.00 | 82.62 | 70.13 | 78.6 | 75.28 | 74.25 | |
| %H | EA | 5.05 | 5.12 | 4.95 | 5.20 | 5.47 | 5.28 | 5.27 | 5.40 |
| XPS | – | – | – | – | – | – | – | – | |
| %N | EA | 11.80 | 15.09 | 12.93 | 13.38 | 9.98 | 10.60 | 11.24 | 11.22 |
| XPS | 10.32 | 12.00 | 12.70 | 13.49 | 11.06 | 10.98 | 11.78 | 8.32 | |
| %O | EA | 6.94 | 2.43 | 5.76 | 2.70 | 11.28 | 9.20 | 15.14 | 14.43 |
| XPS | 8.50 | 3.35 | 5.13 | 3.88 | 13.01 | 9.04 | 14.79 | 14.19 | |
| %Cl | EA | – | – | <3 | 0.19 | – | – | – | – |
| XPS | 8.32 | – | 0.63 | – | – | – | – | – | |
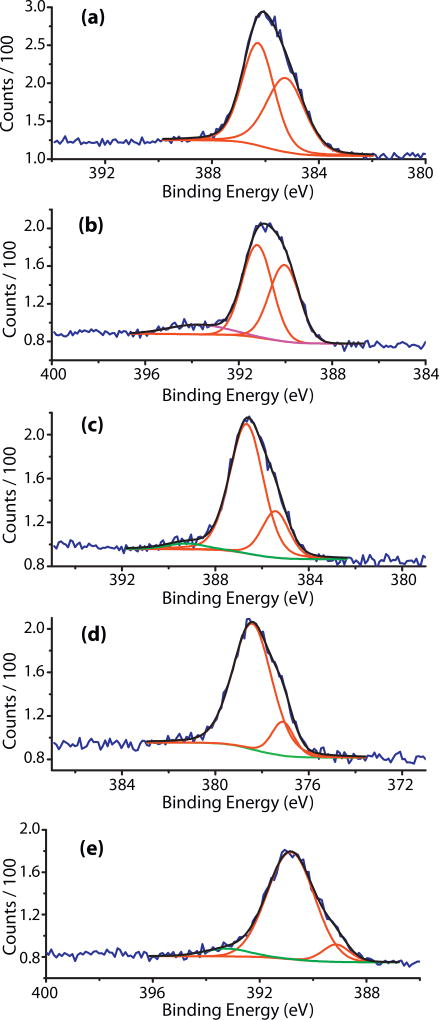
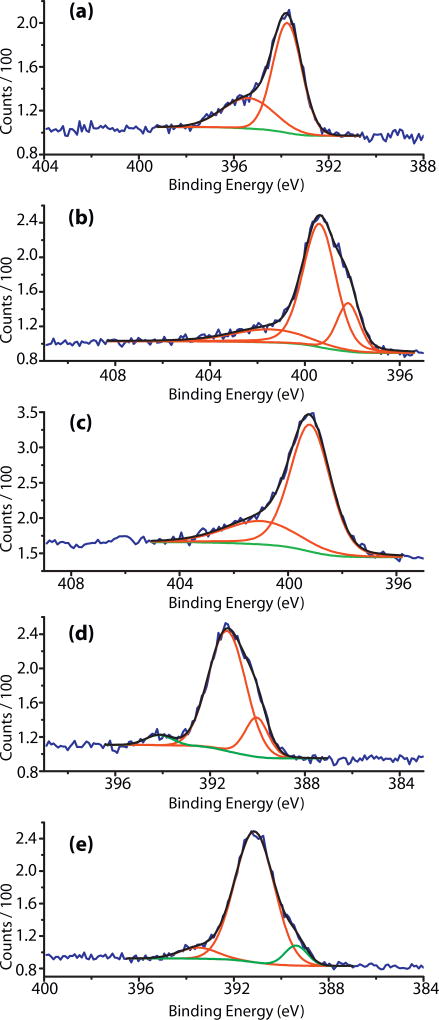
Figs. 1 and 2a–e represent the N 1s XPS spectra of the investigated samples and Table 2 contains the deconvolution results. Figs. S1–S4 and Tables S1 and S2 in the supplemental material contain information about the oxygen and carbon XPS spectra and deconvolution results. ES XPS spectrum shows high concentration of positively charged nitrogen atoms – protonated imine nitrogens and amine cation radicals. After treatment with a buffer, the major component of the spectrum is the amine nitrogen and there are two smaller peaks, one at lower (398.77 eV) and one at higher binding energy (402.08 eV), for the imine and positively charged nitrogens, correspondingly. This result is in agreement with the elemental analysis data showing that the buffer causes significant de-doping in the ES polymer. Addition of GA to the buffer treated ES results in one major peak (75.27%) for the amine nitrogens and one broad band in the high energy part (401.74 eV) for the amine cation radicals. After the attachment of the non-labeled peptide, FLDGV, the dominating species are the cation radicals while the amine nitrogens are 17.17% [37–39]. The appearance of a broad peak at 403.71 eV is due to the N 1s shake up satellite of the ionized nitrogen atoms [40]. In the XPS spectrum of ES-GA-FLDQV-AMC, cation radicals are 85.59% of all nitrogens. The appearance of two almost identical peaks at lower (398.25 eV, imine) and higher binding energy (402.38 eV, protonated imine) indicated that the benzenoid structural units were oxidized and about 50% of the imine nitrogens were protonated.
Fig. 1.
N 1s XPS spectra: (a) EB polymer; (b) EB/buffer; (c) EBGA; (d) EBGA-FLDGV-AMC; (e) EBGA-FLDQV-AMC.
Fig. 2.
N 1s XPS spectra: (a) ES polymer; (b) ES/buffer; (c) ESGA; (d) ESGA-FLDGV-AMC; (e) ESGA-FLDQV-AMC.
Table 2.
Deconvolution results of N 1s XPS spectra of the analyzed samples.
| Sample | Binding energy (eV) | Percentage of total area |
|---|---|---|
| ES | 400.16 | 52.50 |
| 401.42 | 47.50 | |
| EB | 400.08 | 53.73 |
| 399.06 | 46.27 | |
| ES/buffer | 398.77 | 18.10 |
| 399.99 | 66.26 | |
| 402.08 | 15.64 | |
| EB/buffer | 398.85 | 41.18 |
| 400.01 | 48.85 | |
| 402.55 | 9.98 | |
| ES-GA | 399.95 | 75.27 |
| 401.74 | 24.73 | |
| EB-GA | 398.56 | 21.81 |
| 399.80 | 74.35 | |
| 402.38 | 3.84 | |
| ES-GA-FLDGV | 399.60 | 17.17 |
| 400.84 | 78.08 | |
| 403.71 | 4.75 | |
| EB-GA-FLDGV | 398.51 | 13.49 |
| 399.82 | 86.51 | |
| ES-GA-FLDQV-AMC | 398.25 | 7.43 |
| 400.01 | 85.59 | |
| 402.38 | 6.98 | |
| EB-GA-FLDQV-AMC | 398.20 | 8.49 |
| 399.89 | 85.29 | |
| 402.30 | 6.22 |
The N 1s of the quinoid and benzenoid nitrogens in the EB are shifted toward higher binding energies (399.06 and 400.08 eV) and the amine nitrogens are in small excess (53.73%). The buffer protonates 9.98% of the imine nitrogens (402.56 eV); similar effect was observed after treatment with GA. Addition of the labeled peptide, FLDQV-AMC, to the EB-GA, results in 85.29% amine nitrogens and equivalent amounts of protonated and non-protonated imine nitrogen atoms [37–39].
3.2. UV/vis and fluorescence analysis
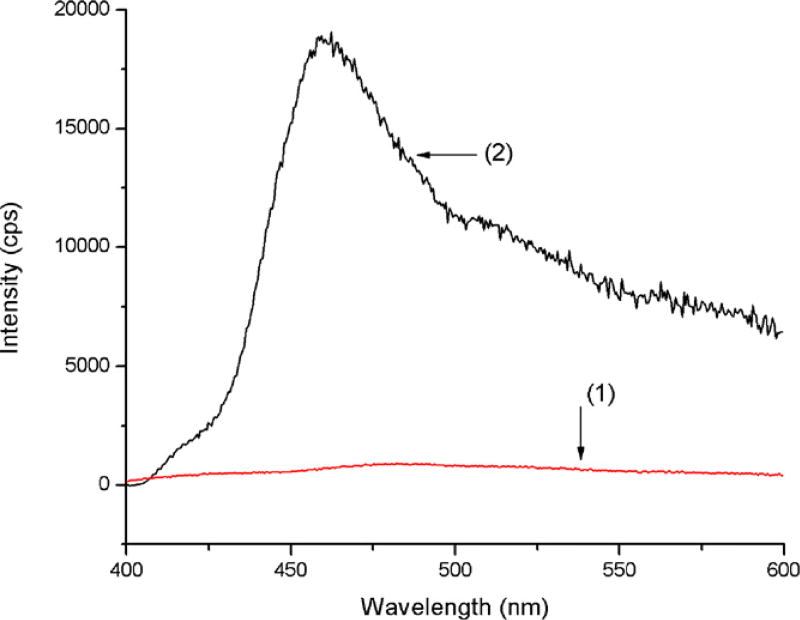
The selected pentapeptides have been attached to the polymer (ES and EB) both with and without linker. Since ES is practically insoluble, solid state fluorescence spectra were collected in order to prove the presence of the labeled peptide on the polymer (Fig. 3).
Fig. 3.
Solid state fluorescence spectra of (1) ES; (2) ES with fluorescently labeled peptide (EB-GA-FLDGV-AMC).
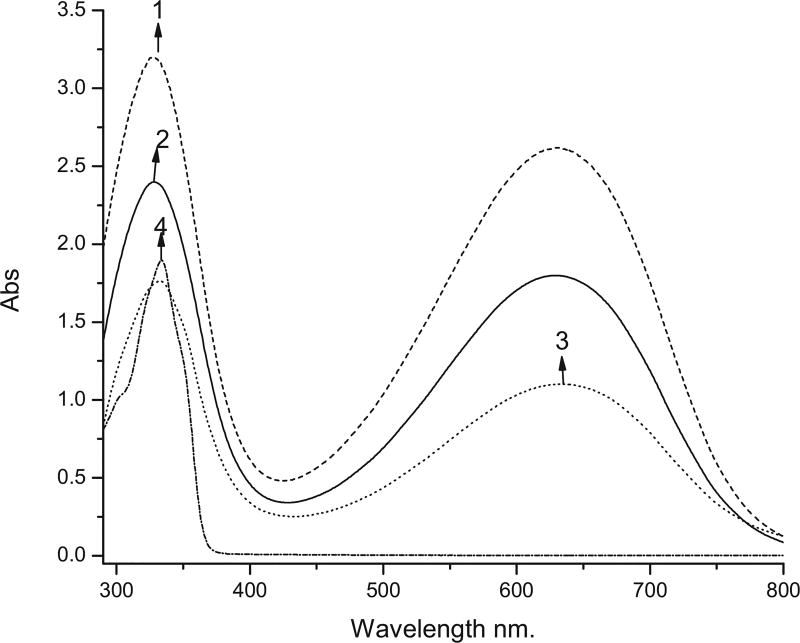
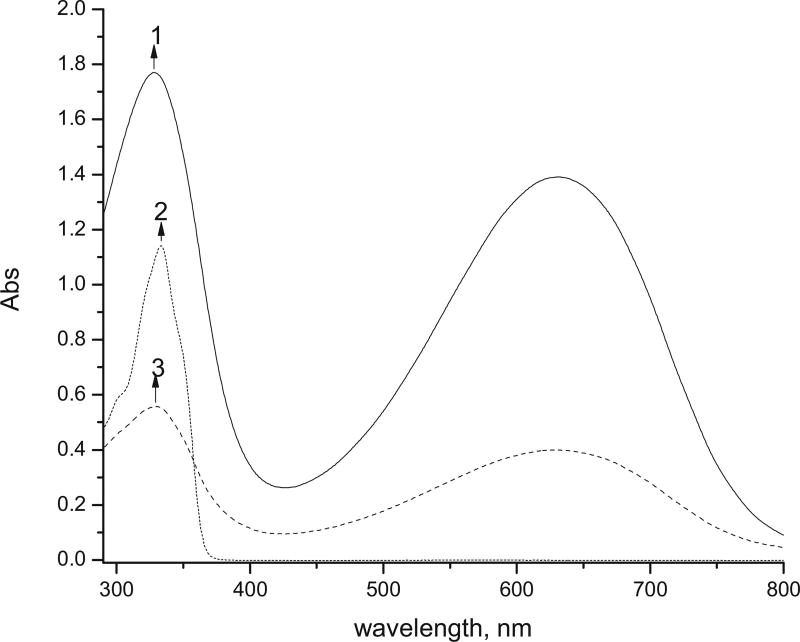
The absorption and emission spectra of EB, EB with attached glutaraldehyde and peptides have been recorded in NMP (Figs. 4–6). EB exhibits two absorption bands with maxima at 327 and 630 nm. Slight batochromic shifts of the two bands have been observed when a peptide has been attached to the polymer. Attachment of GA as well as of the labeled peptide both with and without GA leads to a significant decrease in the absorptivity (Figs. 4 and 5).
Fig. 4.
UV–vis spectra of (1) 0.05 mg/mL EB; (2) 0.05 mg/mL EB-GA; (3) 0.05 mg/mL EB-GA-FLDGV-AMC; (4) 0.05 mg/mL FLDGV-AMC.
Fig. 6.
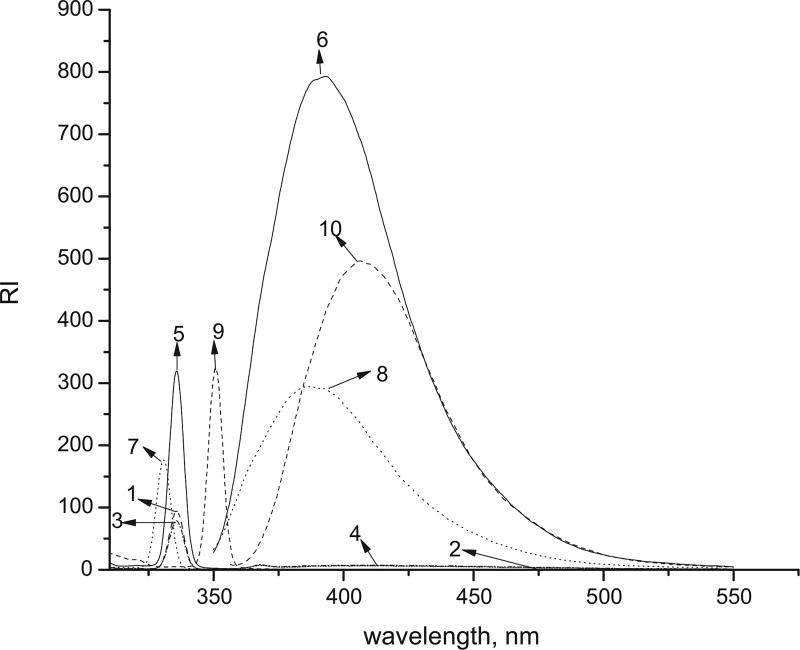
Excitation spectra of (1) 0.01 mg/mL EB; (3) 0.01 mg/mL EB-GA; (5) 0.000678 mg/mL FLDGV-AMC; (7) 0.0092 mg/mL EB-FLDGV-AMC; (9) 0.005 mg/mL EB-GA-FLDGV-AMC at 334 nm; emission spectra of (2) 0.01 mg/mL EB; (4) 0.01 mg/mL EB-GA; (6) 0.000678 mg/mL FLDGV-AMC; (8) 0.0092 mg/mL EB-FLDGV-AMC; (10) 0.005 mg/mL EB-GA-FLDGV-AMC (λex = 334 nm).
Fig. 5.
UV–vis spectra of (1) 0.05 mg/mL EB; (2) 0.05 mg/mL FLDGV-AMC; (3) 0.05 mg/mL EB-FLDGV-AMC.
The excitation and emission spectra of the investigated compounds are shown in Fig. 6. EB and EB-GA do not have measurable emission in the visible spectrum. FLDGV-AMC exhibits broad emission band with λem 393 nm. When the peptide is connected directly to the polymer (EB-GA), the fluorescence maximum is hypsochromically shifted (λem 385 nm), however, when the peptide is linked through the glutaraldehyde (EB-GA-FLDGV-AMC), the fluorescence is batochromically shifted (λem 406 nm) with respect to the fluorescence of the peptide itself in solution.
The amount of peptide attached to the matrix has been calculated from the emission intensities of the samples. The calibration was performed using standard solutions of the free peptides in a concentration range 1.0 × 10⁻⁴ to 5.0 × 10⁻⁵ mg/mL (FLDGV-AMC) and 1.0 × 10⁻⁴ to 1.8 × 10⁻³ mg/mL (FLDQV-AMC). The results are shown in Table 3. Similar amounts of FLDQV-AMC were connected to both EB and EB-GA while FLDQV-AMC attaches better to GA activated matrix.
Table 3.
Amount of peptide attached to the polymer matrix.
| Compounds | Peptides (%) |
|---|---|
| EB-FLDGV-AMC | 3.30 |
| EB-GA-FLDGV-AMC | 7.76 |
| EB-FLDQV-AMC | 5.44 |
| EB-GA-FLDQV-AMC | 5.12 |
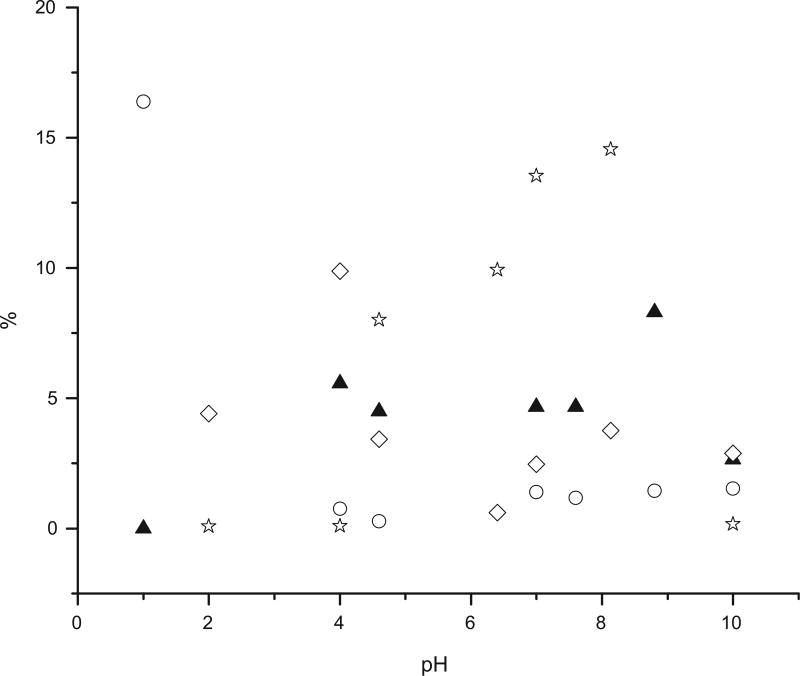
The ligand leaching was tested by immersing the samples in buffers with different pH. The emission spectra of the solutions were measured after 24 h and the results are summarized in Fig. 7.
Fig. 7.
Ratios of peptides released in solution vs the original amount of peptide attached to the matrix at different pH (λex = 334 nm, λem = 391.5 nm): EB-FLDGV-AMC (○), EB-FLDQV-AMC (▲), EB-GA-FLDGV-AMC (◊) and EB-GA-FLDQV-AMC (☆).
The presence of a linker does not contribute to the general stability of the compounds. Direct binding of a ligand to the carrier can offer more stability in certain instances. EB-FLDGV-AMC is stable in a broad pH region (pH 4–10) with less than 2% ligand detachment after 24 h. EB-GA-FLDQV-AMC is stable in acidic (pH <4) and basic (pH 10) media, however, 9–15% ligand release has been observed at pH 5–9.
3.3. Principal component analysis
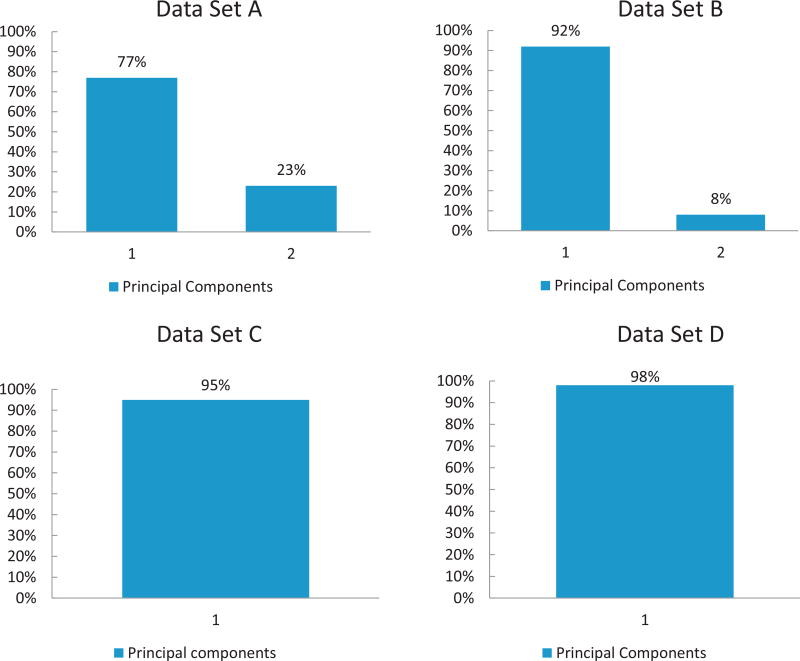
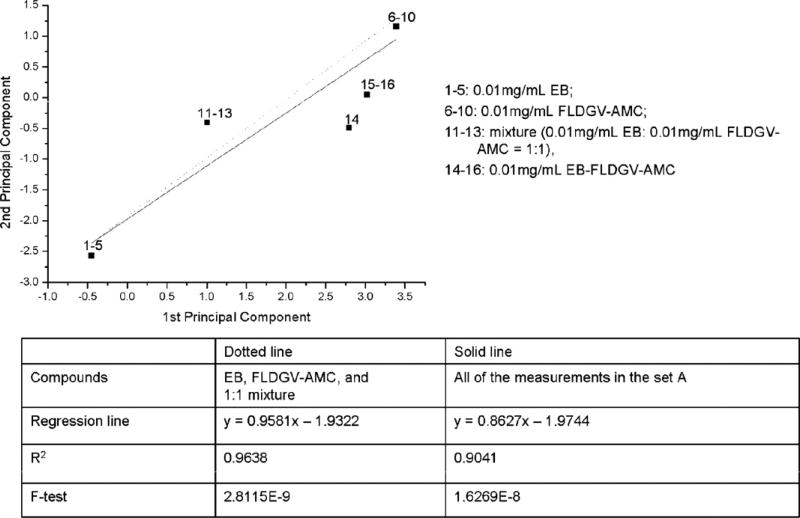
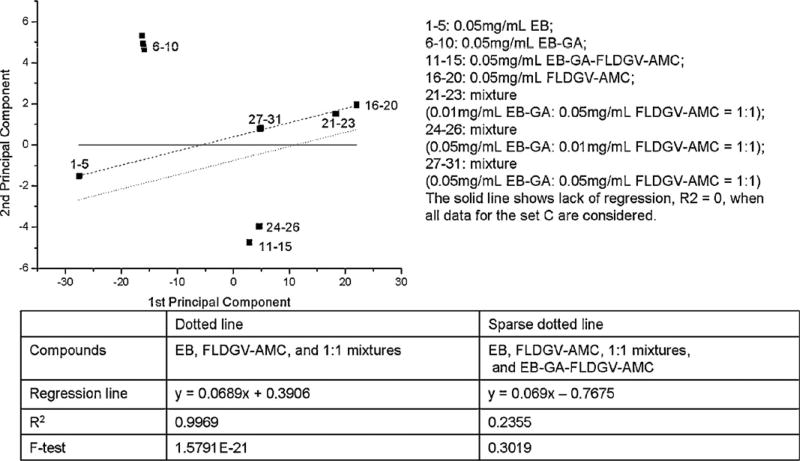
In accordance with our goals: first, to determine if there is a dominant direction for the variability of the data, and second, to determine if there is evidence of strong chemical bonds when compounds are mixed – we performed PCA analysis on the experimental data that was grouped in four specific absorption spectra measurements. The first set A of data contained 0.01 mg/mL EB, FLDGV-AMC, EB-FLDGV-AMC, and a 1:1 mixture of 0.01 mg/mL EB and 0.01 mg/mL FLDGV-AMC. The second set B contained 0.01 mg/mL EB, FLDQV-AMC, EB-FLDQV-AMC and a 1:1 mixture of 0.01 mg/mL EB and 0.01 mg/mL FLDQV-AMC. The third set C contained 0.05 mg/mL EB, EB-GA, EB-GA-FLDGV-AMC, FLDGV-AMC, and three 1:1 mixtures: 0.01 mg/mL EB-GA and 0.05 mg/mL FLDGV-AMC; 0.05 mg/mL EB-GA and 0.01 mg/mL FLDGV-AMC; 0.05 mg/mL EB-GA and 0.05 mg/mL FLDGV-AMC. The fourth set D contained 0.05 mg/mL EB, EB-GA, EB-GA-FLDQV-AMC, and FLDQV-AMC, and three 1:1 mixtures: 0.01 mg/mL EB-GA and 0.05 mg/mL FLDQV-AMC; 0.05 mg/mL EB-GA and 0.01 mg/mL FLDQV-AMC; 0.05 mg/mL EB-GA and 0.05 mg/mL FLDQV-AMC. The PCA was run on the 0 mean centered measurements. In all of the four cases the analysis revealed that the variability of the data is explained almost 100% by the first two principal components, Fig. 8.
Fig. 8.
Pareto plots showing the percentage of variation in the four data sets that is explained by the first or the combination of the first and the second principle components.
These findings allowed to reduce the data dimensionality significantly, and to achieve a compact representation by projecting data onto 2-dimensional spaces spanned by the respective first two principal components. Using this compact representation, the question about the presence or absence of strong chemical bonds could be framed as a statistical testing procedure about the goodness of fit of linear regression models to selected groups of data points. The results of the regression testing are shown in Figs. 9 and 10 as well as in Figs. S5 and S6 in the supplemental file.
Fig. 9.
Regression analysis for dataset A.
Fig. 10.
Regression analysis for dataset C.
Fig. 10 shows the relationship between several representative groups of compounds. It is obvious that there is no correlation when all data are included. Since it is assumed that the attachment of the peptides on the EB-GA matrix occurs via chemical reaction, we expected the new compound, containing 3–7% peptide, to have different electronic properties than a simple mixture of the starting materials and a correlation between EB-GA, the corresponding peptide and the mixtures in different ratios between them. Instead, an excellent correlation has been observed between EB, peptide, and the mixtures, while the attachment product forms well defined separate group.
In case of the direct binding of the peptide to EB (Fig. 9), the reaction product, EB-FLDGV-AMC, also shows different behavior than the starting materials and the mixtures. From the regression coefficients it is evident that the EB and peptide correlate much better with the mixtures and the reaction product in this case also exhibits different properties.
4. Conclusions
Fluorescently labeled petapeptides were incorporated in the ES and EB matrices with or without GA as a linker. The compounds have similar stability over a broad pH range. GA did not contribute to the overall stability or lower ligand leaching. Although GA is binding to the EB and ES, there is no direct evidence, that it actually facilitates the incorporation of the pentapeptides through their free amino end by formation of a Schiff base. Due to the similarity in their behavior, it is suggested that the binding occurs directly to the polymer matrix rather than via GA. The attachment of the peptide to EB and EB-GA results in species with different electronic properties than the mixtures of starting materials with the same composition indicating that a chemical bonding takes place.
Supplementary Material
Acknowledgments
The material is based upon work supported by the U.S. Department of Homeland Security under Grant Award Number 2007-ST-061-000003. The views and conclusions contained in this document are those of the authors and should not be interpreted as necessarily representing the official policies, either expressed or implied, of the U.S. Department of Homeland Security.
The authors thank the National Institutes of Health, the National Institute of General Medical Sciences, MBRS Program (GM 08111) and Research Center at Minority Institutions Grant (RCMI) RR 03020.
This publication was developed under an appointment to the DHS Summer Research Team Program for Minority Serving Institutions, administered by the Oak Ridge Institute for Science and Education (ORISE) through an interagency agreement between the U.S. Department of Energy (DOE) and U.S. Department of Homeland Security (DHS). ORISE is managed by Oak Ridge Associated Universities (ORAU) under DOE contract number DE-AC05-06OR23100. It has not been formally reviewed by DHS. The views and conclusions contained in this document are those of the authors and should not be interpreted as necessarily representing the official policies, either expressed or implied, of DHS, DOE, or ORAU/ORISE. DHS, DOE and ORAU/ORISE do not endorse any products or commercial services mentioned in this publication.
This work was supported in part by the MRSEC Program of the National Science Foundation under Award Number DMR-0819885, and also in part on work supported by Award No. KUS-C1-016-04, made by King Abdullah University of Science and Technology (KAUST).
Abbreviations
- GA
glutaraldehyde
- APS
ammonium persulfate
- NMP
1-methyl-2-pyrrolidinone
- ES
emeraldine salt
- EB
emeraldine base
- PANI
polyaniline
Footnotes
Appendix A. Supplementary data
Supplementary data associated with this article can be found, in the online version, at http://dx.doi.org/10.1016/j.synthmet.2012.04.012.
References
- 1.MacDiarmid AG, Epstein AJ. Faraday Discussions of the Chemical Society. 1989;88:317–332. [Google Scholar]
- 2.Asturias GE, MacDiarmid AG, McCall RP, Epstein AJ. Synthetic Metals. 1989;29:E157–E162. [Google Scholar]
- 3.Quillard S, Louarn G, Lefrant S, MacDiarmid AG. Physical Review B. 1994;50:496–508. doi: 10.1103/physrevb.50.12496. [DOI] [PubMed] [Google Scholar]
- 4.Fatuch JC, Soto-Oviedo MA, Avenllaneda CO, Franco MF, Romao W, DePaoli MA, Nougueira AF. Synthetic Metals. 2009;159:2348–2354. [Google Scholar]
- 5.Gok A, Sari B, Talu M. Synthetic Metals. 2004;142:41–48. [Google Scholar]
- 6.Li Y, Wang B, Feng W. Synthetic Metals. 2009;159:1597–1602. [Google Scholar]
- 7.Mav I, Zigon M. Synthetic Metals. 2001;119:145–146. [Google Scholar]
- 8.Gu Y, Chen C-C, Ruan Z-W. Synthetic Metals. 2009;159:2091–2096. [Google Scholar]
- 9.Aizawa M, Wang L, Shinohara H, Ikariyama Y. Journal of Biotechnology. 1990;14:301–310. doi: 10.1016/0168-1656(90)90114-q. [DOI] [PubMed] [Google Scholar]
- 10.Guo Z, Ruegger H, Kissner R, Ishikawa T, Willeke M, Walde P. Langmuir. 2009;25:11390–11405. doi: 10.1021/la901510m. [DOI] [PubMed] [Google Scholar]
- 11.Mateeva N, Niculescu H, Schlenoff J, Testardi L. Journal of Applied Physics. 1998;83:3111–3117. [Google Scholar]
- 12.Syed A, Dinesan M. Talanta. 1991;38:815–837. doi: 10.1016/0039-9140(91)80261-w. [DOI] [PubMed] [Google Scholar]
- 13.Mu S. Journal of Physical Chemistry B. 2008;112:6344–6349. doi: 10.1021/jp7117828. [DOI] [PubMed] [Google Scholar]
- 14.Tahir ZM, Alocilja AC, Grroms DL. Biosensors and Bioelectronics. 2005;20:1690–1695. doi: 10.1016/j.bios.2004.08.008. [DOI] [PubMed] [Google Scholar]
- 15.Viswanathan S, Radecka H, Radecki J. Biosensors and Bioelectronics. 2009;24:2772–2777. doi: 10.1016/j.bios.2009.01.044. [DOI] [PubMed] [Google Scholar]
- 16.Fernandes KF, Lima CS, Pinho H, Collins CH. Process Biochemistry. 2003;38:1379–1384. [Google Scholar]
- 17.Eftekhari A. Sensors and Actuators B. 2001;80:283–289. [Google Scholar]
- 18.Migneault I, Dartiguenave C, Brtrand MJ, Waldron KC. BioTechniques. 2004;37:790–802. doi: 10.2144/04375RV01. [DOI] [PubMed] [Google Scholar]
- 19.Monteiro OAC, Jr, Airoldi C. International Journal of Biological Macromolecules. 1999;26:119–128. doi: 10.1016/s0141-8130(99)00068-9. [DOI] [PubMed] [Google Scholar]
- 20.Kudreeva NR, Perminov PA, Vladimirov LV, Novikov VV, Mikhailov SN. Russian Journal of Bioorganic Chemistry. 2009;359:360–369. [Google Scholar]
- 21.Sai VVR, Mahajan S, Contractor AQ, Mukherji S. Analytical Chemistry. 2006;78:8368–8373. doi: 10.1021/ac060120a. [DOI] [PubMed] [Google Scholar]
- 22.de Melo JV, Bello ME, de AzeveÃdo WM, de Souza JM, Diniz FB. Electrochimica Acta. 1999;44:2405–2412. [Google Scholar]
- 23.Purcena LLA, Caramori SS, Mitidieri S, Fernandes KF. Materials Science and Engineering C. 2009;29:1077–1081. [Google Scholar]
- 24.Alloway BJ, Ayres DC, editors. Chemical Principles of Environmental Pollution. 2. Blackie Academic and Professional; Glasgow: 1997. [Google Scholar]
- 25.Brouwer A, Longnecker MP, Birnbaum LS, Cogliano J, Kostyniak P, Moore J, Schantz S, Winneke G. Environmental Health Perspectives. 1999;107:639–649. doi: 10.1289/ehp.99107s4639. [DOI] [PMC free article] [PubMed] [Google Scholar]
- 26.Bernard A, Hermans C, Broeckaert F, De Poorter G, De Cock A, Houins G. Nature. 1999;401:231–232. doi: 10.1038/45717. [DOI] [PubMed] [Google Scholar]
- 27.Verbeke W, Viaene J, Guiot O. Journal of Health Communication. 1999;4:345–357. doi: 10.1080/108107399126869. [DOI] [PubMed] [Google Scholar]
- 28.Behnisch PA, Hosoe K, Sakai S. Environment International. 2001;27:495–519. doi: 10.1016/s0160-4120(01)00029-0. [DOI] [PubMed] [Google Scholar]
- 29.Countryman S, Kelly K. LCGC North America (Suppl.) 2007:27. [Google Scholar]
- 30.Hoh E, Lehotay SJ, Mastovska K, Huwe JK. Journal of Chromatography A. 2008;1201:69–77. doi: 10.1016/j.chroma.2008.05.089. [DOI] [PubMed] [Google Scholar]
- 31.van Leeuwen SPJ, de Boer J. Journal of Chromatography A. 2008;1186:161–182. doi: 10.1016/j.chroma.2008.01.044. [DOI] [PubMed] [Google Scholar]
- 32.Malavia J, Abalos MF, Santos FJ, Abad E, Rivera J, Galceran TM. Journal of Agricultural and Food Chemistry. 2007;55:10531–10539. doi: 10.1021/jf0719858. [DOI] [PubMed] [Google Scholar]
- 33.Nakamura C, Inuyama Y, Goto H, Obataya I, Kaneko N, Nakamura N, Santo N, Miyake J. Analytical Chemistry. 2005;77:7750–7757. doi: 10.1021/ac051151t. [DOI] [PubMed] [Google Scholar]
- 34.Inuyama Y, Nakamura C, Oka T, Yoneda Y, Obataya I, Santo N, Miyake J. Biosensors and Bioelectronics. 2007;22:2093–2099. doi: 10.1016/j.bios.2006.09.016. [DOI] [PubMed] [Google Scholar]
- 35.Zeng X-R, Ko T-M. Polymer. 1998;39:1187–1195. [Google Scholar]
- 36.Rajagopalan R, Iroh JO. Applied Surface Science. 2003;218:58–69. [Google Scholar]
- 37.Tan KL, Tan BTG, Kang ET, Neoh KG. Physical Review B. 1989;39:8070–8073. doi: 10.1103/physrevb.39.8070. [DOI] [PubMed] [Google Scholar]
- 38.Yue J, Epstein AJ. Macromolecules. 1991;24:4441–4445. [Google Scholar]
- 39.Naidu VK, Sairam M, Raju KVSN, Aminahhavi TM. Journal of Membrane Science. 2005;260:142–155. [Google Scholar]
- 40.Sjögren B, Salaneck WR, Stafström S. Journal of Chemical Physics. 1992;97:137–145. [Google Scholar]
- 41.Thanasoulias NC, Parisis NA, Evmiridis NP. Forensic Science International. 2003;138:75–84. doi: 10.1016/j.forsciint.2003.08.014. [DOI] [PubMed] [Google Scholar]
- 42.Şahin S, Demir C, Güçer Ş. Dyes and Pigments. 2007;73:368–376. [Google Scholar]
- 43.Meloun M, Čapek J, Syrový T. Talanta. 2005;66:547–561. doi: 10.1016/j.talanta.2004.11.033. [DOI] [PubMed] [Google Scholar]
Associated Data
This section collects any data citations, data availability statements, or supplementary materials included in this article.


