Significance
Type I collagen, a major component of bone, skin, and other connective tissues, is synthesized in the endoplasmic reticulum (ER) and passes through the secretory pathway. Rerouting of its procollagen precursor to a degradative pathway is crucial for reducing intracellular buildup in pathologies caused by defects in procollagen folding and trafficking. Here, we identify an autophagy pathway initiated at ER exit sites (ERESs). Procollagen proteins following this pathway accumulate at ERESs modified with ubiquitin, LC3, p62, and other autophagy machinery. Modified ERESs carrying procollagen are then engulfed by lysosomes through a microautophagy-like mechanism, not involving conventional, double-membrane autophagosomes. Procollagen homeostasis thus involves a noncanonical mode of autophagy initiated at ERESs, which might also be important in degradation of other secretory proteins.
Keywords: procollagen, autophagy, ERES, microautophagy, lysosome
Abstract
Type I collagen is the main component of bone matrix and other connective tissues. Rerouting of its procollagen precursor to a degradative pathway is crucial for osteoblast survival in pathologies involving excessive intracellular buildup of procollagen that is improperly folded and/or trafficked. What cellular mechanisms underlie this rerouting remains unclear. To study these mechanisms, we employed live-cell imaging and correlative light and electron microscopy (CLEM) to examine procollagen trafficking both in wild-type mouse osteoblasts and osteoblasts expressing a bone pathology-causing mutant procollagen. We found that although most procollagen molecules successfully trafficked through the secretory pathway in these cells, a subpopulation did not. The latter molecules appeared in numerous dispersed puncta colocalizing with COPII subunits, autophagy markers and ubiquitin machinery, with more puncta seen in mutant procollagen-expressing cells. Blocking endoplasmic reticulum exit site (ERES) formation suppressed the number of these puncta, suggesting they formed after procollagen entry into ERESs. The punctate structures containing procollagen, COPII, and autophagic markers did not move toward the Golgi but instead were relatively immobile. They appeared to be quickly engulfed by nearby lysosomes through a bafilomycin-insensitive pathway. CLEM and fluorescence recovery after photobleaching experiments suggested engulfment occurred through a noncanonical form of autophagy resembling microautophagy of ERESs. Overall, our findings reveal that a subset of procollagen molecules is directed toward lysosomal degradation through an autophagic pathway originating at ERESs, providing a mechanism to remove excess procollagen from cells.
Type I collagen is by far the most abundant protein in all mammals and the main structural protein of extracellular matrix in bone, skin, and many other tissues. Its procollagen precursor is a heterotrimer of two proα1(I) and one proα2(I) chains, each of which contains over 1,300 aa. Procollagen is assembled from the three chains and folded in the endoplasmic reticulum (ER), trafficked through the Golgi (like most secretory proteins), secreted, and then converted into a 300-nm-long triple helix of mature collagen by cleavage of globular C- and N-propeptides. Osteoblasts produce and secrete massive amounts of type I procollagen, enough to fill an entire cell volume in just a day (1, 2). Procollagen is notoriously difficult to fold, however, resulting in significant misfolding. To address this misfolding challenge, procollagen-expressing cells degrade up to 15% of the newly synthesized procollagen even under normal conditions (3). When the rate of misfolding exceeds the capacity of cells to degrade or secrete misfolded molecules, massive intracellular accumulation of procollagen occurs (4). This is thought to lead to abnormal osteoblast maturation and function and likely contributes to severe bone pathologies such as osteogenesis imperfecta (5).
Procollagen-expressing cells like osteoblasts are known to destroy excess intracellular procollagen through autophagy (6), a cellular recycling/disposal pathway that delivers recyclable cargo to lysosomes for degradation (7, 8). Mutations that disrupt procollagen folding result in increased autophagy of procollagen, suggesting misfolded forms of procollagen can trigger entry into this pathway (4). What is unclear is where in the cell procollagen molecules are recognized and how they are captured for autophagic degradation.
Like other secretory cargo, procollagen exits the ER at ER exit sites (ERESs) and moves toward the Golgi. ERESs arise through the activities of COPII coat proteins (i.e., Sec23/Sec24 dimers and Sec13/Sec31 dimers) (9, 10). Interestingly, mutations in COPII coat proteins cause disease phenotypes that are more consistent with pathology caused by procollagen misfolding than with general protein trafficking defects (11–15). One such example is Sec24D, mutations of which have been shown to cause a severe form of osteogenesis imperfecta (14, 16, 17), a disorder typically associated with excessive type I procollagen misfolding (18, 19). While the disease-causing COPII mutants are thought to perturb entry of procollagen into the secretory pathway (11, 12, 14, 15), it is possible they also interfere with regulating intracellular degradation of misfolded molecules. Indeed, prior work has reported that remodeling of ERESs through the activity of ubiquitin ligases and autophagy machinery can initiate a membrane supply pathway for autophagosome biogenesis (20). This raises the possibility that COPII mutations might disrupt autophagic degradation of procollagen.
To investigate how misfolded procollagen is recognized and captured for autophagic degradation, we employed live-cell confocal microscopy and correlative light and electron microscopy (CLEM) to study procollagen trafficking in normal osteoblasts and osteoblasts expressing bone pathology-causing mutant molecules. We discovered that a subset of folded/misfolded procollagen molecules were diverted to lysosomes from ERESs. These ERESs were decorated with ubiquitin, LC3, and other autophagy effectors before being engulfed by nearby lysosomes through a noncanonical, autophagic process resembling microautophagy. Our findings identify a pathway for regulating procollagen homeostasis, which is initiated at ERESs and involves a noncanonical mode of autophagic degradation.
Results
Following Procollagen Trafficking in Osteoblasts.
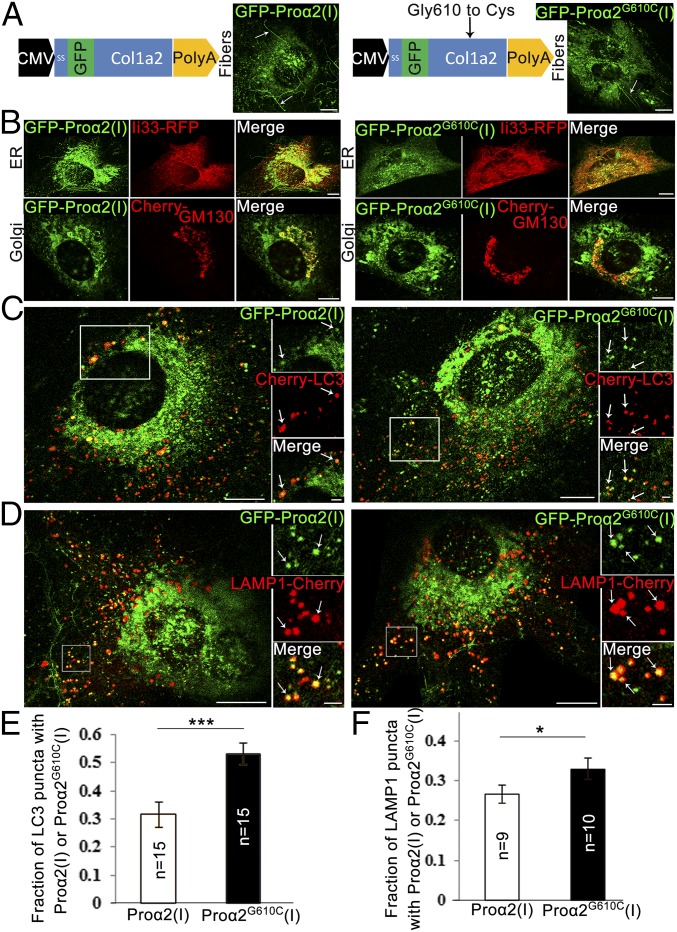
To study the intracellular pathways followed by procollagen, we made fluorescent procollagen probes in which the proα2(I) chain of mouse procollagen type I was labeled with a fluorescent protein (FP) at its N terminus [i.e., FP-proα2(I)], similar to the probes described in ref. 21. In addition to this wild-type construct, we created a construct to mimic a bone pathology-causing Gly610-to-Cys (G610C) substitution in the triple helical region of proα2(I), that is, FP-proα2G610C(I). The constructs were then individually expressed in an MC3T3 osteoblast cell line (22).
The G610C substitution was previously used to engineer a mouse model of osteogenesis imperfecta (23). A study of osteoblasts from these mice in vivo and in culture revealed that the G610C substitution increased procollagen misfolding, intracellular accumulation, and autophagy without perturbing cell function until several weeks of culturing (4). Most mutant molecules were folded, secreted, and incorporated into extracellular collagen fibers; only a small fraction of them was misfolded. The increased misfolding caused accumulation of procollagen aggregates in the ER over time, but the resulting severe ER dilation and osteoblast malfunction were observed only after several weeks (4). In the present study we examined the cells within 18–24 h after transfection with FP-proα2G610C(I) [vs. FP-proα2(I)], before a significant detrimental effect of the transfection on osteoblast function.
Imaging of cells expressing either FP-proα2(I) or FP-proα2G610C(I) revealed similar distributions of these markers, both in intracellular pools and in extracellular collagen fibers (Fig. 1A). We confirmed coassembly of these chains with proα1(I) chains into procollagen molecules by observing colocalization of FP-proα2(I) or FP-proα2G610C(I) with a similarly fluorescently labeled TagBFP2-proα1(I) chain as well as with an antibody that recognizes properly folded procollagen (SI Appendix, Fig. S1A).
Fig. 1.
GFP-proα2(I)–tagged procollagen progresses through secretory and autophagic degradation pathways. (A) Schematic representation of GFP-proα2(I) (Left) and GFP-proα2G610C(I) (Right) constructs. Images show integration of procollagen molecules containing these chains into extracellular fibers (arrows) produced by transfected MC3T3 cells. (B) MC3T3 cells transfected with GFP-proα2(I) (Left) and GFP-proα2G610C(I) (Right) as well as markers of ER (Ii33-RFP) and cis-Golgi (Cherry-GM130) to visualize progression through the secretory pathway. (C and D) MC3T3 cells transfected with GFP-proα2(I) (Left) and GFP-proα2G610C(I) (Right) chains as well as markers of autophagic membrane (Cherry-LC3 in C) or lysosomal membrane (LAMP1-Cherry in D). Arrows point to selected puncta containing procollagen and LC3 or LAMP1. (E and F) Fractions of LC3 puncta (E) and LAMP1 puncta (F) containing procollagen (calculated as shown in SI Appendix, Fig. S6). Graphs display mean values ± SEM; *P < 0.05, ***P < 0.001. All images in A–D are confocal single slices. [Scale bars: 10 µm (whole cell) and 2 µm (zoom).] Procollagen colocalization with LC3 or LAMP1 near dense ER regions (C) was less obvious than in distal regions (D). We therefore used a conservative counting algorithm, which always undercounted rather than overcounted colocalized puncta (SI Appendix, Fig. S6).
Significant pools of FP-proα2(I) or FP-proα2G610C(I) were found in the ER and Golgi, based on their colocalization with the ER marker (Ii33-RFP) and Golgi marker (Cherry-GM130) (Fig. 1B). The extent of colocalization was similar to that found for endogenous procollagen detected with antibodies in primary osteoblasts, with no changes in ER or Golgi morphologies seen upon expression of the procollagen probes (SI Appendix, Fig. S1B). In cells expressing FP-proα2(I) or FP-proα2G610C(I), a continuous flux of procollagen moving from ER to Golgi was evident from experiments in which we selectively photobleached the Golgi pool of these markers (Movie S1).
The above results indicated that the majority of FP-proα2(I) and FP-proα2G610C(I) molecules in our MC3T3 osteoblasts were successfully assembled into heterotrimers, exported to the Golgi, and later released as mature collagen fibers. It remained possible, however, that subpopulations of procollagen molecules in these cells, in particular misfolded forms, were being routed differently.
Rerouting of Some Procollagen Molecules to a Degradative Pathway.
To investigate whether any intracellular pools of procollagen were diverted from the above secretory trafficking route toward degradation, we coexpressed markers for autophagosomes (i.e., Cherry-LC3) or lysosomes (LAMP1-Cherry) in MC3T3 cells expressing FP-proα2(I) or FP-proα2G610C(I). Notably, we observed a small fraction of either FP-proα2(I) or FP-proα2G610C(I) present in dispersed puncta containing LC3/LAMP1 (Fig. 1 C and D). At steady state, the percentage of FP-proα2(I) and FP-proα2G610C(I) proteins localized to LC3/LAMP1 puncta was ∼3–5% of total FP-labeled procollagen in these cells.
Further analyses of the above images revealed that the percentage of all Cherry-LC3 puncta that contained FP-proα2(I) in cells coexpressing these constructs was ∼30%, whereas Cherry-LC3 puncta that contained FP-proα2G610C(I) in cells coexpressing these constructs was ∼55% (Fig. 1E). A similar increase was also observed in transfected primary osteoblasts (SI Appendix, Fig. S2). We also found that in cells cotransfected with FP-proα2(I) and LAMP1-Cherry, ∼28% of LAMP1-positive lysosomes contained the procollagen probe, with the percentage increasing to 33% in FP-proα2G610C(I)–expressing cells (Fig. 1F). All these observations suggested that the mutation increased the diversion of procollagen toward autophagic degradation in lysosomes.
Characteristics of the Degradative Pathway Followed by Procollagen.
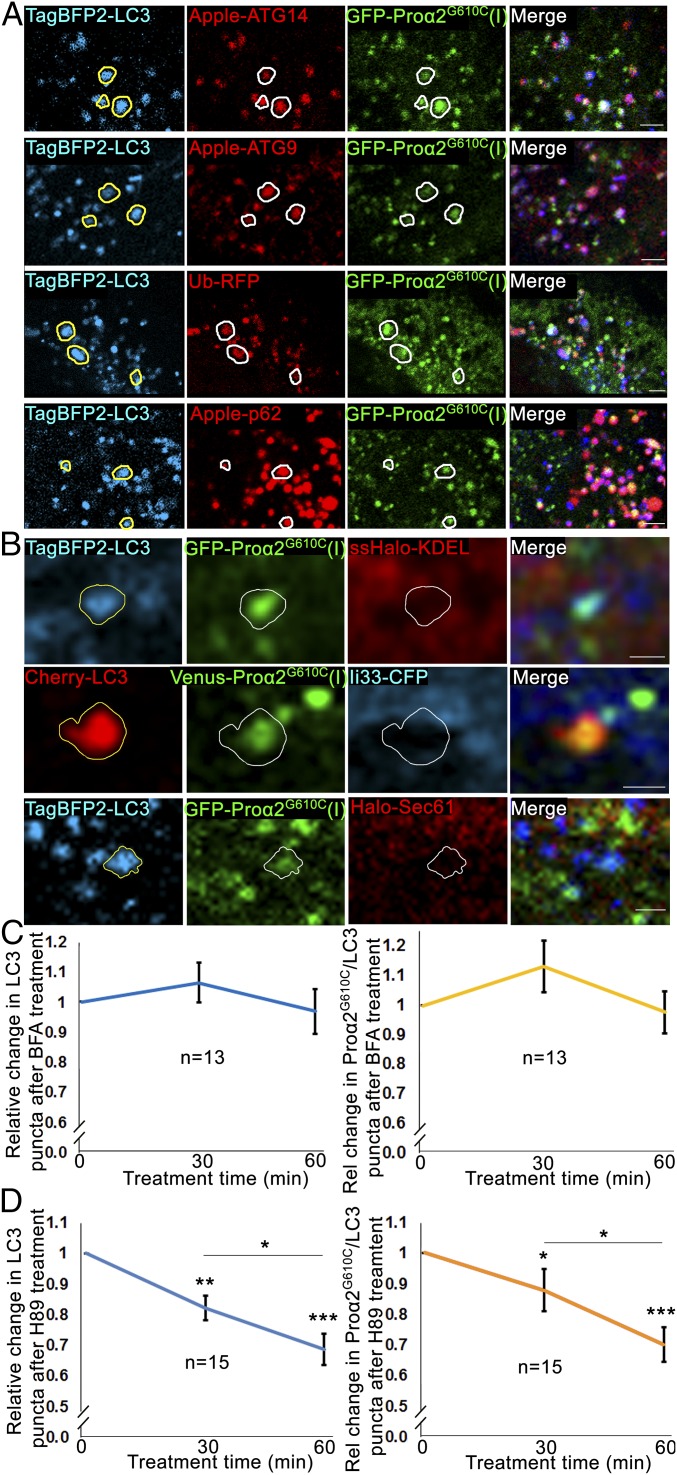
To clarify the pathway followed by procollagen toward autophagosomes and lysosomes, we employed FP-proα2G610C(I) as our procollagen marker, since more of it colocalized with autophagosomes/lysosomes compared with FP-proα2(I). We began by asking whether LC3-labeled puncta positive for FP- proα2G610C(l) colocalized with other autophagy markers. The markers tested included Atg14, a member of the PI3 kinase complex I required for recruitment of LC3 lipidation machinery (24); the transmembrane protein Atg9, thought to provide a membrane source for autophagosomes (25, 26); ubiquitin, which marks substrates for autophagy (27); and an adaptor protein p62, which contains a ubiquitin binding domain and an LC3-interacting region (28). Notably, we observed each of these autophagy markers colocalizing with the procollagen-containing LC3-puncta (Fig. 2A), albeit to differing extents (discussed below). This confirmed that the puncta containing FP-proα2G610C(I) and LC3 were authentic autophagic structures.
Fig. 2.
Procollagen autophagy is initiated at early steps in the secretory pathway. (A) Confocal single-slice images of colocalized puncta in MC3T3 cells transfected with GFP-proα2G610C(I), TagBFP2-LC3 as well as autophagy markers Apple-ATG14, Apple-ATG9, ubiquitin-RFP (Ub-RFP), or Apple-p62. (Scale bars: 2 µm.) (B) Autophagic structures containing FP-proα2G610C(I) and FP-LC3 imaged in MC3T3 cells also transfected with a marker of ER lumen (ssHalo-KDEL) or ER membrane (Ii33-CFP or ssHalo-Sec61). Top two rows are confocal single-slice images; the Bottom row is Airyscan single-slice images. (Scale bars: 1 µm.) In A and B, yellow outlines of LC3-positive puncta are projected in white onto the other channels; all individual blue channels are displayed in cyan for better visualization. (C and D) MC3T3 cells transfected with GFP-proα2G610C(I) and TagBFP2-LC3 were imaged before and after 60-min treatment with 5 µg/mL BFA or 50 µM H89. Averaged relative changes in the number of total LC3 puncta and procollagen/LC3 puncta during the BFA (C) or H89 (D) treatment are shown. Sample images are displayed in SI Appendix, Fig. S4. The SE was calculated using repeated-measures ANOVA for the raw data; *P < 0.05, **P < 0.01, ***P < 0.001.
We next investigated the intracellular site from which procollagen was targeted toward these autophagic structures. An obvious possibility was the ER, since prior work has shown that whole ER cisternae or their fragments can be engulfed by phagophore membranes and delivered to lysosomes in a process called ER-phagy (29, 30). ER-phagy has also been linked to activation of the unfolded protein response (UPR), an ER stress pathway for unfolded/misfolded proteins (29, 31). To test whether ER-phagy was responsible for the autophagic fate of procollagen seen in our cells, we coexpressed FP-proα2G610C(I) with an ER lumen marker, ssFP-KDEL, or with ER membrane markers, Ii33-FP or FP-Sec61 (Fig. 2B). ER-phagy would result in colocalization of misfolded procollagen with ER lumen and membrane markers in autophagosomes. We observed no ER proteins in LC3-positive puncta containing FP-proα2G610C(I). This argued against the ER-phagy hypothesis.
We then examined whether proα2G610C(I) was diverted into the autophagy pathway after entering the Golgi apparatus. To address this, we utilized the drug brefeldin A (BFA), known to disassemble the Golgi apparatus and block further protein transport through the secretory pathway (32–34). As expected, BFA treatment blocked procollagen secretion (SI Appendix, Fig. S3D). However, it reduced neither the total number of autophagic structures nor the number of autophagic structures containing procollagen (Fig. 2C and SI Appendix, Fig. S3B). Moreover, there was no effect of BFA treatment on procollagen autophagy in biochemical analyses of primary osteoblasts (SI Appendix, Fig. S3C). Therefore, proα2G610C(I) did not enter the autophagic pathway at the level of the Golgi or further downstream in the secretory pathway.
Recent work has revealed that COPII-coated structures such as ERESs can act as players in the formation of autophagic membranes (35–39). We therefore examined whether ERESs have any role in the formation of autophagic puncta positive for FP-proα2G610C(l). As a simple way to explore this, we treated cells with the small-molecule PKA inhibitor H89, which prevents ERES formation by disrupting COPII coat assembly (40, 41). Within 1 h of H89 treatment, procollagen secretion was blocked (SI Appendix, Fig. S3D). Significantly, the overall number of both LC3-positive autophagic structures and that of FP-LC3–positive autophagic structures that contained FP-proα2G610C(I) decreased (Fig. 2D and SI Appendix, Fig. S3A). Also, biochemical analyses in primary osteoblasts showed decreased autophagic flux after H89 treatment (SI Appendix, Fig. S3C). This suggested that diversion of procollagen to an autophagic pathway possibly occurs at or downstream of ERESs.
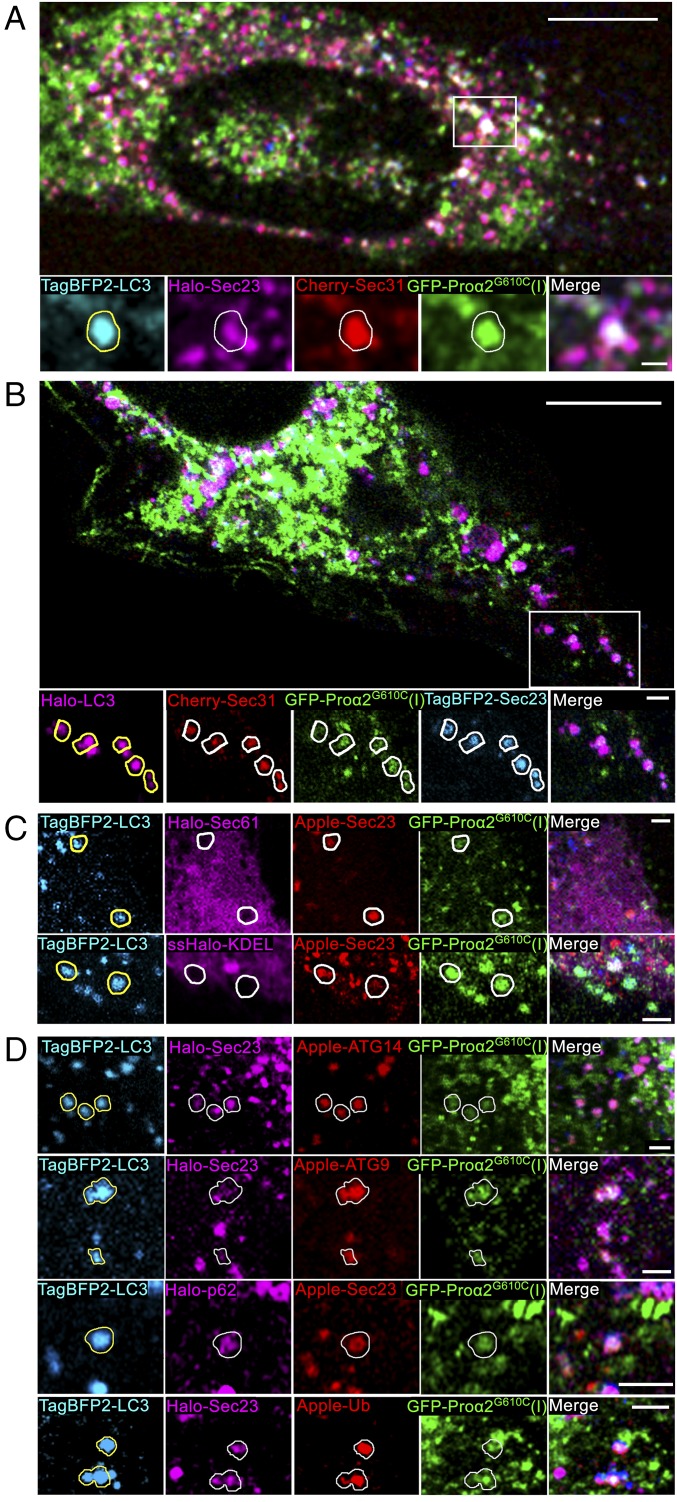
To further test this idea, we cotransfected cells with FP-proα2G610C(I), FP-LC3, and the COPII coat proteins FP-Sec23 and FP-Sec31 to mark ERESs. Notably, ∼7% of all FP-Sec23/FP-Sec31/FP-proα2G610C(I) puncta also colocalized with FP-LC3 (Fig. 3 A and B and SI Appendix, Fig. S4). The puncta containing FP-Sec23, FP-proα2G610C(I), and FP-LC3 lacked ER-resident proteins ssFP-KDEL and FP-Sec61 (Fig. 3C), supporting the view that they represented either ERESs (which are COPII-positive and exclude ER resident proteins) or structures derived from ERESs.
Fig. 3.
Misfolded procollagen enters autophagic structures at ERES. (A) Procollagen autophagic structures marked with GFP-proα2G610C(I) and TagBFP2-LC3 were imaged in MC3T3 cells also transfected with FP-tagged components of COPII coat Cherry-Sec31 and Halo-Sec23. Outline of an LC3-positive punctum is projected onto the other channels in zoomed confocal single-slice images to visualize colocalization. Colocalization was confirmed by analysis of the full 3D z-stack (SI Appendix, Fig. S4). (B) Similar imaging of TagBFP2-Sec23 and Cherry-Sec31 colocalization with procollagen autophagic structures positive for GFP-proα2G610C(I) and Halo-LC3. LC3 puncta outlines show only the structures in which the colocalization was confirmed by 3D z-stack analysis (SI Appendix, Fig. S4). The number of FP-Sec23/FP-proα2(I)G610C/FP-LC3 colocalized puncta represented 9.8 ± 1.4% of total LC3 puncta (n = 21 cells) and 4.7 ± 0.7% of total Sec23 puncta (n = 20 cells). (C) None of the puncta marked with GFP-proα2(I)G610C, TagBFP2-LC3, and FP-Sec23 (arrows) contained either Halo-Sec61 (ER membrane) or ssHalo-KDEL (ER lumen) markers. (D) Puncta marked with FP-Sec23, GFP-proα2G610C(I), and TagBFP2-LC3 also contained autophagic markers Apple-ATG14, Apple-ATG9, Halo-p62, or Apple-Ub. Images of C, Bottom are Airyscan single slices; all other images are confocal single slices. In all images, individual blue channels are displayed in cyan for better visualization. [Scale bars: 10 µm (whole cell) and 2 µm (zoom).]
Composition and Dynamics of Puncta Containing Procollagen, Sec23, and LC3.
We investigated what other autophagy-associated molecules were found in puncta containing FP-proα2G610C(I), Sec23/31, and FP-LC3. We found that FP-Atg14, FP-Atg9, FP-p62, and FP-ubiquitin all could label these puncta (Fig. 3D), but they did so to different extents. Ubiquitin and p62 markers were present on most of them. By contrast, Atg14 was present on only ∼50%, while Atg9’s association was variable. Overexpression of Atg14 was sufficient to boost the number of FP-LC3/FP-proα2G610C(I) puncta containing FP-Sec23 from ∼15% to ∼25% (P < 0.05), suggesting its potential function in their formation.
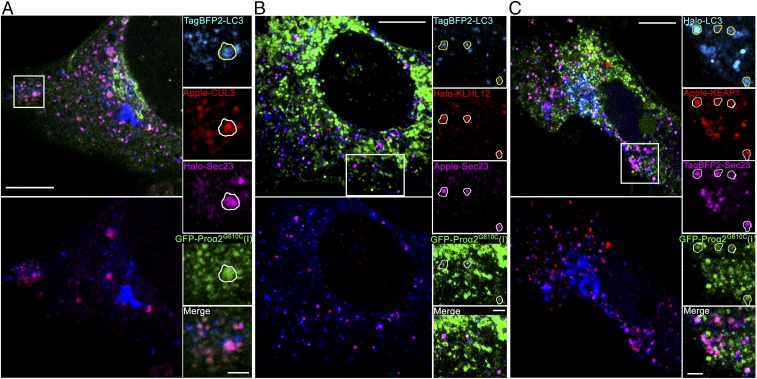
As all puncta containing FP-proα2G610C(I), Sec23/31, and FP-LC3 were also labeled with ubiquitin, we wondered whether ubiquitination machinery was present on them. Supporting this possibility, the E3 ubiquitin ligase CUL3 and its adaptor proteins, KEAP1 and KLHL12, were all present on the puncta (Fig. 4). This suggested that ubiquitination of one or more proteins in the puncta was necessary for them to become enriched in autophagic markers.
Fig. 4.
Procollagen/Sec23/LC3 puncta colocalize with ubiquitination machinery. (A) Airyscan slice showing TagBFP2-LC3 and GFP-proα2(I)G610C puncta colocalization with Halo-Sec23 and Apple-CUL3, an E3 ubiquitin ligase. All large FP-CUL3 puncta were confirmed to be colocalized with FP-LC3 (Bottom Left image of the whole cell) and procollagen (zoomed panels, Right), and some also contained FP-Sec23 (zoomed panels, outline). (B) Airyscan slice showing colocalization of TagBFP2-LC3 puncta with Halo-KLHL12 adaptor for CUL3 ubiquitin ligase (Bottom Left) and with GFP-proα2G610C(I) and Apple-Sec23 (zoomed panels, outlines). All Halo-KLHL12 puncta colocalized with GFP-proα2G610C(I) were confirmed to be also colocalized with TagBFP2-LC3 (top images of the whole cell). (C) Airyscan slice showing colocalization of Halo-LC3 puncta with Apple-Keap1 adaptor for CUL3 ubiquitin ligase (Bottom Left) and with GFP-proα2G610C(I) and TagBFP2-Sec23 (zoomed panels, outlines). In all zoomed panels, yellow outlines of LC3-positive puncta are projected in white onto other channels. Individual blue channels are displayed in cyan. [Scale bars: 10 µm (whole cell) and 2 µm (zoom).]
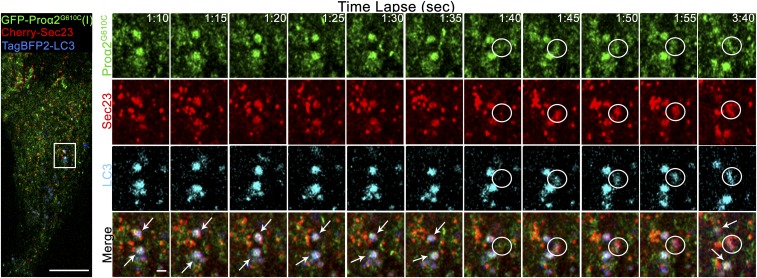
We next performed enhanced-resolution, high-speed time-lapse imaging to examine how puncta containing FP-proα2G610C(I), FP-Sec23/31, and FP-LC3 arose. We first followed FP-proα2–positive, FP-LC3–negative puncta. They arose at sites marked by FP-Sec23 and then rapidly departed (after losing FP-Sec23 labeling) as they moved toward the Golgi (SI Appendix, Fig. S5 and Movies S2 and S3). As prior work has shown that secretory transport intermediates lose the COPII coat once they bud off from the ER to translocate to the Golgi (42), the above results suggested the FP-proα2–positive, FP-LC3–negative puncta that moved away from Sec23 structures were secretory transport intermediates. Puncta containing FP-proα2G610C(I), FP-Sec23, and FP-LC3, however, behaved differently. Time-lapse imaging revealed they appeared abruptly (presumably at ERESs) and then remained relatively stationary, persisting for at least several minutes without losing Sec23 labeling (Fig. 5 and Movie S4). This suggested the puncta containing FP-proα2G610C(I), FP-Sec23/31, and FP-LC3 were modified ERESs rather than ER-to-Golgi transport intermediates captured by autophagosomes en route to the Golgi.
Fig. 5.
Procollagen/LC3 structures rapidly form at COPII puncta, retain COPII coat, and remain relatively stationary. MC3T3 cells transfected with Cherry-Sec23, GFP-proα2G610C(I), and TagBFP2-LC3 (Left) were imaged by Airyscan (5 s) time-lapse microscopy (Movie S4). Single-slice, time-lapse images (Right) show preexisting long-lived proα2G610C(I)/LC3/Sec23-positive autophagic structures (white arrows) and formation of a new proα2G610C(I), LC3, and Sec23-positive autophagic structure (white circle). Blue channels are displayed in cyan for better visualization. [Scale bars: 10 µm (whole cell) and 1 µm (zoom).]
Lysosomes’ Role in ERES Autophagy.
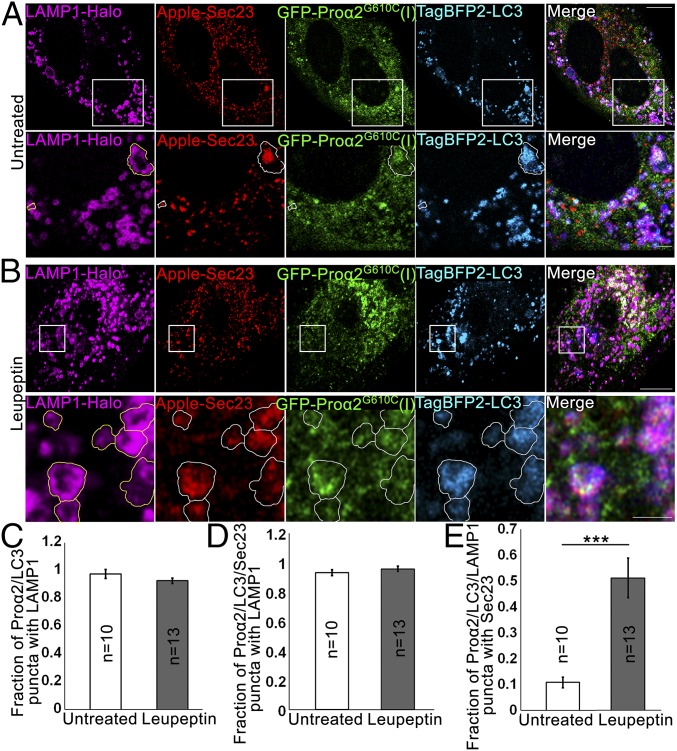
Lysosomes are the end point of autophagy, so we investigated their behavior relative to that of puncta containing FP-proα2G610C(I), Sec23/31, and FP-LC3. In four-color, multilabeling experiments, in which FP-Sec23, GFP-proα2G610C(I), TagBFP2-LC3, and LAMP1-Halo were coexpressed (Fig. 6A), we found that over 90% of puncta containing FP-proα2G610C(I), FP-LC3, and FP-Sec23 were also positive for LAMP1-FP (Fig. 6 C and D, untreated). This suggested that puncta containing FP-proα2G610C(I), FP-Sec23, and FP-LC3 are efficiently delivered to lysosomes for subsequent degradation.
Fig. 6.
Autophagic structures at ERESs are engulfed by lysosomal membranes. (A and B) COPII-positive procollagen autophagic structures marked with GFP-proα2G610C(I), TagBFP2-LC3, and Apple-Sec23 were imaged by Airyscan microscopy in MC3T3 cells without (A) and with (B) 6 h 100 µM leupeptin treatment. The cells were also transfected with a lysosomal membrane marker, LAMP1-Halo. In zoomed panels, yellow outlines of LAMP1-positive puncta are projected in white onto other channels. (A, Bottom) Outlines show proα2G610C(I), LC3, and Sec23 surrounded by LAMP1-positive membranes; the large structure appears to be only partially surrounded. (B, Bottom) Outlines show multiple proα2/LC3/LAMP1 puncta that also contain Sec23. All images are single Airyscan slices; blue channels are displayed in cyan. [Scale bars: 10 µm (whole cell) and 2 µm (zoom).] (C–E) Effect of 6-h leupeptin treatment on procollagen autophagic structures. Bar charts display mean values ± SEM; ***P < 0.001. (C and D) Fraction of proα2/LC3 (C) and proα2/LC3/Sec23 (D) puncta that are also positive for LAMP1. (E) Fraction of proα2/LC3/LAMP1 puncta that are also positive for Sec23.
Quantitative colocalization analyses (SI Appendix, Fig. S6) revealed that FP-Sec23 was only in 10–15% of puncta containing FP-proα2G610C(I), FP-LC3, and LAMP1-FP (Fig. 6E, untreated), but this fraction increased to ∼50% when cells were treated for 6 h with leupeptin to block lysosomal hydrolases (Fig. 6 B and E, leupeptin). This suggested that puncta containing Sec23, procollagen, and LC3 were being delivered to lysosomes for degradation, but upon arrival there Sec23 was degraded by lysosomal hydrolases faster than procollagen and LC3.
Ultrastructural Analysis of Procollagen-Laden ERESs Undergoing Autophagy.
To explore the mechanism by which puncta containing procollagen, Sec23, and LC3 were directed toward lysosomes, we performed CLEM. Cells expressing FP-tagged versions of procollagen, Sec23, and LC3 were fixed and structures positive for these markers were imaged using enhanced resolution Airyscan microscopy. The images were then aligned with transmission electron microscopy images of the same cells after they were embedded in resin and sectioned.
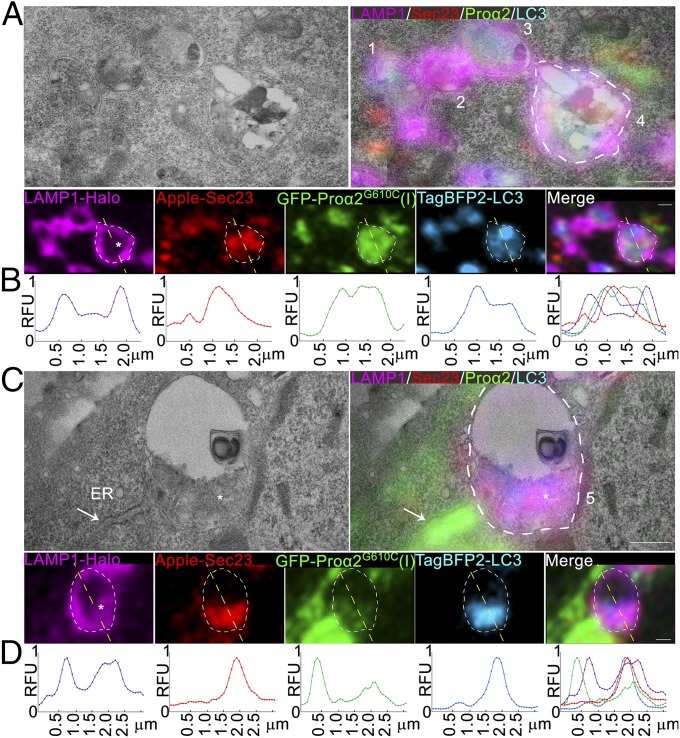
In many images, LAMP1-positive lysosomal membranes could be seen enveloping puncta positive for FP-proα2G610C(I), FP-LC3, and FP-Sec23 (Fig. 7 A and C). Line scans of fluorescence intensity across these structures indicated that FP-proα2G610C(I), FP-LC3, and FP-Sec23 signals were within the lysosome, with no FP-LC3 on the lysosome surface (Fig. 7 B and D). LAMP1-FP was detectable not only at the lysosomal surface but also inside the lysosome, where it colocalized with FP-Sec23, FP-LC3, and FP-proα2G610C(I) (Fig. 7 A and C). These observations suggested that puncta containing procollagen, Sec23, and LC3 were being engulfed by the lysosome rather than undergoing fusion with it. Indeed, no FP-LC3–positive double membranes (i.e., phagophore membranes) surrounded puncta containing FP-proα2G610C(I) and FP-Sec23, suggesting that phagophore membranes do not engulf these puncta as part of a macroautophagy process.
Fig. 7.
Ultrastructure of ERESs engulfed by lysosomes. (A and C) Correlative single-slice Airyscan and transmission electron microscopy images of MC3T3 cells transfected with GFP-proα2G610C(I), TagBFP2-LC3, Apple-Sec23, and LAMP1-Halo and treated with 100 µM leupeptin for 6 h to prevent Sec23 degradation. Autophagic procollagen ERES that appears to be only partially engulfed by lysosomal membrane is labeled 1. Lysosomes with internalized procollagen, LC3, and Sec23 are labeled 2 and 3. Lysosomes with internalized degradation products, procollagen, LC3, Sec23, and LAMP1 membranes are labeled 4 and 5. The asterisk in lysosome 5 (C) marks an apparent large clump of internalized lysosomal membranes. The arrow marks rough ER filled with procollagen, which is adjacent to lysosome 5. White outlines of lysosomes 4 and 5 are projected onto the fluorescent channels. Individual blue channels are displayed in cyan. (Scale bars: 0.5 µm.) (B and D) Line plots of relative fluorescence intensities (RFU) along the yellow dashed lines (top to bottom) shown in the corresponding fluorescence channels (A and C) above the plots.
Effect of Bafilomycin A1 on Procollagen Autophagy.
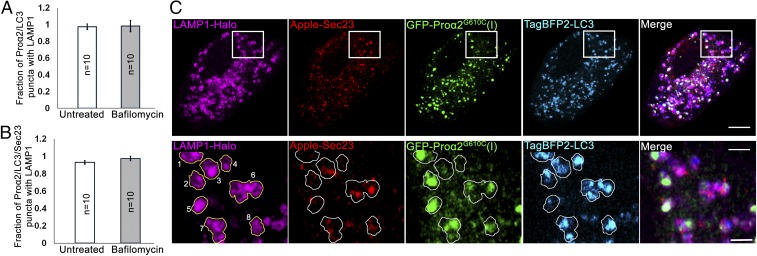
Bafilomycin A1 has been widely used to inhibit the final step of macroautophagy involving autophagosome–lysosome fusion (43–45). To obtain further evidence that puncta positive for procollagen, Sec23, and LC3 were not being delivered to lysosomes via a macroautophagy process, we treated cells with bafilomycin to see if this interfered with the puncta’s delivery to lysosomes. Bafilomycin A1’s activity in these cells was demonstrated by showing that the drug efficiently inhibited V-ATPase–mediated acidification (SI Appendix, Fig. S7 B and C), a different target of bafilomycin A1 (43, 44). Notably, no change in the fraction of puncta containing FP-proα2G610C(I), FP-LC3, and FP-Sec23 associated with LAMP1-labeled lysosomes was observed in bafilomycin-treated cells (Fig. 8 A and B), further supporting the idea that delivery of the puncta to lysosomes did not occur by macroautophagy.
Fig. 8.
Bafilomycin A1 does not affect the fraction of procollagen autophagic structures engulfed by lysosomal membranes. MC3T3 cells were transfected with GFP-proα2G610C(I), TagBFP2-LC3, Apple-Sec23, and LAMP1-Halo, treated with 100 nM bafilomycin A1 for 4 h to prevent autophagosome-lysosome fusion, and then imaged. (A and B) Quantified fractions of proα2G610C(I)/LC3 (A) and proα2G610C(I)/LC3/Sec23 (B) puncta that are also positive for LAMP1 in bafilomycin A1-treated and untreated cells. Bar charts display mean values ± SEM. (C) Single-slice Airyscan images illustrating no accumulation of proα2G610C(I)/LC3-positive puncta that are LAMP1-negative after bafilomycin A1 treatment. Yellow outlines of LAMP1 puncta projected onto other channels in zoomed images (Bottom) show lysosomes with procollagen and LC3, some of which (3 and 6–8) contain Sec23 and some (1, 2, 4, and 5) have little or no Sec23. Individual blue channels are displayed in cyan. [Scale bars: 10 µm (whole cell) and 2 µm (zoom).]
Dynamics of Sec23 on Puncta Containing Procollagen, Sec23, and LC3.
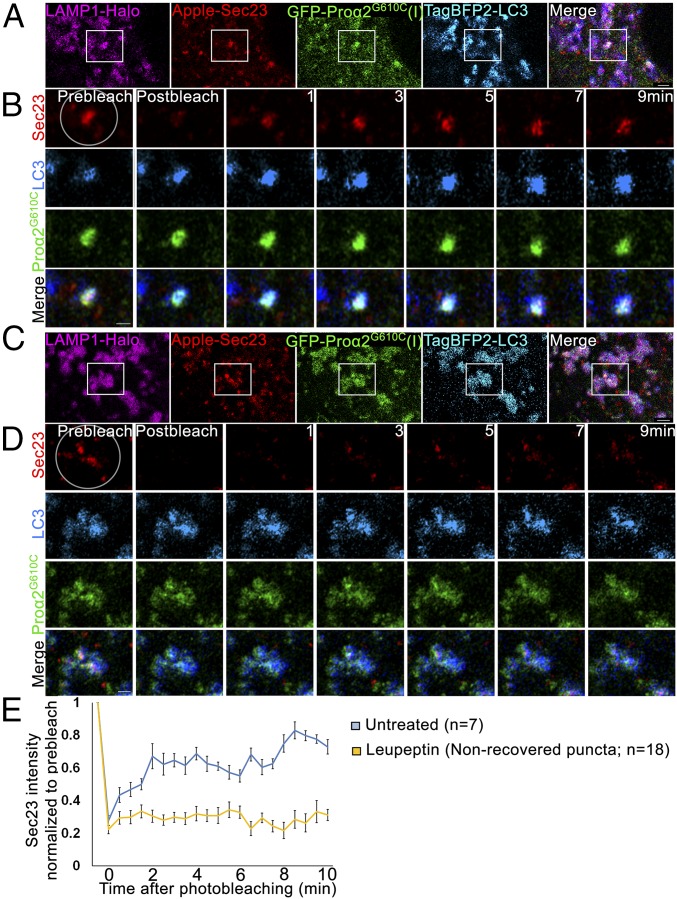
In creating the COPII coat on ERES membranes, Sec23/31 subunits undergo continuous membrane binding and dissociation. This has been previously demonstrated in fluorescence recovery after photobleaching (FRAP) experiments, in which bleached coat subunits at ERESs are quickly replaced with nonbleached subunits from the surrounding cytoplasm, resulting in fluorescence recovery (9, 10). Employing similar FRAP protocols, we found that FP-Sec23 on most puncta containing FP-Sec23, FP-proα2G610C(I), FP-LC3, and LAMP1-FP underwent recovery after bleaching, indicating FP-Sec23 was exchanging with cytoplasmic pools (Fig. 9 A–C and Movie S5). When cells were treated with leupeptin to delay the degradation of substrates inside lysosomes, however, recovery was no longer seen in a large fraction of the puncta, suggesting there was now no exchange of FP-Sec23 with its cytoplasmic pool. Presumably, FP-Sec23 was now better preserved in the puncta that were fully engulfed inside lysosomes, which would prevent any exchange of bleached FP-Sec23 within puncta with unbleached molecules in the cytoplasm (Fig. 9 D–F, SI Appendix, Fig. S8, and Movie S5).
Fig. 9.
Sec23 dynamics in procollagen autophagic ERESs engulfed by lysosomal membranes. (A and C) Single-slice confocal images of GFP-proα2G610C(I), TagBFP2-LC3, Apple-Sec23, and LAMP1-Halo–positive puncta in untreated MC3T3 cells (A) and after 6-h 100 µM leupeptin treatment (C). Individual blue channels are displayed in cyan. (Scale bars: 2 µm.) (B and D) High-magnification, single-slice Airyscan microscopy images of the boxed regions before and 0, 1, 3, 5, 7, and 9 min after Apple-Sec23 photobleaching within the circled area (selected from full 30-s-per-image time-lapse sets shown in Movie S5). Individual blue channels are displayed in cyan. (Scale bars: 1 µm.) (E) Average kinetics of Apple-Sec23 fluorescence recovery in untreated cells and in cells pretreated for 6 h with 100 µM leupeptin. In the treated cells, the kinetics are shown only for the puncta that exhibited no fluorescence recovery (∼65% of all puncta); average kinetics of fluorescence recovery in the other 35% of the puncta is shown in SI Appendix, Fig. S8. Graph displays mean intensity relative to the prebleach value ± SEM.
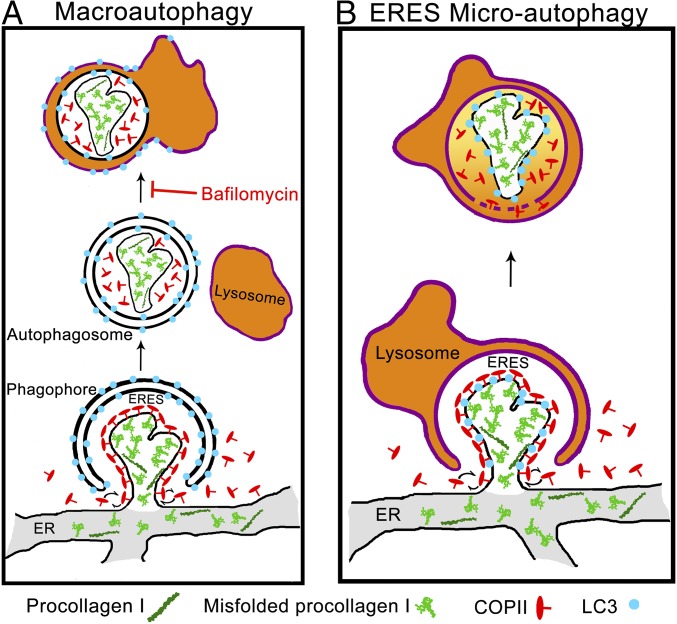
These results further argued against macroautophagy as a mechanism for delivery of puncta containing procollagen, Sec23, and LC3 to lysosomes. As shown in Fig. 10A, macroautophagy would predict that Sec23 should stop exchanging with cytoplasmic pools as soon as it is enveloped by a phagophore membrane. As this should occur before a Sec23/LC3-labeled autophagosome interacts with a lysosome, exchange of Sec23 with cytoplasmic pools should not occur at LAMP1-positive puncta and should not be impacted by leupeptin treatment. The data instead supported a microautophagy mechanism implied by the above CLEM data, in which lysosomes envelope puncta containing procollagen, Sec23, and LC3 (see model in Fig. 10B). In this model, Sec23 would continue to exchange on and off LC3-modified ERESs as nearby lysosomes start to envelope these sites. Once the ERES is fully enveloped by the lysosome, Sec23 exchange with the cytoplasm would stop. Leupeptin treatment would give rise to higher levels of Sec23 that show no recovery after photobleaching since this treatment prevents degradation of procollagen, Sec23, and LC3 inside fully enveloped lysosomes.
Fig. 10.
Noncanonical ERES microautophagy model of procollagen degradation. Schematics of macroautophagy (A) and microautophagy (B) pathways of ERES degradation. In macroautophagy, the cargo is first internalized inside a double-membrane autophagosome followed by autophagosome-lysosome fusion. In microautophagy, the cargo is directly engulfed by a lysosome. Misfolded procollagen aggregates appear to enter ERESs on their own or together with normally folded molecules, preventing formation of Golgi-bound carrier vesicles and activating autophagy machinery (perhaps because of their size/structure). These ERESs are then degraded by microautophagy, as suggested by the following observations. (i) Airyscan and CLEM microscopy show LC3 membranes intermixing with (expected in microautophagy) rather than encapsulating (expected in macroautophagy) Sec23 and procollagen. (ii) CLEM shows LC3 inside but not on the LAMP1-positive lysosome surface, as expected after lysosomal engulfment but not autophagosome–lysosome fusion. (iii) CLEM also shows encapsulation of LAMP1-positive membranes together with autophagic ERES inside the lysosome, as expected after lysosomal engulfment but not autophagosome–lysosome fusion. (iv) No effect of bafilomycin A1 on lysosomal internalization of autophagic ERESs containing procollagen is consistent with micro- but not macroautophagy. (v) Sec23 photobleaching experiments show rapid exchange of Sec23 between cytoplasm and LAMP1-positive autophagic ERESs, which is possible at ERESs partially engulfed by lysosomes in microautophagy but not after autophagosome–lysosome fusion.
Discussion
In this paper, we provide evidence that a subset of folded/misfolded procollagen molecules are directed toward lysosomal degradation through a pathway initiated at ERESs. In this pathway, procollagen-laden ERESs decorated with both COPII coat proteins and autophagy-related proteins are directly engulfed by nearby lysosomes through a microautophagy-like process (Fig. 10B). Since expression of mutant proα2(I) chain [which increases procollagen misfolding relative to expression of wild-type proα2(I)] increased procollagen entry into this pathway, the pathway’s role is likely for routing misfolded molecules toward degradation.
Other pathways for removal of excess and/or misfolded procollagen, such as ER-phagy, are possible and could depend on the extent of procollagen misfolding, collagen type, cell type, or experimental conditions. However, no procollagen turnover by ER-phagy was evident in our experiments. This suggested that ERES-initiated degradation of procollagen was a major pathway for disposal of misfolded/abnormal procollagen in our cells. While the precise amount of procollagen routed into this pathway was unclear, ∼3–5% of intracellular FP- proα2G610C(I) was found in LC3-positive structures. Given that ∼50% of all LC3-positive structures contained procollagen, the pathway accounted for a major fraction of the autophagic flux in the cell (Fig. 1E).
Prior work has reported that a subpopulation of ERESs interact with autophagy modulators/receptors, serving as a membrane source for precursors of autophagic structures (20). Our analysis of procollagen trafficking suggests that ERESs might also serve as entry points for unwanted secretory cargo into a noncanonical autophagy pathway. This pathway would begin by influx of misfolded molecules like procollagen into the elaborate membrane domains comprising an ERES. Due to the presence of the misfolded proteins, the ERES would become modified with ubiquitin, causing autophagy machinery to get recruited to it. Nearby lysosomes would then engulf the ERES through the process of microautophagy (Fig. 10B).
What is the most important evidence for this model? First, time-lapse imaging revealed puncta containing FP-proα2G610C(I), FP-Sec23, and FP-LC3 appeared abruptly and then remained immobile before their delivery to lysosomes (Fig. 5 and Movie S4). This suggested they were modified ERESs rather than ER-to-Golgi transport intermediates, the latter of which had no COPII coat and moved quickly away from ERESs toward the Golgi (SI Appendix, Fig. S5 and Movies S2 and S3). Second, puncta containing FP-proα2G610C(I), FP-Sec23, and FP-LC3 could be seen inside lysosomes by CLEM (Fig. 7). Third, these internal structures contained lysosomal membrane, implying a microautophagy rather macroautophagy mode of delivery. Consistent with this possibility, delivery of the puncta to lysosomes was not blocked by the macroautophagy inhibitor bafilomycin A1 (Fig. 8). Furthermore, Sec23 subunits continued to exchange on and off the puncta even after the puncta became colocalized with lysosomes (Fig. 9). Envelopment by phagophore membranes in the process of macroautophagy precludes such exchange of Sec23 with surrounding cytoplasm. In a microautophagy delivery mode, however, such exchange would be possible if engulfment by the lysosome was slow.
Given this model for ERES-initiated autophagy, many questions arise. One issue is how cargo like misfolded procollagen is recognized for entry into the pathway. Misfolding of the procollagen triple helix, which can result in gelatin-like aggregates, is distinct from misfolding of globular proteins (4, 6) in that it does not expose large hydrophobic surfaces that bind BIP or other ER chaperones, which normally prevent unfolded/misfolded globular proteins from entering the secretory pathway (46, 47). This could help explain why in prior studies of procollagen autophagy in primary osteoblasts no UPR activation was seen (4). Therefore, misfolded procollagen molecules might escape chaperone-based ER quality control and enter ERESs on their own, or together with normally folded molecules. We envision that the presence of sufficient levels of misfolded procollagen in an ERES would then delay/disrupt formation of Golgi-bound carriers, perhaps by being too bulky, triggering ERES modification and recruitment of autophagic machinery.
Another question is how an ERES that contains misfolded procollagen becomes modified with autophagic machinery. Prior work has shown that the CUL3 ubiquitin ligase adaptor protein KLHL12 helps to ubiquitinate Sec31 (48, 49). One possibility, therefore, is that buildup of misfolded procollagen pools at an ERES leads to ubiquitination of ERES surface proteins, initiating downstream recruitment of autophagy machinery. Consistent with this scenario we found that KLHL12, CUL3, and an additional adaptor Keap1 were associated with puncta containing FP-proα2G610C(I), FP-Sec23, and FP-LC3 (Fig. 4). Other autophagy proteins were also seen associated with these puncta, including FP-Atg14 and FP-Atg9, as well as the autophagy adaptor FP-p62 (Fig. 3).
Modification of COPII subunits in response to procollagen accumulation could be a critical factor in mediating ERES autophagy. Monoubiquitination of Sec31 by the CUL3/KLHL12 complex has been proposed to be involved in the formation of giant COPII vesicles, enabling procollagen molecules to leave the ER (48, 49). We found COPII subunits, CUL3 and KLHL12 were associated with procollagen puncta marked with LC3. These puncta were relatively stationary (Figs. 3–5 and Movie S4), unlike the rapidly moving, Golgi-bound vesicles with procollagen. The Golgi-bound vesicles lacked a COPII coat (SI Appendix, Fig. S5 and Movies S2 and S3), as suggested in prior studies examining procollagen movement to the Golgi (50, 51). These results raise the possibility that modification of COPII subunits by ubiquitination machinery is involved in recognizing misfolded forms of procollagen at ERESs and in redirecting them into the ERES autophagy pathway. This role would be distinct from that previously described for ubiquitinated COPII in trafficking of procollagen into the secretory pathway (48, 49).
Further work is necessary for understanding how disease-causing COPII mutants induce pathologies in collagen-rich tissues, which include a severe form of osteogenesis imperfecta (14, 16, 17), considered to be primarily a type I procollagen disorder (18, 19). While it is possible the disease-causing COPII mutants perturb entry of procollagen into the secretory pathway (i.e., by preventing formation of so-called giant COPII vesicles enriched in procollagen) (11, 12, 14, 15), they could also be disrupting procollagen’s ability to be rerouted into the autophagy pathway occurring at ERESs described here.
A final set of questions relates to how lysosomes target LC3-decorated ERESs containing procollagen and whether ERES microautophagy is activated by stresses other than procollagen misfolding. Currently, we do not know the mechanism by which lysosomes move to ERESs to engulf them. Likewise, it is unclear whether this pathway is triggered by other conditions. For instance, under amino acid starvation, COPII coat proteins (52, 53) and ERESs (20) have been shown to play a role in regulating autophagy. Perhaps direct rerouting of secretory cargo from ERESs to lysosomes through ERES microautophagy under starvation conditions could help resupply the cell with amino acids from a now-disposable source (i.e., secretion). Regardless of whether it is activated by other conditions, ERES microautophagy seems to be a natural pathway for diverting proteins that escape the ER lumen quality control from the secretory route to lysosomal degradation.
Materials and Methods
Cell Lines and Primary Cell Culture.
MC3T3-E1 Subclone 4 osteoblast cell lines were acquired from ATCC (ATCC CRL-2593). Cells were cultured in αMEM + Glutamax (32571-036; Gibco) supplemented with 10% FBS (Sigma-Aldrich) and 1% Pen/Strep (Corning). To stimulate procollagen synthesis and secretion, ascorbic acid 2-phospate (Sigma-Aldrich) was supplemented 18–24 h before imaging experiments.
Primary osteoblasts were extracted from mice harboring the G610C mutation and their wild-type littermates (B6.129(FVB)-Col1a2tm1Mcbr/J; Jackson Laboratories), which were maintained on the C57BL/6J background (4, 23). Osteoblasts were extracted from parietal bones of 3- to 8-d-old mice as previously described (4). All care and procedures were performed in accordance with a Eunice Kennedy Shriver National Institute of Child Health and Human Development Animal Care and Use Committee-approved protocol.
Constructs.
Two FP-proα2(I) constructs were generated. In one construct, FP cDNA was placed between the signal sequence and exon 6 Col1a2 cDNA (Origene), replacing exons 1–5 that encode the N-propeptide and its cleavage site, following the cloning protocol generously provided by Sarah Dallas (21, 54). In another construct, FP cDNA replaced exons 2–3, retaining the cleavage site and the minor triple helix of the N-propeptide. Both constructs demonstrated identical trafficking and secretion patterns. FP-proα1(I) construct was similar to the second FP-proα2(I) construct. Other FP-tagged proteins were based on the following constructs: GM130-Cherry modified from GM130-CFP (34), Ii33-Cerulean (55), and IL33-mRFP (55). FP-LC3 constructs were modified from CFP-LC3 (56); LAMP1-FP from LAMP1-Cherry (57); FP-Sec23 from YFP-Sec23A, a gift from David Stephens, University of Bristol, Bristol, United Kingdom (Addgene 66611) (10); FP-Sec31 modified from pECFP-Sec31A, a gift from David Stephens (Addgene 66612) (10); FP-Ub modified from GFP-Ub, a gift from Nico Dantuma, Karolinska Institutet, Stockholm (Addgene 11928) (58); FP-p62 modified from pMXs-puro GFP-p62, a gift from Noboru Mizushima, University of Tokyo, Tokyo (Addgene 38277) (59); ssHalo-KDEL modified from mEmerald-ER-3, a gift from Michael Davidson, Florida State University, Tallahassee, FL (Addgene 54082); Halo-Sec61 modified from mApple-Sec61-C-18, a gift from Michael Davidson (Addgene 54946); Halo-KLHL12 modified from XE250 pCDNA3.1 + (zeo)- VSV-KLHL12-Q405X, a gift from Randall Moon, University of Washington, Seattle (Addgene 16759); and FP-Halo modified from pENTR4-HaloTag (w876-1), a gift from Eric Campeau, University of Massachusetts, Worcester, MA (Addgene 29644). The following FPs were utilized: eGFP-N1 (GFP), mCherry-N1 (Cherry), HaloTag-N1 (Halo), mApple-N1 (Apple), mVenus-N1 (Venus), mCerulean-N1 (Cerulean), and mTagBFP2-N1 (TagBFP2). Janelia Fluor Dye 646 (60, 61) was utilized for marking Halo-tagged molecules in live cells.
FP-proα2 (I) and FP-proα1 (I) with GFP and Venus FP had low transfection efficiencies but were otherwise well-expressed and appeared to have minimal or no effect on procollagen synthesis and trafficking as well as cell function, unless dramatically overexpressed. Only the cells with low or moderate expression levels of FP-procollagen were utilized for imaging experiments. Cells that accumulated large aggregates within the ER lumen, although physiologically relevant and recapitulating in vivo observations of ER stress (4), were not utilized for studies of trafficking or degradation. TagBFP2, Cerulean, or Apple FP-procollagen constructs had even lower transfection efficiencies than GFP and Venus constructs but displayed no abnormal distributions. FP-procollagen with Cherry had an abnormal localization pattern inside the cell, which appeared to be caused by Cherry dimerization.
Transfection and Treatments.
MC3T3 cells were transfected with Fugene 6 (Promega) and primary cells were transfected with TransIT-LT1 (Mirus Bio), using the manufacturer’s protocols. Cells were imaged 18–24 h after transfection and subsequent incubation in αMEM + Glutamax media supplemented with 100 µM ascorbic acid 2-phoshate (Sigma-Aldrich) and 10% FBS from Valley Biomedical (lot no. 2C0550 tested for supporting osteoblast differentiation). Fifty micromolar H89 (Sigma-Aldrich), 5 µg/mL BFA (Cell Signaling), 100 nM bafilomycin A1 (Sigma-Aldrich), and 100 µM leupeptin (Sigma-Aldrich) were added to the cell culture media as needed at the time points indicated in the text.
Immunofluorescence.
Cells were fixed in freshly prepared methanol-free 2% formaldehyde (Thermo Fisher Scientific) solution in PBS, pH 7.4, for 10–15 min, washed in PBS, permeabilized in 0.4% Triton X in PBS for 10 min, and returned to PBS. After 30-min blocking in 3% BSA in PBS for 30 min, cells were incubated overnight at 4 °C with primary antibody diluted in the same blocking buffer then washed and incubated for 30–60 min with secondary Alexa Fluor-labeled antibodies (Thermo Fisher Scientific) diluted with 1.5% BSA in PBS. After the final PBS wash, cells were either imaged immediately or mounted with Prolong Diamond Antifade with DAPI (Thermo Fisher Scientific) for subsequent imaging. The following primary antibodies were utilized: anti-procollagen (AB765P; Millipore), anti-LC3 (3868; Cell Signaling), anti-SEC31 (13483; Cell Signaling), anti-GM130 (610822; BD Biosciences), and anti-PDI (1D3; Enzo Life Sciences).
Imaging.
Live- or fixed-cell imaging was performed on an LSM 880 microscope (Zeiss) with a 63× oil objective at standard confocal resolution or enhanced Airyscan resolution. Live-cell imaging was performed with line scanning whereas fixed-cell imaging was performed with frame scanning. For CLEM imaging, MC3T3 cells were grown on fibronectin-coated gridded cover glass (72265-50; EMS) and transfected as described above. After transfection for 18 h, cells were fixed with 2% formaldehyde and 0.1% glutaraldehyde (Sigma-Aldrich) in PBS for 10 min and imaged in PBS with Airyscan resolution. After imaging, the cells were additionally fixed in 2.5% glutaraldehyde, 2% formaldehyde, and 2 mM CaCl2 in 0.1 M sodium cacodylate, pH 7.4, for 15 min at room temperature followed by 45 min on ice. The coverslips were washed for 5 min four times, postfixed with 2% OsO4 for 2 h in the same buffer at 4 °C, extensively washed with water, stained with 2% uranyl acetate in water, dehydrated through series of increasing ethanol concentrations (30, 50, 70, and 90%, three changes of 100%) and embedded in EMBed 812 epoxy resin (EMS). After resin polymerization, the coverslip was removed with hydrofluoric acid. Cells previously imaged by light microscopy were identified by their position on the grid. A 1- × 1-mm area containing the cell(s) of interest was cut out using a jeweler’s saw, mounted on an aluminum holder, and trimmed to 300 µm × 300 µm. Serial 70- to 80-nm sections were cut parallel to the plane of the coverslip and mounted on formvar/carbon-coated slot (0.5 × 2 mm) EM grids. Sections were stained with 2% uranyl acetate in 50% ethanol and imaged in an FEI Tecnai 20 transmission electron microscope operated at 120 kV. Images were recorded on AMT XR81 widefield CCD camera. Light and electron microscopy images were manually aligned based on well-defined organelles.
Photobleach Corrections for Time-Lapse Videos of Fluorescence Recovery Experiments.
Time-lapse sequences and videos were corrected for photobleaching associated with acquisition of multiple images from the same area by using a bleach correction plugin based on histogram matching within the FIJI image processing package (62). In FP-Sec23 fluorescence recovery after photobleaching experiments (Fig. 9 and SI Appendix, Fig. S8), intensity of FP-Sec23 puncta within the bleached fluorescence recovery area was normalized to the intensity of adjacent FP- Sec23 puncta in the same image outside this area.
Biochemical Assays.
Procollagen folding, secretion, and degradation were measured by Western blotting and pulse-chase experiments with azidohomoalanine as described in SI Appendix, Fig. S3 C–E (4, 63–65).
Quantitation and Statistical Analysis.
Images were quantitatively analyzed using custom generated macros for FIJI image processing package as illustrated in SI Appendix, Fig. S6. Two-way ANOVA with a Holm–Sidak post hoc test (SigmaPlot 13.0; SYSTAT) was performed for analysis of transfected and treated primary osteoblasts (SI Appendix, Figs. S2 and S3E). One-way repeated-measures ANOVA with a Holm–Sidak post hoc test was performed on time-series data with BFA or H89 treatment (Fig. 2 C and D). Heteroscedastic, two tailed t tests were performed for all other data.
Supplementary Material
Acknowledgments
We thank Eric Campeau, Nico Dantuma, Michael Davidson, Noboru Mizushima, Randall Moon, and David Stephens for sharing their constructs; Sarah Dallas for sharing her GFP-proα2(I) cloning protocol; and Laura Gorrell, Edward Mertz, Chris Obara, Prasanna Satpute-Krishnan, Aubrey Weigel, Chad Williamson, and particularly Prabuddha Sengupta, for plasmids, assistance, discussions, and advice. This work was funded in part by the Intramural Research Program of the Eunice Kennedy Shriver National Institute of Child Health and Human Development.
Footnotes
The authors declare no conflict of interest.
This article contains supporting information online at www.pnas.org/lookup/suppl/doi:10.1073/pnas.1814552115/-/DCSupplemental.
References
- 1.Ishikawa Y, Bächinger HP. A molecular ensemble in the rER for procollagen maturation. Biochim Biophys Acta. 2013;1833:2479–2491. doi: 10.1016/j.bbamcr.2013.04.008. [DOI] [PubMed] [Google Scholar]
- 2.Makareeva E, Aviles NA, Leikin S. Chaperoning osteogenesis: New protein-folding disease paradigms. Trends Cell Biol. 2011;21:168–176. doi: 10.1016/j.tcb.2010.11.007. [DOI] [PMC free article] [PubMed] [Google Scholar]
- 3.Bienkowski RS, Gotkin MG. Control of collagen deposition in mammalian lung. Proc Soc Exp Biol Med. 1995;209:118–140. doi: 10.3181/00379727-209-43886a. [DOI] [PubMed] [Google Scholar]
- 4.Mirigian LS, et al. Osteoblast malfunction caused by cell stress response to procollagen misfolding in α2(I)-G610C mouse model of osteogenesis imperfecta. J Bone Miner Res. 2016;31:1608–1616. doi: 10.1002/jbmr.2824. [DOI] [PMC free article] [PubMed] [Google Scholar]
- 5. Shapiro JR, Byers PH, Glorieux FH, Sponseller PD, eds (2014) Osteogenesis Imperfecta (Elsevier, Amsterdam), pp 555.
- 6.Ishida Y, et al. Autophagic elimination of misfolded procollagen aggregates in the endoplasmic reticulum as a means of cell protection. Mol Biol Cell. 2009;20:2744–2754. doi: 10.1091/mbc.E08-11-1092. [DOI] [PMC free article] [PubMed] [Google Scholar]
- 7.Galluzzi L, et al. Molecular definitions of autophagy and related processes. EMBO J. 2017;36:1811–1836. doi: 10.15252/embj.201796697. [DOI] [PMC free article] [PubMed] [Google Scholar]
- 8.Ktistakis NT, Tooze SA. Digesting the expanding mechanisms of autophagy. Trends Cell Biol. 2016;26:624–635. doi: 10.1016/j.tcb.2016.03.006. [DOI] [PubMed] [Google Scholar]
- 9.Kirk SJ, Ward TH. COPII under the microscope. Semin Cell Dev Biol. 2007;18:435–447. doi: 10.1016/j.semcdb.2007.07.007. [DOI] [PubMed] [Google Scholar]
- 10.Stephens DJ, Lin-Marq N, Pagano A, Pepperkok R, Paccaud JP. COPI-coated ER-to-Golgi transport complexes segregate from COPII in close proximity to ER exit sites. J Cell Sci. 2000;113:2177–2185. doi: 10.1242/jcs.113.12.2177. [DOI] [PubMed] [Google Scholar]
- 11.Boyadjiev SA, et al. Cranio-lenticulo-sutural dysplasia is caused by a SEC23A mutation leading to abnormal endoplasmic-reticulum-to-Golgi trafficking. Nat Genet. 2006;38:1192–1197. doi: 10.1038/ng1876. [DOI] [PubMed] [Google Scholar]
- 12.Boyadjiev SA, et al. Cranio-lenticulo-sutural dysplasia associated with defects in collagen secretion. Clin Genet. 2011;80:169–176. doi: 10.1111/j.1399-0004.2010.01550.x. [DOI] [PMC free article] [PubMed] [Google Scholar]
- 13.Fromme JC, et al. The genetic basis of a craniofacial disease provides insight into COPII coat assembly. Dev Cell. 2007;13:623–634. doi: 10.1016/j.devcel.2007.10.005. [DOI] [PMC free article] [PubMed] [Google Scholar]
- 14.Garbes L, et al. Mutations in SEC24D, encoding a component of the COPII machinery, cause a syndromic form of osteogenesis imperfecta. Am J Hum Genet. 2015;96:432–439. doi: 10.1016/j.ajhg.2015.01.002. [DOI] [PMC free article] [PubMed] [Google Scholar]
- 15.Lang MR, Lapierre LA, Frotscher M, Goldenring JR, Knapik EW. Secretory COPII coat component Sec23a is essential for craniofacial chondrocyte maturation. Nat Genet. 2006;38:1198–1203. doi: 10.1038/ng1880. [DOI] [PubMed] [Google Scholar]
- 16.Moosa S, et al. Mutations in SEC24D cause autosomal recessive osteogenesis imperfecta. Clin Genet. 2015;89:517–519. doi: 10.1111/cge.12678. [DOI] [PubMed] [Google Scholar]
- 17.Zhang H, et al. Novel mutations in the SEC24D gene in Chinese families with autosomal recessive osteogenesis imperfecta. Osteoporos Int. 2017;28:1473–1480. doi: 10.1007/s00198-016-3866-2. [DOI] [PubMed] [Google Scholar]
- 18.Forlino A, Marini JC. Osteogenesis imperfecta. Lancet. 2016;387:1657–1671. doi: 10.1016/S0140-6736(15)00728-X. [DOI] [PMC free article] [PubMed] [Google Scholar]
- 19.Marini JC, Blissett AR. New genes in bone development: What’s new in osteogenesis imperfecta. J Clin Endocrinol Metab. 2013;98:3095–3103. doi: 10.1210/jc.2013-1505. [DOI] [PMC free article] [PubMed] [Google Scholar]
- 20.Ge L, et al. Remodeling of ER-exit sites initiates a membrane supply pathway for autophagosome biogenesis. EMBO Rep. 2017;18:1586–1603. doi: 10.15252/embr.201744559. [DOI] [PMC free article] [PubMed] [Google Scholar]
- 21.Lu Y, et al. Live imaging of type I collagen assembly dynamics in osteoblasts stably expressing GFP and mCherry-tagged collagen constructs. J Bone Miner Res. 2018;33:1166–1182. doi: 10.1002/jbmr.3409. [DOI] [PMC free article] [PubMed] [Google Scholar]
- 22.Sudo H, Kodama HA, Amagai Y, Yamamoto S, Kasai S. In vitro differentiation and calcification in a new clonal osteogenic cell line derived from newborn mouse calvaria. J Cell Biol. 1983;96:191–198. doi: 10.1083/jcb.96.1.191. [DOI] [PMC free article] [PubMed] [Google Scholar]
- 23.Daley E, et al. Variable bone fragility associated with an Amish COL1A2 variant and a knock-in mouse model. J Bone Miner Res. 2010;25:247–261. doi: 10.1359/jbmr.090720. [DOI] [PMC free article] [PubMed] [Google Scholar]
- 24.Suzuki K, Kubota Y, Sekito T, Ohsumi Y. Hierarchy of Atg proteins in pre-autophagosomal structure organization. Genes Cells. 2007;12:209–218. doi: 10.1111/j.1365-2443.2007.01050.x. [DOI] [PubMed] [Google Scholar]
- 25.Lamb CA, et al. TBC1D14 regulates autophagy via the TRAPP complex and ATG9 traffic. EMBO J. 2016;35:281–301. doi: 10.15252/embj.201592695. [DOI] [PMC free article] [PubMed] [Google Scholar]
- 26.Popovic D, Dikic I. TBC1D5 and the AP2 complex regulate ATG9 trafficking and initiation of autophagy. EMBO Rep. 2014;15:392–401. doi: 10.1002/embr.201337995. [DOI] [PMC free article] [PubMed] [Google Scholar]
- 27.Khaminets A, Behl C, Dikic I. Ubiquitin-dependent and independent signals in selective autophagy. Trends Cell Biol. 2016;26:6–16. doi: 10.1016/j.tcb.2015.08.010. [DOI] [PubMed] [Google Scholar]
- 28.Lippai M, Lőw P. The role of the selective adaptor p62 and ubiquitin-like proteins in autophagy. BioMed Res Int. 2014;2014:832704. doi: 10.1155/2014/832704. [DOI] [PMC free article] [PubMed] [Google Scholar]
- 29.Bernales S, McDonald KL, Walter P. Autophagy counterbalances endoplasmic reticulum expansion during the unfolded protein response. PLoS Biol. 2006;4:e423. doi: 10.1371/journal.pbio.0040423. [DOI] [PMC free article] [PubMed] [Google Scholar]
- 30.Hamasaki M, Noda T, Baba M, Ohsumi Y. Starvation triggers the delivery of the endoplasmic reticulum to the vacuole via autophagy in yeast. Traffic. 2005;6:56–65. doi: 10.1111/j.1600-0854.2004.00245.x. [DOI] [PubMed] [Google Scholar]
- 31.Hetz C, Papa FR. The unfolded protein response and cell fate control. Mol Cell. 2018;69:169–181. doi: 10.1016/j.molcel.2017.06.017. [DOI] [PubMed] [Google Scholar]
- 32.Altan-Bonnet N, Phair RD, Polishchuk RS, Weigert R, Lippincott-Schwartz J. A role for Arf1 in mitotic Golgi disassembly, chromosome segregation, and cytokinesis. Proc Natl Acad Sci USA. 2003;100:13314–13319. doi: 10.1073/pnas.2234055100. [DOI] [PMC free article] [PubMed] [Google Scholar]
- 33.Lippincott-Schwartz J, et al. Brefeldin A’s effects on endosomes, lysosomes, and the TGN suggest a general mechanism for regulating organelle structure and membrane traffic. Cell. 1991;67:601–616. doi: 10.1016/0092-8674(91)90534-6. [DOI] [PubMed] [Google Scholar]
- 34.Ward TH, Polishchuk RS, Caplan S, Hirschberg K, Lippincott-Schwartz J. Maintenance of Golgi structure and function depends on the integrity of ER export. J Cell Biol. 2001;155:557–570. doi: 10.1083/jcb.200107045. [DOI] [PMC free article] [PubMed] [Google Scholar]
- 35.Ge L, Melville D, Zhang M, Schekman R. The ER-Golgi intermediate compartment is a key membrane source for the LC3 lipidation step of autophagosome biogenesis. eLife. 2013;2:e00947. doi: 10.7554/eLife.00947. [DOI] [PMC free article] [PubMed] [Google Scholar]
- 36.Ishihara N, et al. Autophagosome requires specific early Sec proteins for its formation and NSF/SNARE for vacuolar fusion. Mol Biol Cell. 2001;12:3690–3702. doi: 10.1091/mbc.12.11.3690. [DOI] [PMC free article] [PubMed] [Google Scholar]
- 37.Reggiori F, et al. Early stages of the secretory pathway, but not endosomes, are required for Cvt vesicle and autophagosome assembly in Saccharomyces cerevisiae. Mol Biol Cell. 2004;15:2189–2204. doi: 10.1091/mbc.E03-07-0479. [DOI] [PMC free article] [PubMed] [Google Scholar]
- 38.Sanchez-Wandelmer J, Ktistakis NT, Reggiori F. ERES: Sites for autophagosome biogenesis and maturation? J Cell Sci. 2015;128:185–192. doi: 10.1242/jcs.158758. [DOI] [PubMed] [Google Scholar]
- 39.Graef M, Friedman JR, Graham C, Babu M, Nunnari J. ER exit sites are physical and functional core autophagosome biogenesis components. Mol Biol Cell. 2013;24:2918–2931. doi: 10.1091/mbc.E13-07-0381. [DOI] [PMC free article] [PubMed] [Google Scholar]
- 40.Lee TH, Linstedt AD. Potential role for protein kinases in regulation of bidirectional endoplasmic reticulum-to-Golgi transport revealed by protein kinase inhibitor H89. Mol Biol Cell. 2000;11:2577–2590. doi: 10.1091/mbc.11.8.2577. [DOI] [PMC free article] [PubMed] [Google Scholar]
- 41.Aridor M, Balch WE. Kinase signaling initiates coat complex II (COPII) recruitment and export from the mammalian endoplasmic reticulum. J Biol Chem. 2000;275:35673–35676. doi: 10.1074/jbc.C000449200. [DOI] [PubMed] [Google Scholar]
- 42.Hanna MG, 4th, et al. TFG facilitates outer coat disassembly on COPII transport carriers to promote tethering and fusion with ER-Golgi intermediate compartments. Proc Natl Acad Sci USA. 2017;114:E7707–E7716, and correction (2017) 114:E8547–E8548. doi: 10.1073/pnas.1709120114. [DOI] [PMC free article] [PubMed] [Google Scholar]
- 43.Mauvezin C, Nagy P, Juhász G, Neufeld TP. Autophagosome-lysosome fusion is independent of V-ATPase-mediated acidification. Nat Commun. 2015;6:7007. doi: 10.1038/ncomms8007. [DOI] [PMC free article] [PubMed] [Google Scholar]
- 44.Mauvezin C, Neufeld TP. Bafilomycin A1 disrupts autophagic flux by inhibiting both V-ATPase-dependent acidification and Ca-P60A/SERCA-dependent autophagosome-lysosome fusion. Autophagy. 2015;11:1437–1438. doi: 10.1080/15548627.2015.1066957. [DOI] [PMC free article] [PubMed] [Google Scholar]
- 45.Yamamoto A, et al. Bafilomycin A1 prevents maturation of autophagic vacuoles by inhibiting fusion between autophagosomes and lysosomes in rat hepatoma cell line, H-4-II-E cells. Cell Struct Funct. 1998;23:33–42. doi: 10.1247/csf.23.33. [DOI] [PubMed] [Google Scholar]
- 46.Bertolotti A, Zhang Y, Hendershot LM, Harding HP, Ron D. Dynamic interaction of BiP and ER stress transducers in the unfolded-protein response. Nat Cell Biol. 2000;2:326–332. doi: 10.1038/35014014. [DOI] [PubMed] [Google Scholar]
- 47.Carrara M, Prischi F, Nowak PR, Kopp MC, Ali MM. Noncanonical binding of BiP ATPase domain to Ire1 and Perk is dissociated by unfolded protein CH1 to initiate ER stress signaling. eLife. 2015;4:e03522. doi: 10.7554/eLife.03522. [DOI] [PMC free article] [PubMed] [Google Scholar]
- 48.Jin L, et al. Ubiquitin-dependent regulation of COPII coat size and function. Nature. 2012;482:495–500. doi: 10.1038/nature10822. [DOI] [PMC free article] [PubMed] [Google Scholar]
- 49.McGourty CA, et al. Regulation of the CUL3 ubiquitin ligase by a calcium-dependent co-adaptor. Cell. 2016;167:525–538.e14. doi: 10.1016/j.cell.2016.09.026. [DOI] [PubMed] [Google Scholar]
- 50.Raote I, et al. TANGO1 assembles into rings around COPII coats at ER exit sites. J Cell Biol. 2017;216:901–909. doi: 10.1083/jcb.201608080. [DOI] [PMC free article] [PubMed] [Google Scholar]
- 51.Santos AJ, Raote I, Scarpa M, Brouwers N, Malhotra V. TANGO1 recruits ERGIC membranes to the endoplasmic reticulum for procollagen export. eLife. 2015;4:e10982. doi: 10.7554/eLife.10982. [DOI] [PMC free article] [PubMed] [Google Scholar]
- 52.Davis S, et al. Sec24 phosphorylation regulates autophagosome abundance during nutrient deprivation. eLife. 2016;5:e21167. doi: 10.7554/eLife.21167. [DOI] [PMC free article] [PubMed] [Google Scholar]
- 53.Gan W, et al. ULK1 phosphorylates Sec23A and mediates autophagy-induced inhibition of ER-to-Golgi traffic. BMC Cell Biol. 2017;18:22. doi: 10.1186/s12860-017-0138-8. [DOI] [PMC free article] [PubMed] [Google Scholar]
- 54.Lu Y, Kamel S, Veno P, Phillips CL, Dallas S. Visualization of collagen assembly dynamics and its integration with fibronectin assembly in living cells using novel GFP-collagen imaging probes. J Bone Miner Res. 2009;24:S80. [Google Scholar]
- 55.Sengupta P, et al. ER trapping reveals Golgi enzymes continually revisit the ER through a recycling pathway that controls Golgi organization. Proc Natl Acad Sci USA. 2015;112:E6752–E6761. doi: 10.1073/pnas.1520957112. [DOI] [PMC free article] [PubMed] [Google Scholar]
- 56.Hailey DW, et al. Mitochondria supply membranes for autophagosome biogenesis during starvation. Cell. 2010;141:656–667. doi: 10.1016/j.cell.2010.04.009. [DOI] [PMC free article] [PubMed] [Google Scholar]
- 57.Ritter AT, et al. Actin depletion initiates events leading to granule secretion at the immunological synapse. Immunity. 2015;42:864–876. doi: 10.1016/j.immuni.2015.04.013. [DOI] [PMC free article] [PubMed] [Google Scholar]
- 58.Dantuma NP, Groothuis TA, Salomons FA, Neefjes J. A dynamic ubiquitin equilibrium couples proteasomal activity to chromatin remodeling. J Cell Biol. 2006;173:19–26. doi: 10.1083/jcb.200510071. [DOI] [PMC free article] [PubMed] [Google Scholar]
- 59.Itakura E, Mizushima N. p62 targeting to the autophagosome formation site requires self-oligomerization but not LC3 binding. J Cell Biol. 2011;192:17–27. doi: 10.1083/jcb.201009067. [DOI] [PMC free article] [PubMed] [Google Scholar]
- 60.Grimm JB, et al. A general method to improve fluorophores for live-cell and single-molecule microscopy. Nat Methods. 2015;12:244–250. doi: 10.1038/nmeth.3256. [DOI] [PMC free article] [PubMed] [Google Scholar]
- 61.Grimm JB, Brown TA, English BP, Lionnet T, Lavis LD. Synthesis of Janelia Fluor HaloTag and SNAP-tag ligands and their use in cellular imaging experiments. Methods Mol Biol. 2017;1663:179–188. doi: 10.1007/978-1-4939-7265-4_15. [DOI] [PubMed] [Google Scholar]
- 62.Miura K, et al. 2014 ImageJ Plugin CorrectBleach V2.0.2. Available at https://zenodo.org/record/30769#.W5f8RhEnaM8.
- 63.Mirigian LS, Makareeva E, Leikin S. Pulse-chase analysis of procollagen biosynthesis by azidohomoalanine labeling. Connect Tissue Res. 2014;55:403–410. doi: 10.3109/03008207.2014.959120. [DOI] [PMC free article] [PubMed] [Google Scholar]
- 64.Dieterich DC, et al. Labeling, detection and identification of newly synthesized proteomes with bioorthogonal non-canonical amino-acid tagging. Nat Protoc. 2007;2:532–540. doi: 10.1038/nprot.2007.52. [DOI] [PubMed] [Google Scholar]
- 65.Dieterich DC, Link AJ, Graumann J, Tirrell DA, Schuman EM. Selective identification of newly synthesized proteins in mammalian cells using bioorthogonal noncanonical amino acid tagging (BONCAT) Proc Natl Acad Sci USA. 2006;103:9482–9487. doi: 10.1073/pnas.0601637103. [DOI] [PMC free article] [PubMed] [Google Scholar]
Associated Data
This section collects any data citations, data availability statements, or supplementary materials included in this article.


