

Abstract
Background and purpose
Many restorative therapies have been used to study brain repair after stroke. These therapeutic-induced changes have revealed important insights on brain repair and recovery mechanisms, however, the intrinsic changes that occur in spontaneously recovery after stroke is less clear. The goal of this study is to elucidate the intrinsic changes in spontaneous recovery after stroke, by directly investigating the transcriptome of primary motor cortex in mice that naturally recovered after stroke.
Methods
Male C57BL/6J mice were subjected to transient middle cerebral artery occlusion. Functional recovery was evaluated using the horizontal rotating beam test. A novel in-depth lesion mapping analysis was used to evaluate infarct size and locations. Ipsilesional and contralesional primary motor cortices (iM1 and cM1) were processed for RNA sequencing (RNA-seq) transcriptome analysis.
Results
Cluster analysis of the stroke mice behavior performance revealed two distinct recovery groups: a spontaneously recovered and a non-recovered group. Both groups showed similar lesion profile, despite their differential recovery outcome. RNA-seq transcriptome analysis revealed distinct biological pathways in the spontaneously-recovered stroke mice, in both iM1 and cM1. Correlation analysis revealed that 38 genes in the iM1 were significantly correlated with improved recovery, while 74 genes were correlated in the cM1. In particular, ingenuity pathway analysis highlighted the involvement of cyclic adenosine monophosphate (cAMP) signaling in the cM1, with selective reduction of adenosine receptor A2A (Adora2a), dopamine receptor D2 (Drd2) and phosphodiesterase 10A (Pde10a) expression in recovered mice. Interestingly, the expressions of these genes in cM1 were negatively correlated with behavioral recovery.
Conclusions
Our RNA-seq data revealed a panel of recovery-related genes in the motor cortex of spontaneously-recovered stroke mice and highlighted the involvement of contralesional cortex in spontaneous recovery, particularly Adora2a, Drd2 and Pde10a-mediated cAMP signaling pathway. Developing drugs targeting these candidates after stroke may provide beneficial recovery outcome.
Keywords: RNAseq, spontaneous recovery, stroke, transcriptome, motor cortex, contralesional
Introduction
Stroke is one of the leading causes of disability world-wide.1 Treatment for enhancing stroke recovery is limited and most survivors remain disabled with chronic impairments, especially in patients with severe initial deficit.2 Spontaneous recovery after stroke has been reported in both human and animal studies.3–8 The degree of recovery can be variable and depends on a number of factors, such as infarct size/locations, severity of initial stroke deficits, age and genetics.7 Extensive studies have characterized brain repair mechanisms after stroke, mostly focused on changes in the peri-infarct regions. These include neurogenesis, angiogenesis, gliogenesis, dendritic spine turnover, axonal sprouting, growth factor release and neuroinflammation.7,9–14 Increasing evidence using restorative treatments have also revealed how various pharmacological, cell transplantation, rehabilitation and brain stimulation treatments can enhance these repair mechanisms and promote recovery after stroke,13,15–17 providing important insights on post-stroke recovery mechanisms. In the recent years, there has been increased focus on changes beyond the peri-infarct regions, as stroke causes network-wide changes in the brain.18–20 Human and animal studies have reported functional and structural changes in the contralesional cortex, suggesting that stroke-connected brain regions such as contralesional cortex may be in involved in brain repair and recovery after stroke.
In this study, our goal is to elucidate the intrinsic mechanisms of spontaneous recovery after stroke without any external intervention. To achieve this, we directly investigated the molecular signature of mice that naturally recovered after stroke. By directly comparing the molecular responses between naturally recovered and non-recovered stroke mice, this unperturbed approach may reveal novel mechanisms that have been masked by studies using external restorative therapies. Our study is designed to 1) observe a natural, spontaneous recovery of function in mice after stroke; 2) use unbiased cluster analysis to determine the presence of distinct recovery groups; 3) conduct a novel in-depth lesion analysis to determine if the differential recovery outcome was related to lesion size/locations; 4) use next generation RNA sequencing (RNA-seq) technology to investigate the transcriptome of both iM1 and cM1 in recovered and non-recovered stroke mice. Understanding the intrinsic mechanisms driving spontaneous recovery will be invaluable for the development of drugs targeting these mechanisms to promote recovery after stroke.
Materials & Methods
Below are the main methods necessary to comprehend the results. Please see online-only Data Supplement for details. Data supporting the findings of this study are available from the corresponding author on reasonable request.
Animals
All animals used in this study were C57BL/6J wild-type male mice (11–13 weeks of age). To keep the consistency of same gender, female mice were not used in this discovery study. A total of 75 mice were used in this study, of which 33 stroke mice and 7 non-stroke sham mice were included for analysis (please see Figure I in the online-only Data Supplement for inclusion/exclusion criteria). All experiments were conducted in compliance with animal care laws and institutional guidelines and approved by the Stanford Institutional Animal Care and Use Committee. Mice were randomized and subjected to transient middle cerebral artery occlusion (MCAO) for 30 minutes. All behavior tests were performed by blinded observers on the day before stroke surgery and on post-stroke day (PD) 4, 8, and 14.
Semi-automated lesion analysis (MRI, histology)
A subset of stroke mice was scanned at PD2 using 7-Tesla MRI system. T2-weighted images (T2WI) were acquired and used to quantify the individual infarct volume. For histology, stroke mice were sacrificed at PD15 and processed for immunostaining to visualize infarct. Using our pipeline, MRI-based and immunostaining-based images were registered with the Allen brain reference mouse atlas (ARA) and lesion masks were overlaid with the corresponding ARA labels for quantification of infarct volume (MRI) or size (immunostaining).
RNA sequencing analysis
A subset of stroke mice was selected and their primary motor cortices (ipsilesional and contralesional) were processed for RNAseq transcriptome analysis using Hiseq 4000 (Illumina, Hayward, CA, USA). Raw sequences were processed for quality control, trimming (Trimmomatic version 0.36) and alignment (STAR/2.5.1b). Downstream analyses were performed using R (version 3.1.1), with edgeR and limma package with voom method. Differentially expressed genes (DEGs) were further analyzed by Ingenuity Pathway Analysis (IPA) software (QIAGEN) in order to provide the significant canonical pathway, diseases and functions. Quantitative PCR (qPCR) was used to validate the expression of candidate genes relative to sham group.
Statistical analysis
For the horizontal rotating beam data (distance and speed data), we performed unsupervised hierarchical clustering analysis (H-clustering) to determine presence of distinct clusters. In addition, gap-statistics (clusGap function in R) was used to estimate the number of clusters in all 33 stroke mice included for the analysis. Gap-statistics have been previously demonstrated to outperform other methods in estimating the number of clusters in a given dataset.21 For pathway analysis, statistical tests were performed by the IPA software using Fisher’s exact test. Prism 7.03 (GraphPad Software, Inc., La Jolla, CA, USA) was used to perform statistics for the following results. For the quantification of infarct size (% infarct-volume by T2WI or -area by histology) or infarct location (% infarct-volume or –area per region) data, we performed either two-tailed unpaired Student’s t-test or two-way Anova followed by Bonferroni’s post-hoc test. Spearman’s correlation analysis was used for 1) thalamic lesion and recovery; 2) RNA-seq based gene expression and recovery; 3) infarct size and recovery. For qPCR studies, one-way Anova followed by Bonferroni’s test was used to analyze relative gene expression level to non-stroke sham mice. Significance level was set at P<0.05.
Results
Cluster analysis of the horizontal rotating beam test revealed two distinct recovery groups
Following stroke, we observed the sensory-motor recovery using established behavior tests (see experimental timeline and design in Figure 1A). We chose the horizontal rotating beam test as the primary test because it has been previously demonstrated as a reliable and sensitive test for detecting long-term deficit after stroke.22,23 Distance data was used for cluster analysis, as it is the most fundamental and unbiased measure of the rotating beam test. We performed unsupervised hierarchical clustering analysis using the distance data from the horizontal beam test. Cluster analysis indicated the emergence of two distinct recovery groups at PD14 (Figure 1B): a spontaneously recovered group (n=9) and a non-recovered group (n=24) (Figure 1C and 1D). Non-stroke sham behavior data were included as a comparison. All subsequent analyses were performed based on this group separation, including body weight, vertical stationary beam test and mNS data (Figure II in the online-only Data Supplement).
Figure 1.
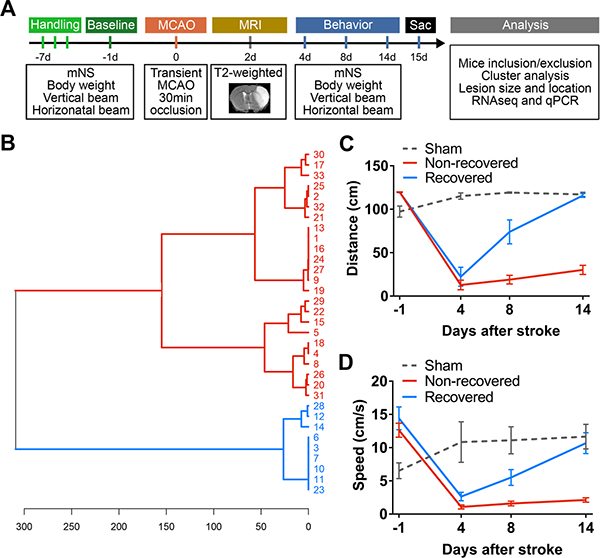
Hierarchical clustering shows two distinct recovery groups with differential functional outcome after stroke. A, Experimental design and timeline. Mice were trained with several behavior tests 1 week prior to stroke. These tests included the horizontal rotating beam test, vertical stationary beam test and modified neurological score (mNS). Baseline performance data were collected at 1 day before stroke (MCAO, transient middle cerebral artery occlusion) and functional recovery was evaluated at post-stroke days (PD) 1, 4, 8 and 14. T2-weighted MRI was acquired at PD 2 to visualize the infarct. Mice were sacrificed (sac) at PD 15 for analyses, including cluster analysis of behavior data, lesion profile, RNA-seq transcriptome and qPCR validations. B, Unsupervised hierarchical cluster dendrogram shows two distinct groups of stroke mice (distance metric: Euclidean (horizontal axis), linkage rule: Ward’s method, vertical axis indicates individual 33 mice IDs included for analysis), computed based on the rotating beam distance performance at PD 14. C-D, Based on this cluster separation, we graphed their rotating beam performance data in distance (C) and speed (D). Data were expressed as mean±SEM. (n=9 recovered, n=24 non-recovered, n=7 sham)
Infarct size and location did not differ between recovery and non-recovery groups
Next, we examined whether the differential recovery outcome between recovered and non-recovered groups were due to variations in the infarct size and/or location. Using a semi-automated in-depth lesion mapping analysis, we performed a comprehensive evaluation on the infarct size and location of the two recovery groups. Cerebral infarcts were visualized either by T2-weighted imaging (T2WI) at PD 2 (Figure 2) in 22 mice, or by histology at PD 15 by CD68 and MAP2 immunostaining (Figure 3) in the remaining 11 mice. T2WI sequence parameters were listed in Table I, online-only Data Supplement, and the co-registrations for MRI/histology to ARA were shown in Figure III, online-only Data Supplement. Our analysis indicated that there was no significant difference in % infarct volume (measured by T2WI on PD 2) (Figure 2B, P =0.533) or % infarct area (measured by histology at PD 15 at the striatal (Str) and thalamo-hippocampal (Hpx) levels between the groups (Figure 3B, P =0.794 Stx level, P =0.356 Hpx level), although the variation in sample size between the groups could mask any significance in the infarct volume. Overall the incidence of brain regions affected by stroke was similar between recovered and non-recovered, with a trend towards involvement of a larger portion of the medial thalamus in non-recovered (Figure 2C and 3C). However, in the voxel-wise analysis there was no significant difference in lesion location quantified by MRI or histology (Figure 2D and 3D). Nevertheless, we examined whether thalamic lesions can affect behavior outcome. Correlation analysis of thalamic lesions and behavior outcome showed that there was no significant correlation (Figure IV in the online-only Data Supplement). Furthermore, there was no significant correlation between infarct size at PD2 and recovery (Spearman r = −0.112, P =0.621), however, we found a trend of negative correlation between infarct size at PD15 and recovery (Spearman r = −0.545, P =0.086, Figure V in the online-only Data Supplement).
Figure 2.

MRI analysis of lesion volume and location in recovered and non-recovered mice at post-stroke day 2. A, Representative 3-dimensional (3-D) visualization of T2 weighted images with segmented stroke lesion masks (red) in the left panel, and 2-D coronal images in the right panel for both groups. Scale bar = 1mm. B, Bar graph demonstrates mean % infarct volume over whole brain volume. Data were expressed as mean±SEM with individual plots. (n=4 recovered, n=18 non-recovered). C, Voxel-wise incidence maps at the striatal and hippocampal levels were shown. Stroke lesion was expressed as color map (% of mice with stroke lesion) overlaid to the Allen brain reference mouse atlas (ARA). D, Semi-automated analysis of % infarct volume per representative ARA region for the quantitative comparison of the lesion location between groups. Data were expressed as mean±SEM. (n=4 recovered, n=18 non-recovered).
Figure 3.

Histological analysis of lesion size and location in recovered and non-recovered mice at post-stroke day (PD) 15. A, Representative coronal brain images of MAP2 (green) and CD68 (red) immunostaining at the striatal (Str) and thalamo-hippocampal (Hpx) levels from recovered and non-recovered mice at PD 15. Note that the CD68-positive area was predominantly overlaid on the MAP2-negative neuronal loss area in the merged images. Scale bar = 1 mm. B, Bar graph demonstrated the average % infarct area over the whole brain section area (mean±SEM). (n=5 recovered, n=6 non-recovered) C, Incidence maps at the striatal and hippocampal levels were shown. Stroke lesion was expressed as color map (% of mice with stroke lesion) overlaid to the Allen brain reference mouse atlas (ARA). D, Semi-automated quantification of % infarct area per selected region at Str (upper) and Hpx (lower) level, respectively. Data were expressed as mean±SEM. (n=5 recovered, n=6 non-recovered)
RNA-seq transcriptome analysis in recovered and non-recovered stroke mice
We analyzed the transcriptome of iM1 and cM1 in recovered and non-recovered stroke mice using RNA-seq. The rotating beam behavior results for the 8 stroke mice analyzed with RNA-seq were shown in Figure 4A (recovered, n=3; non-recovered, n=5). T2WI at PD 2 indicated that both groups exhibited comparable cerebral infarcts (Figure 4B left). For the RNA-seq study, mice were sacrificed at PD 15 and the iM1 and cM1 were dissected (Figure 4B right) and processed for RNA-seq. Unsupervised cluster analysis by multidimensional scaling plots of the transcriptome profile showed distinct cluster between iM1 and cM1 samples regardless of recovery outcome (Figure 4C left). Despite the lack of primary ischemic injury in iM1, the unsupervised transcriptome profiling indicated that the transcriptome profile of the primary motor cortex was predominantly affected by stroke.
Figure 4.
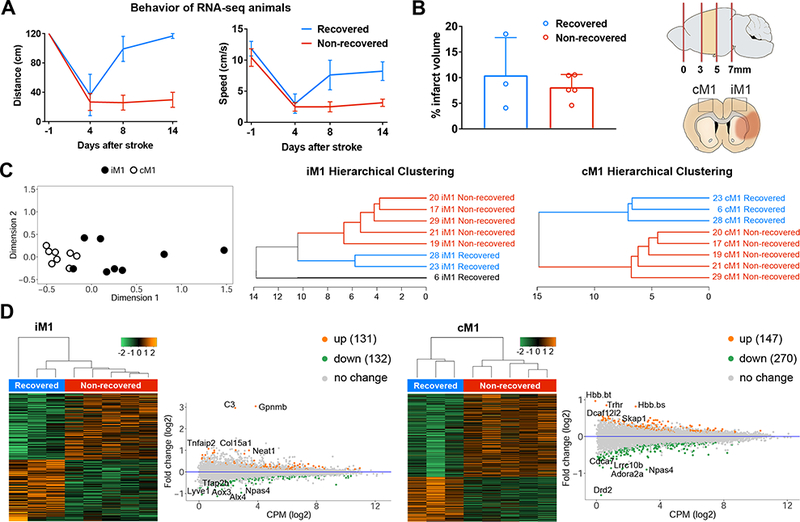
RNA-seq transcriptome analysis of iM1 and cM1 in recovered and non-recovered mice. A, Rotating beam results (distance and speed) for the mice used in RNA-seq analysis. B, Bar graph demonstrates mean % infarct volume over whole brain volume for these mice. Data were expressed as mean±SEM (n=3 recovered, n=5 non-recovered mice). Schematic diagram for the dissections of the brain cortical regions. Coronal brain image depicted cerebral infarct (orange colored). iM1 and cM1 were dissected and processed for RNA-seq analysis. C, Unsupervised multidimensional scaling plot for the iM1 and cM1 samples from both recovered and non-recovered mice (n = 3 and 5 mice, respectively) was shown on left. Supervised hierarchical clustering dendrograms of the differentially expressed genes (DEG, P<0.05) in the iM1 and cM1 were shown in the middle and right. D, Heat maps and MA plots (M = log ratio and A mean average) of transcriptome gene expressions in iM1 and cM1 samples from both groups, respectively. Orange and Green dots in the MA plots indicated top differentially up- and down-regulated genes (P<0.05) in recovered mice, respectively.
Supervised hierarchical clustering analysis of the iM1 and cM1 samples (imposed minimum threshold: P<0.05) showed distinct cluster separation in cM1 that corresponded to recovered and non-recovered group (Figure 4C right). However, cluster analysis of iM1 samples showed three groups (Figure 4C middle), despite similar cerebral infarct. Heat maps and the top up- and down-regulated genes in iM1 and cM1 were shown in Figure 4D, respectively. Differential transcriptome analysis revealed 263 differentially expressed genes (DEGs) in the iM1 (131 upregulated and 132 downregulated) (Figure 4D left) and 417 DEGs in the cM1 (147 upregulated and 270 downregulated) (Figure 4D right) in the recovered group. Top significant up- or downregulated genes in the iM1 or cM1 of the recovered group were highlighted in Figure 4D (See Table II in the online-only Data Supplement for the full gene name).
RNA-seq transcriptome analysis highlights distinct pathways in the contralesional motor cortex of recovered stroke mice
To further investigate the molecular mechanisms driving spontaneous recovery, we used Ingenuity Pathway Analysis (IPA) to analyze the DEGs in both iM1 and cM1 (imposed minimum threshold: P<0.05, absolute expression log fold change >0.26) and reported relevant canonical pathways, major diseases, molecular and cellular functions (Figure 5). Canonical pathways in the iM1 include the planar cell polarity (PCP) pathway, axonal guidance signaling and bone morphogenic protein (BMP) signaling. Major diseases, molecular and cellular functions in the iM1 include organismal injuries and abnormalities, cell death and survival, cellular growth and proliferation, cell development, cell signaling and behavior. Other significant canonical pathways in the iM1 include the adipogenesis pathway, transforming growth factor beta (TGF-B) signaling, complement system, p38 mitogen-activated protein kinase (MAPK) signaling, leukocyte extravasation signaling, cyclic adenosine monophosphate (cAMP)-mediated signaling and Wnt/Calcium (Ca+) signaling (Figure 5A).
Figure 5.
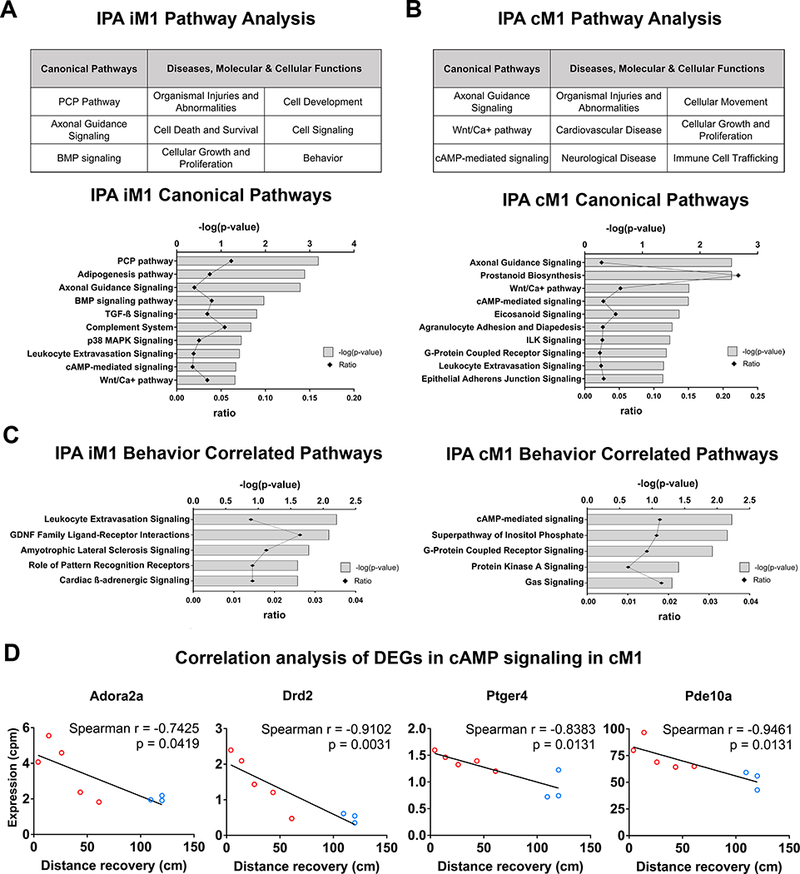
Ingenuity pathway analysis of RNA-seq transcriptome highlights the involvement of cAMP-mediated signaling in the cM1. A-B, Ingenuity Pathway Analysis (IPA) of differentially expressed genes (DEGs) in the (A) iM1 or (B) cM1 (upper tables) in recovered stroke mice indicated significant top canonical pathways and diseases, molecular/cellular functions. Bar graphs indicated significant top canonical pathways in (A) iM1 and (B) cM1 (lower graphs), plotted by P values (Fisher’s exact test) and ratio (number of genes in pathway). C, Bar graphs demonstrate significant top 5 relevant canonical pathways correlated with recovery in the iM1 (left) and cM1 (right). D, Scatter plots demonstrated significant negative correlations (Spearman) between gene expression levels (RNA-seq CPM based) of 4 DEGs in cAMP-mediated signaling in the cM1 (Aodra2a, Drd2, Ptger4, and Pde10a) and the behavior recovery outcome (rotating beam distance at post-stroke day 14). Each line depicted linear regression for each scatter plot (n=3 recovered, n=5 non-recovered mice).
Canonical pathways in the cM1 included axonal guidance signaling, Wnt/Ca+ pathway and cAMP-mediated signaling (Figure 5B). Major diseases and molecular and cellular functions in the cM1 include organismal injuries and abnormalities, cardiovascular disease, neurological disease, cellular movement, cellular growth and proliferation and immune cell trafficking. Other significant canonical pathways in the cM1 included prostanoid biosynthesis, eicosanoid signaling, agranulocyte adhesion and diapedesis, integrin-linked kinase (ILK) signaling, G protein-coupled receptor (GPCR) signaling, leukocyte extravasation signaling and epithelial adherens junction signaling (Figure 5B).
Genes in the cAMP-mediated signaling pathway are significantly correlated with recovery
To identify genes that may underlie spontaneous recovery, we examined which DEGs were correlated with recovery by performing correlation analysis between gene expression level (counts per million reported from RNA-seq analysis) of each DEG and behavior recovery outcome (distance data at PD 14 from the rotating beam test). Correlation analysis indicated that there were 38 DEGs in the iM1 and 74 DEGs in the cM1 correlated with recovery (See Table III and IV in the online-only Data Supplement). We focused our subsequent analysis in the cM1 because 1) more DEGs in cM1 were correlated with recovery and 2) more distinct separation was found in the supervised hierarchical clustering analysis of the cM1 samples instead of the iM1 samples. IPA analysis of the 74 DEGs in cM1 revealed cAMP-mediated signaling as the first top significant canonical pathway (Figure 5C right), with all 4 DEGs (Adora2a, Drd2, Pde10a, Ptger4) significantly down-regulated in recovered mice (Table IV in the online-only Data Supplement). These 4 DEGs were all significantly and negatively correlated with functional recovery (Figure 5D). Interestingly, cAMP-mediated signaling was also included in the top 10 relevant canonical pathways in the iM1 (Figure 5A). In iM1, there was no difference in Adora2a and Drd2 between recovered and non-recovered mice (P >0.10), whereas Pde10a expression was significantly decreased (log FC = −0.217, P = 0.015) and Ptger4 was significantly increased (log FC = 0.628, P = 0.033) in the recovered mice. Most of these 4 genes (except for Pde10a) in the iM1 were not significantly correlated with functional recovery.
qPCR verification of candidate genes in the cAMP signaling pathway
Next, we used quantitative real-time PCR (qPCR) to validate the 4 DEGs in the cAMP pathway in cM1. qPCR successfully validated 3 out of 4 genes in this pathway, namely Adora2a, Drd2 and Pde10a (Figure 6). Both Adora2a and Drd2 were significantly up-regulated in non-recovered stroke mice when compared to non-stroke sham mice. Interestingly, Adora2a, Drd2 and Pde10a were significantly reduced in recovered mice, to a level similar to sham. As Adora2a, Drd2 and Pde10a are known to be highly expressed in the striatum,24–26 we also examined their expression in the contralesional somatosensory cortex (cS) and striatum (cStr). Interestingly, all three genes were selectively decreased in the cM1 of recovered mice, but not in cS nor cStr (Figure 6).
Figure 6.
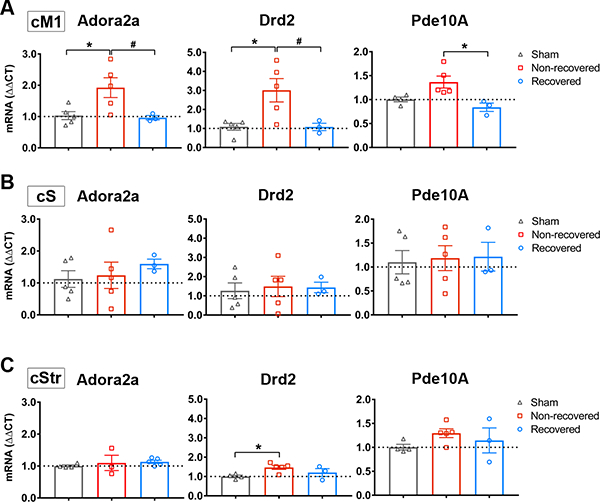
Adora2a, Drd2 and Pde10a were selectively decreased in cM1 of recovered mice. A-B, qPCR verification of Adora2a (A), Drd2 (B) and Pde10a (C) mRNA expression in recovered and non-recovered stroke mice and non-stroke sham mice in each region: cM1 (upper), cS1 (middle), and cStr (lower). Graphs indicated gene expression levels relative to sham group. GAPDH was used as reference gene. Data were expressed as mean ΔΔCT±SEM. The dotted horizontal line indicates ΔΔCT = 1.0. * P<0.05 One-way Anova, followed by Bonferroni’s test indicates a significant difference from sham (n=5), and # P<0.05 indicates a significant difference between recovered (n=3) and non-recovered group (n=5).
Discussion
To our knowledge, this is the first study to investigate the molecular signature in the motor cortex of stroke mice that naturally recovered without external intervention. By directly comparing the molecular responses between naturally recovered and non-recovered stroke mice, our approach may reveal novel molecular signature that have been masked by studies using external restorative treatments. Our data showed that stroke mice with comparable infarcts can exhibit differential functional recovery outcomes. RNA-seq transcriptome analysis revealed distinct biological pathways in both the iM1 and cM1 of recovered stroke mice. Our RNA-seq analysis showed that multiple pathways in the iM1 and cM1 are likely to be involved in mediating spontaneous recovery after stroke. Canonical pathways in the iM1 include the axonal guidance signaling, BMP signaling, TGF-B signaling, complement system, MAPK signaling, leukocyte extravasation signaling, cAMP-mediated signaling and Wnt/Calcium signaling (Figure 5). Most of these pathways in the iM1 are consistent with our knowledge of brain repair pathways after stroke and have been shown to have neuroprotective and neurodegenerative roles.27 Importantly, our RNAseq data revealed a panel of spontaneous recovery-related genes (Figure 4 and 5) and reported the involvement of novel biological pathways in cM1. In particular, the cAMP-mediated signaling pathway in the cM1 was highlighted (Figure 5C right), with the recovered stroke mice exhibiting a significantly lower expression of two GPCRs (Adora2a and Drd2) and Phosphodiesterase 10A (Pde10a), to a level similar to sham. Interestingly, the expression of these genes in the cM1 is negatively correlated with behavioral recovery. Our study suggests that Adora2a, Drd2 and Pde10a-mediated signaling may be important for spontaneous recovery after stroke.
To further hone in on the key molecules that mediate spontaneous recovery, we focused on DEGs that were significantly correlated with behavior performance. We have identified a panel of recovery-related genes in both iM1 and cM1 (See Table III and IV in the online-only Data Supplement). Notably, the cAMP-mediated pathway was the first top pathway highlighted in the cM1, with 4 DEGs (Adora2a, Drd2, Pde10a, Ptger4) significantly down-regulated in the recovered mice, and their expressions were negatively correlated with recovery (Figure 5C right and 5D). Of these 4 genes, we have successfully validated Adora2a, Drd2, Pde10a using qPCR (Figure 6). Interestingly these genes were selectively decreased in the cM1 of recovered stroke mice, but not in cS nor cStr. The functions of these genes are briefly discussed below.
Both Adora2a and Drd2 have been studied in acute stroke,28–31 however, their role in the brain repair and recovery is unclear, since there are no reports of its role in chronic stage of stroke. Adora2a is a Gs-protein coupled that activates the cAMP-mediated signaling pathway.32 It has been shown that blocking Adora2a signaling can protect against acute ischemic excitotoxicity, whereas activating Adora2a signaling within a few hours post-stroke can reduce inflammatory cell infiltration after stroke.28 On the other hand, Drd2 is a Gi protein-coupled receptor that inhibits cAMP-mediated signaling.33 The dopamine system plays a key role in motor learning and neuroplasticity.34,35 A recent study showed that activation of Drd2 on astrocytes in acute stroke can reduce neuroinflammation.31 However, the role of Drd2 in brain repair is also unclear. On the other hand, the role of Pde10a in stroke has not been reported. Recent studies showed that inhibition of Pde10a may be a promising therapeutic strategy for psychiatric and neurodegenerative diseases.36 Our RNA-seq analysis highlights these genes as potential targets for enhancing stroke recovery; however, the functional consequences of these genes will depend on which cell type showed reduction of these genes in recovered stroke mice, as well as the effects of selective modulations of their signaling in cM1 on recovery outcome. Future studies are required to elucidate the role of these genes in spontaneous recovery and to address whether they act through neuroinflammatory and/or neuroplasticity mechanisms.
In conclusion, we reported the first RNA-seq transcriptome in the motor cortex of stroke mice that naturally recovered and unraveled the intrinsic molecular signature of spontaneous recovery after stroke in mice. We revealed a panel of recovery-related genes and highlighted canonical pathways in the cM1 of recovered stroke mice, specifically the cAMP-mediated signaling pathway involving Adora2a, Drd2 and Pde10a. Our data indicate that Adora2a, Drd2, and Pde10a signaling in the cM1 may play important roles in stroke recovery. Developing drugs that target these candidates during different phases of recovery may provide beneficial recovery outcome in stroke patients.
Supplementary Material
Acknowledgments
We thank Drs. Brad Efron, John S. Tamaresis and Balasubramanian Narasimhan (Department of Statistics at Stanford University) for discussion on Gap-statistics cluster analysis. We also thank Anika Kim and Lorenzo Gonzalez for assistance in behavior studies and immunostaining. We thank Dr. Tonya Bliss for helpful discussions on the manuscript. We thank Cindy H. Samos for scientific editing of the manuscript.
Sources of funding
This work was supported in part by NIH NINDS grants R21NS082894 and R01NS093057, Russell and Elizabeth Siegelman, and Bernard and Ronni Lacroute (to GKS); partly supported by R01NS095985 and R01 MH111444 (to JAM), NIH S10 Shared Instrumentation Grant (S10RR026917–01 to Michael Moseley); and postdoctoral fellowships from the Japan Society for the Promotion of Science and the SENSHIN Medical Research Foundation (to MI) and the Max Kade Foundation (to MA). Dr. Steinberg is a consultant for Qool Therapeutics, Peter Lazic US, Inc., and NeuroSave.
Footnotes
Disclosures
None.
REFERENCES
- 1.Feigin VL, Forouzanfar MH, Krishnamurthi R, Mensah GA, Connor M, Bennett DA, et al. Global and regional burden of stroke during 1990–2010: Findings from the Global Burden of Disease Study 2010. Lancet. 2014;383:245–255. [DOI] [PMC free article] [PubMed] [Google Scholar]
- 2.Cramer SC, Wolf SL, Adams HP, Chen D, Dromerick AW, Dunning K, et al. Stroke Recovery and Rehabilitation Research: Issues, Opportunities, and the National Institutes of Health StrokeNet. Stroke. 2017;48:813–819. [DOI] [PMC free article] [PubMed] [Google Scholar]
- 3.Ward NS. Mechanisms underlying recovery of motor function after stroke. Postgrad.Med J 2005;81:510–514. [DOI] [PMC free article] [PubMed] [Google Scholar]
- 4.Ward NS. Restoring brain function after stroke bridging the gap between animals and humans. Nat. Rev. Neurol 2017;13:244–255. [DOI] [PubMed] [Google Scholar]
- 5.Rothrock JF, Clark WM, Lyden PD. Spontaneous Early Improvement Following Ischemic Stroke. Stroke. 1995;26:1358–1360. [DOI] [PubMed] [Google Scholar]
- 6.Whishaw IQ. Loss of the innate cortical engram for action patterns used in skilled reaching and the development of behavioral compensation following motor cortex lesions in the rat. Neuropharmacology. 2000;39:788–805. [DOI] [PubMed] [Google Scholar]
- 7.Cramer SC. Repairing the human brain after stroke: I. Mechanisms of spontaneous recovery. Ann. Neurol 2008;63:272–287. [DOI] [PubMed] [Google Scholar]
- 8.Cassidy JM, Cramer SC. Spontaneous and Therapeutic-Induced Mechanisms of Functional Recovery After Stroke. Transl. Stroke Res 2017;8:33–46. [DOI] [PMC free article] [PubMed] [Google Scholar]
- 9.Liu XS, Zhang ZG, Zhang RL, Gregg S, Morris DC, Wang Y, et al. Stroke induces gene profile changes associated with neurogenesis and angiogenesis in adult subventricular zone progenitor cells. J. Cereb. Blood Flow Metab 2007;27:564–574. [DOI] [PubMed] [Google Scholar]
- 10.Brown CE, Li P, Boyd JD, Delaney KR, Murphy TH. Extensive Turnover of Dendritic Spines and Vascular Remodeling in Cortical Tissues Recovering from Stroke. J. Neurosci 2007;27:4101–4109. [DOI] [PMC free article] [PubMed] [Google Scholar]
- 11.Carmichael ST, Archibeque I, Luke L, Nolan T, Momiy J, Li S. Growth-associated gene expression after stroke: Evidence for a growth-promoting region in peri-infarct cortex. Exp. Neurol 2005;193:291–311. [DOI] [PubMed] [Google Scholar]
- 12.Carmichael ST, Kathirvelu B, Schweppe CA, Nie EH. Molecular, cellular and functional events in axonal sprouting after stroke. Exp. Neurol 2017;287:384–394. [DOI] [PMC free article] [PubMed] [Google Scholar]
- 13.Rehabilitation Caleo M. and plasticity following stroke: Insights from rodent models. Neuroscience. 2015;311:180–194. [DOI] [PubMed] [Google Scholar]
- 14.Madinier A, Bertrand N, Rodier M, Quirié A, Mossiat C, Prigent-Tessier A, et al. Ipsilateral versus contralateral spontaneous post-stroke neuroplastic changes: Involvement of BDNF? Neuroscience. 2013;231:169–181. [DOI] [PubMed] [Google Scholar]
- 15.George PM, Steinberg GK. Novel Stroke Therapeutics: Unraveling Stroke Pathophysiology and Its Impact on Clinical Treatments. Neuron. 2015;87:297–309. [DOI] [PMC free article] [PubMed] [Google Scholar]
- 16.Webster BR, Celnik PA, Cohen LG. Noninvasive Brain Stimulation in Stroke Rehabilitation. NeuroRx. 2006;3:474–481. [DOI] [PMC free article] [PubMed] [Google Scholar]
- 17.Barone FC. Post-stroke pharmacological intervention: Promoting brain recovery from injury in the future. Neuropharmacology. 2010;59:650–653. [DOI] [PubMed] [Google Scholar]
- 18.Silasi G, Murphy TH. Stroke and the connectome: How connectivity guides therapeutic intervention. Neuron. 2014;83:1354–1368. [DOI] [PubMed] [Google Scholar]
- 19.Grefkes C, Fink GR. Reorganization of cerebral networks after stroke: New insights from neuroimaging with connectivity approaches. Brain. 2011;134:1264–1276. [DOI] [PMC free article] [PubMed] [Google Scholar]
- 20.Lim DH, LeDue JM, Mohajerani MH, Murphy TH. Optogenetic Mapping after Stroke Reveals Network-Wide Scaling of Functional Connections and Heterogeneous Recovery of the Peri-Infarct. J. Neurosci 2014;34:16455–16466. [DOI] [PMC free article] [PubMed] [Google Scholar]
- 21.Tibshirani R, Walther G, Hastie T. Estimating the number of clusters in a data set via the gap statistic. J. R. Stat. Soc. Ser. B (Statistical Methodol 2001;63:411–423. [Google Scholar]
- 22.Cheng MY, Wang EH, Woodson WJ, Wang S, Sun G, Lee AG, et al. Optogenetic neuronal stimulation promotes functional recovery after stroke. Proc. Natl. Acad. Sci 2014;111:12913–12918. [DOI] [PMC free article] [PubMed] [Google Scholar]
- 23.Shah AM, Ishizaka S, Cheng MY, Wang EH, Bautista AR, Levy S, et al. Optogenetic neuronal stimulation of the lateral cerebellar nucleus promotes persistent functional recovery after stroke. Sci. Rep 2017;7:46612. [DOI] [PMC free article] [PubMed] [Google Scholar]
- 24.Svenningsson P, Le Moine C, Fisone G, Fredholm BB. Distribution, biochemistry and function of striatal adenosine A(2A) receptors. Prog. Neurobiol 1999;59:355–396. [DOI] [PubMed] [Google Scholar]
- 25.Pignatelli M, Bonci A. Role of Dopamine Neurons in Reward and Aversion: A Synaptic Plasticity Perspective. Neuron. 2015;86:1145–1157. [DOI] [PubMed] [Google Scholar]
- 26.Xie Z, Adamowicz WO, Eldred WD, Jakowski AB, Kleiman RJ, Morton DG, et al. Cellular and subcellular localization of PDE10A, a striatum-enriched phosphodiesterase. Neuroscience. 2006;139:597–607. [DOI] [PMC free article] [PubMed] [Google Scholar]
- 27.Harvey BK, Hoffer BJ, Wang Y. Stroke and TGF-β proteins: glial cell line-derived neurotrophic factor and bone morphogenetic protein. Pharmacol. Ther 2005;105:113–125. [DOI] [PubMed] [Google Scholar]
- 28.Pedata F, Pugliese AM, Coppi E, Dettori I, Maraula G, Cellai L, et al. Adenosine A 2A receptors modulate acute injury and neuroinflammation in brain ischemia. Mediators Inflamm. 2014;2014:805198. [DOI] [PMC free article] [PubMed] [Google Scholar]
- 29.Melani A, Pugliese AM, Pedata F. Adenosine Receptors in Cerebral Ischemia. Int. Rev. Neurobiol 2014;119:309–348. [DOI] [PubMed] [Google Scholar]
- 30.Chen JF, Huang Z, Ma J, Zhu J, Moratalla R, Standaert D, et al. A2A adenosine receptor deficiency attenuates brain injury induced by transient focal ischemia in mice. J. Neurosci 1999;19:9192–9200. [DOI] [PMC free article] [PubMed] [Google Scholar]
- 31.Qiu J, Yan Z, Tao K, Li Y, Li Y, Li J, et al. Sinomenine activates astrocytic dopamine D2 receptors and alleviates neuroinflammatory injury via the CRYAB/STAT3 pathway after ischemic stroke in mice. J. Neuroinflammation 2016;13:263. [DOI] [PMC free article] [PubMed] [Google Scholar]
- 32.Dai SS, Zhou YG. Adenosine 2A receptor: A crucial neuromodulator with bidirectional effect in neuroinflammation and brain injury. Rev. Neurosci 2011;22:231–239. [DOI] [PubMed] [Google Scholar]
- 33.Montmayeur JP, Guiramand J, Borrelli E. Preferential coupling between dopamine D2 receptors and G-proteins. Mol. Endocrinol 1993;7:161–170. [DOI] [PubMed] [Google Scholar]
- 34.Hosp JA, Luft AR. Dopaminergic meso-cortical projections to M1: Role in motor learning and motor cortex plasticity. Front. Neurol 2013;4:145. [DOI] [PMC free article] [PubMed] [Google Scholar]
- 35.Cramer SC. Drugs to Enhance Motor Recovery After Stroke. Stroke. 2015;46:2998–3005. [DOI] [PMC free article] [PubMed] [Google Scholar]
- 36.Zagorska A, Partyka A, Bucki A, Gawalska A, Czopek A, Pawlowski M. Phosphodiesterase 10 Inhibitors – Novel Perspectives for Psychiatric and Neurodegenerative Drug Discovery. Curr. Med. Chem 2018;25. [DOI] [PubMed] [Google Scholar]
Associated Data
This section collects any data citations, data availability statements, or supplementary materials included in this article.