Abstract
Recently, toxicants such as formaldehyde and acrolein were detected in electronic cigarette (EC) aerosols. It is imperative to conduct research and provide sufficient quantitative evidence to address the associated potential health risks. However, it is still a lack of informative data, i.e., high-resolution local dosimetry of inhaled aerosols in lung airways and other systemic regions, due to the limited imaging resolutions, restricted operational flexibilities, and invasive nature of experimental and clinical studies. In this study, an experimentally validated multiscale numerical model, i.e., Computational Fluid-Particle Dynamics (CFPD) model combined with a Physiologically Based Toxicokinetic (PBTK) model is developed to predict the systemic translocation of nicotine and acrolein in the human body after the deposition in the respiratory system. In-silico parametric analysis is performed for puff topography influence on the deposition and translocation of nicotine and acrolein in human respiratory systems and the systemic region. Results indicate that the puff volume and holding time can contribute to the variations of the nicotine and acrolein plasma concentration due to enhanced aerosol deposition in the lung. The change in the holding time has resulted in significant difference in the chemical translocation which was neglected in a large group of experimental studies. The capability of simulating multiple puffs of the new CFPD-PBTK model paves the way to a valuable computational simulation tool for assessing the chronic health effects of inhaled EC toxicants.
Keywords: Electronic Cigarettes (ECs), Computational Fluid-Particle Dynamics (CFPD), Physiologically Based Toxicokinetic Model (PBTK), Nicotine, Acrolein, Puffing Topography
1. Introduction
Electronic cigarettes (ECs), perceived as the safer alternatives to conventional cigarettes, are manufactured in a wide variety of device designs with widely varying nicotine concentrations, added flavors, and glycerol (VG), as well as propylene glycol (PG) to imitate smoke via vaporization instead of combustion (Allen et al., 2016). However, studies also claimed that some e-cigarette products have immediate adverse physiological effects after short-term use, e.g., an increase in impedance, peripheral airway flow resistance, and oxidative stress among healthy smokers who used an e-cigarette for 5 minutes (Alfi & Talbot, 2013), while the long-term health effects are still unknown and worthy of further investigations. Recently, toxicants such as formaldehyde, acetaldehyde, acrolein, diacetyl, benzaldehyde, and vanillin were also detected in e-cigarette aerosols (Goniewicz, Hajek, & McRobbie, 2014; Allen et al., 2016; Flora et al., 2017).These toxicants are either generated by the low-level thermal degradation or exist in flavorings. Because of the potential health impact of the newly discovered chemical compounds listed above (Alarcon, 1976; De Woskin, Greenberg, Pepelko, & Strickland, 2003; Wang et al., 2008; Mishra et al., 2015; Morris et al., 2015; Abraham et al., 2011), it is imperative to conduct research and provide sufficient quantitative evidence to address the potential health risks for the optimization of e-cigarette product design or facilitate regulatory approval. Thus, it is critical to define reliable biomarkers and understand how those chemical compounds transport, translocate and accumulate in the human body. However, it is still a lack of informative data, i.e., high-resolution local dosimetry of inhaled aerosols in lung airways and other systemic regions. The knowledge and data gap are mainly due to the limited imaging resolutions, restricted operational flexibilities, and invasive nature of experimental and clinical studies. Indeed, since ECs have not been in widespread use sufficiently long, the human exposure studies until now are limited to very short-term health responses. Meanwhile, although animal studies were performed to investigate the health effects on mice and rats due to the exposure to EC aerosols, observations are very restrictive regarding imaging resolution and operational flexibility (Morris, 2012).
As an alternative, in-silico study using high-fidelity numerical methods, i.e., Computational Fluid-Particle Dynamics (CFPD) plus Physiologically Based Toxicokinetic (PBTK) model (see Fig. 1), are capable of providing valuable dosimetry data of multicomponent EC aerosols in subject-specific respiratory tracts (Chen, Feng, Zhong, & Kleinstreuer, 2017; Haghnegahdar and Feng, 2017; Kleinstreuer & Feng, 2013). Furthermore, a high-quality CFPD-PBTK model is also a promising whole-body dosimetry prediction tool, which is noninvasive, cost-effective, and time-saving compared to in-vitro and in-vivo investigations. Compared to those lumped parameter approaches and semi-empirical models, the CFPD-PBTK model is developed based on the natural law of physics and chemistry with fewer assumptions and simplifications. Thus, an advanced noninvasive, reliable, and generalized engineering tool based on the multiscale CFPD-PBTK framework is developed and employed in this study to analyze the comparative health risk reductions of EC aerosol components, i.e., nicotine and acrolein, with different puffing topographies. This in-silico study has relevance to public health because it will enable a major health question to be answered by simulations in a short period, i.e., what is the relationship between the chronic passive e-cigarette vaping of adolescents and their health risks. The integration of multiple disciplinary types of research will bridge the gap of EC aerosol exposure and cardiopulmonary health effect assessments, leading ultimately to a better understanding of the complexity and dynamics of EC aerosol transport, deposition and translocation in human bodies.
Figure 1:
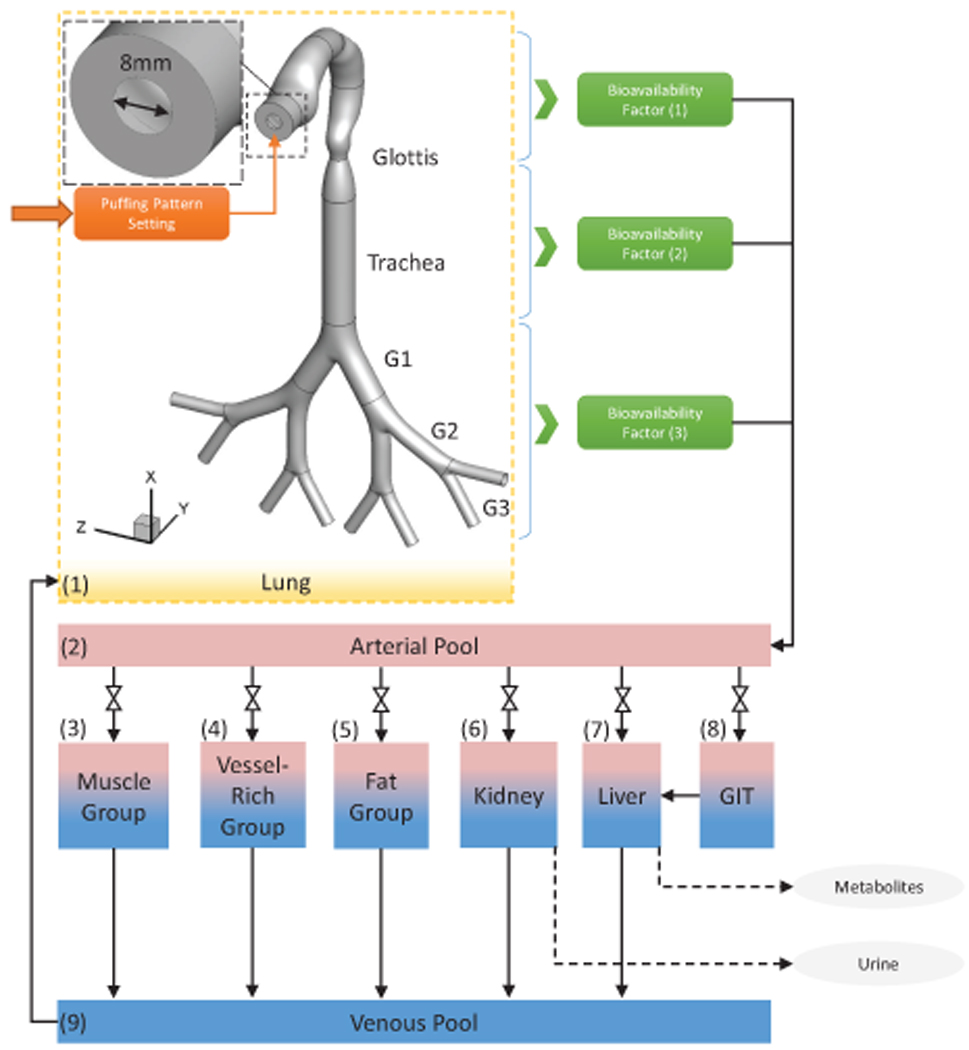
Framework of the CFPD-PBTK model.
Efforts have been made towards the development of numerical models to predict the fates of inhaled tobacco products. The necessary approaches to have a reliable model that can represent the essential governing physics are presented in the review by Kleinstreuer and Feng (2013). Simulations of the EC generated aerosol with the multipath particle deposition model (MMPD) approach developed by Manigrasso, Buonanno, Fuoco, Stabile, and Avino (2015). The connection of the CFPD and the PBTK demands additional description that can present the rule of the interconnecting tissue layer. Kimbell, Gross, Joyner, Godo, and Morgan (1993) has completed the single-phase formaldehyde transport in Fisher rat nasal cavity. In this work, the complete water solubility of the formaldehyde led them to consider the zero concentration condition at the airway walls, and consequently, the diffusion process was uncoupled from those in the surrounding tissues. Deposition and mucosa layer translocation of vapor in the nasal cavity with hybrid CFD-PBTK simulations were studied by Morris, Hassett, and Blanchard (1993). Bush, Frederick, Kimbell, and Ultman (1998) simulated non-reactive vapors uptake in the rat nasal cavity by including compartmental designs for respired air, the mucus layer, the epithelial cell layer, and the sub-epithelial layer containing blood vessels. Corley et al. (2012 & 2015) have reported the connected CFD and PBTK model for a single vapor phase deposition of the cigarette constituent in the respiratory system of the three systems of rat, monkey, and human considering mucus, epithelial, and submucosal layers with diffusion and associated reactions.
In this paper, the new multiscale CFPD-PBTK model is developed and employed to predict the local fates of nicotine and acrolein from entering the human upper airways to the systemic region. Since EC aerosol composition generated varies due to different puffing behaviors and EC products (Lisko, Tran, Stanfill, Blount, & Watson, 2015). Hence, the parametric analysis of puff pattern influence on transport and translocation dynamics is performed for individualized health risk assessments. EC Puffing topographies were selected as inlet conditions based on existing investigations and standards (Cobb, Byron, Abrams, and Shields, 2010; Goniewicz, Hajek, and McRobbie, 2014; Goniewicz et al., 2017; Shahab et al., 2017). Simulations of multiple puffs with holdings are enabled and performed for the first time using the CFPD-PBTK model.
The layout of this paper is as follows: Section 2 introduces the framework of the multiscale CFPD-PBTK model; Section 3 contains the numerical results of multi-component EC aerosol transport, deposition, and translocation with insightful discussion and parametric analysis. Section 4 summarizes the findings of the present study. Section 5 proposes future work to improve the generalized feasibility of the CFPD-PBTK modeling framework. Numerical setup, mesh independence tests, model validations, and the limitations of this study are provided as the supplemental information (SI).
2. Methodology
Governed by the conservation laws of nature, the Computational Fluid-Particle Dynamics (CFPD) and Physiologically Based Toxicokinetic (PBTK) model is a promising tool to assess the chronic exposure risks of EC aerosols and provide informative and high-resolution data promptly. The schematic of the CFPD-PBTK modeling framework is shown in Figure 1. Integrating the multiscale model validations and optimizations, the CFPD-PBTK model provides local information about how different levels of puffing may affect the deposition and translocation of toxicants in both lung and systemic regions. The CFPD model is developed based on Euler-Lagrange scheme (Feng, Kleinstreuer, Castro, & Rostami, 2016) specifically for multi-component EC aerosol dynamics in an idealized human upper airway model from mouth to Generation 3 (G3). The existence of the dominant chemicals of the nicotine, acrolein, formaldehyde, vegetable glycerin (VG), and propylene glycol (PG) are tracked both in the particle and vapor forms. Also, the wall of the respiratory system is considered as a sink with fractional to complete absorption for the uptake of the chemicals into the systemic region. The PBTK model for inhaled toxicants is developed and validated. It is assumed that the toxicant`s distribution through blood flow with the biological structure of tissues which are homogeneous rate-limited diffusion (Robinson, Balter, & Schwartz, 1992). The important mechanisms including absorption, distribution, metabolism, and excretion in each organ for each toxicant are considered. Physiologic parameters (cardiac output, ventilation rate, blood flow rate to the organs and organ volumes) are obtained and optimized accordingly. The system of governing equations and boundary conditions are provided in the Supplemental Information (SI).
3. Results and Discussion
3.1. EC Particle Transport and Deposition
The translocation of the EC toxicants including acrolein and nicotine are numerically investigated in the idealized human upper airway model. Three realistic puffing inlet conditions are applied (see SI for details). As shown in Figures 2 to 7, the local EC particle deposition patterns are significantly influenced by airflow regime determined by the average puff flow rate. Moreover, after the puffing duration, the holding time will result in increased deposition due to Brownian motion and the gravity sedimentation effects. The transient local airflow patterns with secondary flows and recirculation regions are shown in Figures 2 and 3. Specifically, Figures 2 (a)–(j) show the airflow pattern transition at the sagittal plane and frontal plane by visualizing velocity magnitudes at different time steps. It can be observed from Figures 2 (a)–(d) that a jet flow is evolved from the EC mouthpiece at the beginning of the puff. At t=0.3 s, the high-velocity jet impacts the lower palate forms the recirculation region in the oral cavity, and deviate the path towards pharynx and trachea. At t=0.40 s the inlet jet is completely formed in the oral cavity and the pharynx (see Figure 2 (e)) and the second recirculation region at the front side of the pharynx is formed due to the centrifugal effects of the mainstream flow. At t=0.50 s, the high-velocity jet reaches the trachea region. The third recirculation is formed at the back of the trachea due to the pressure variations induced by the glottis. Due to the small particle size, most particles will follow the high-velocity jet and have small chance to enter the recirculation regions. However, there is a small portion of the particles, which can enter the recirculation region. Those particles will have longer residence time and higher change to deposit induced by Brownian motion effects. It should be noted that the backflow will increase the residence time of particles entering the recirculating regions, while reducing the local deposition avoid direct impaction of the particles carried by the mainstream flow (see Figure 3).
Figure 2:
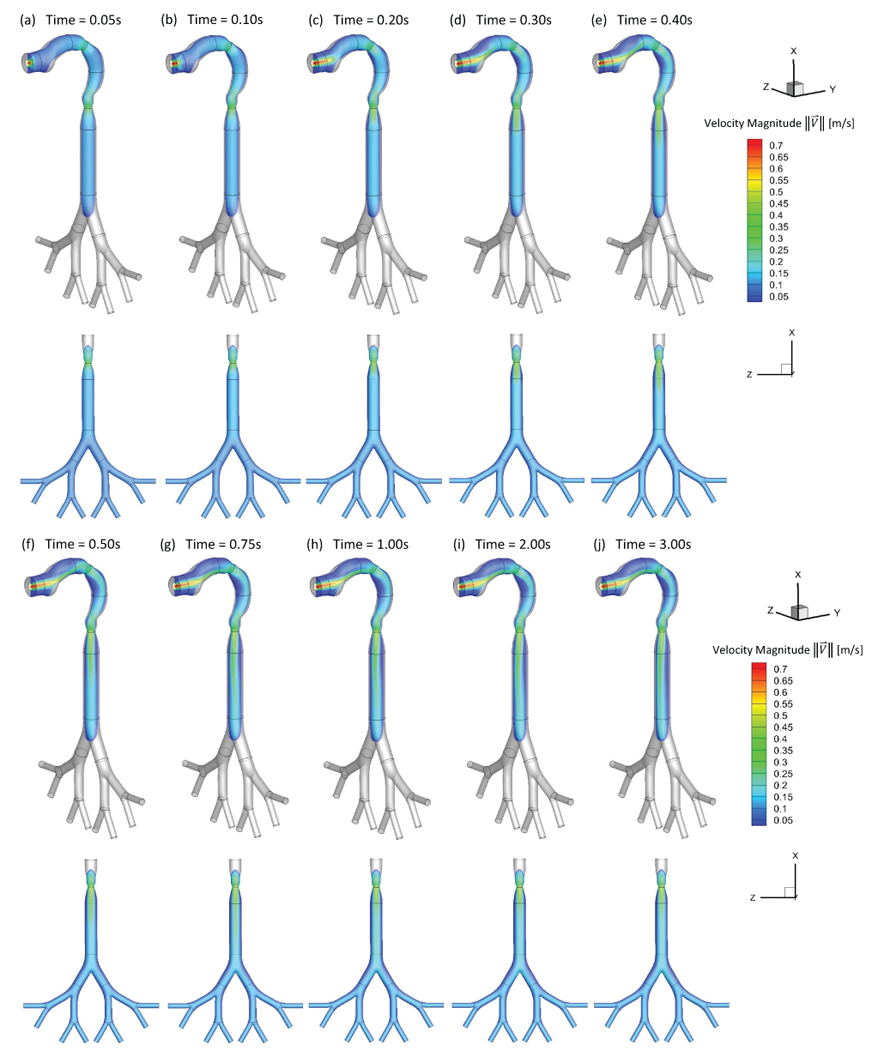
Transient airflow patterns in the idealized human upper airway model (Qin=55 ml per 3.0 s): (a) t=0.05 s; (b) t=0.10 s; (c) t=0.20 s; (d) t=0.30 s; (e) t=0.40 s; (f) t=0.50 s; (g) t=0.75 s; (h) t=1.00 s; (i) t=2.00 s; (j) t=3.00 s.
Figure 7:
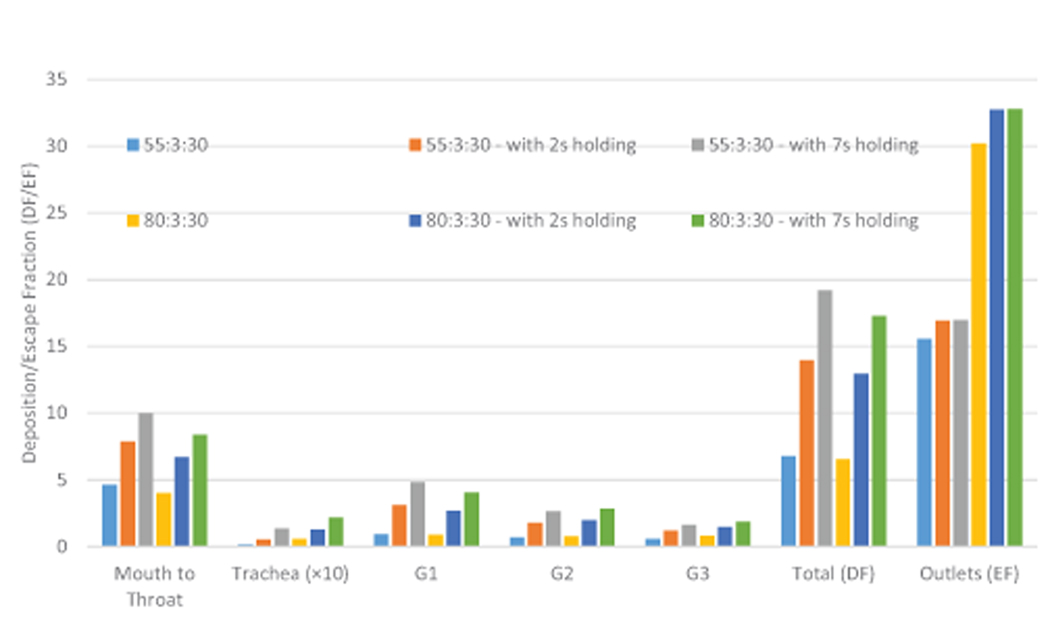
Comparisons of EC particle deposition fractions in the idealized human upper airway model.
Figure 3:
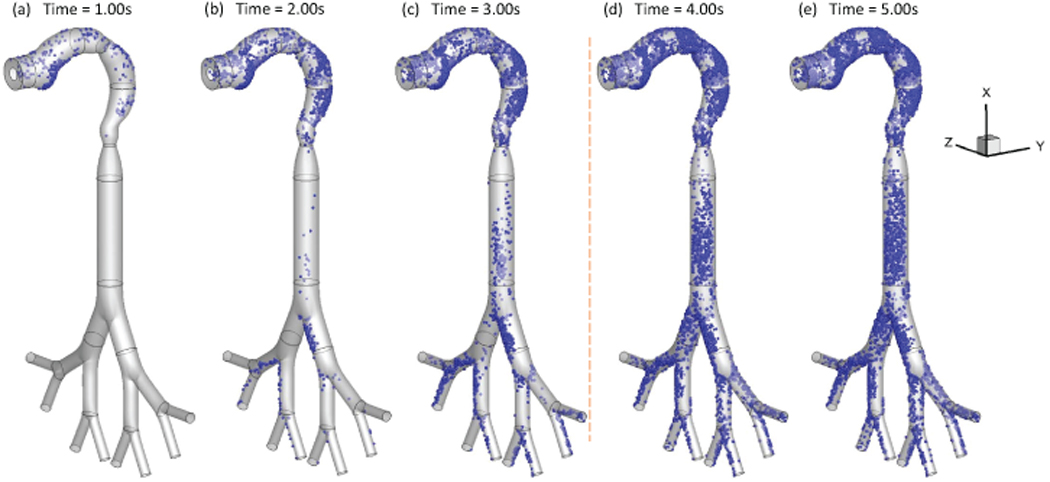
Local deposition patterns of EC particles (Qin=55 ml per 3.0 s with 2-second holding): (a) t=1.0 s; (b) t=2.0 s; (c) t=3.0 s; (d) t=4.0 s; (e) t=5.0 s
Additionally, Figures 3 (a)–(e) show the transient local deposition patterns of EC particles. The deposition of the particles at t=1.0 s, 2.0 s, and 3.0 s followed by 1.0 s and 2.0 s holdings are provided. Low deposition efficiencies (DEs) at the airway walls covered by recirculation regions. Enhanced local deposition efficiencies (LDEs) are found at the lower palate, pharynx, and bifurcating points because of inertial impaction and gravitational sedimentation. Figures 3 (d) and (e) demonstrate that particles continue to deposit at lung airways during the holding phase. Increased holding time will result in higher depositions. Therefore, it is necessary to simulate the holding duration to obtain accurate particle deposition patterns for EC vaping and passive exposure.
3.2. EC Vapor Species Transport and Absorption
As an example, Figures 4 and 5 show the mass fraction contour evolution of acrolein and nicotine vapors at the sagittal plane for puff volume of 55 ml. After being inhaled, acrolein and nicotine vapors follow the airflow well to transport from the oral cavity to the tracheobronchial region gradually. Due to the high diffusion rates of both vapors into the airway tissues, most of the acrolein (99%) and nicotine (99%) in vapor forms are absorbed before reaching the glottis (see SI for the binary diffusivities). Therefore, the translocation of both vapor species into the blood circulation happens at human upper airways.
Figure 4:
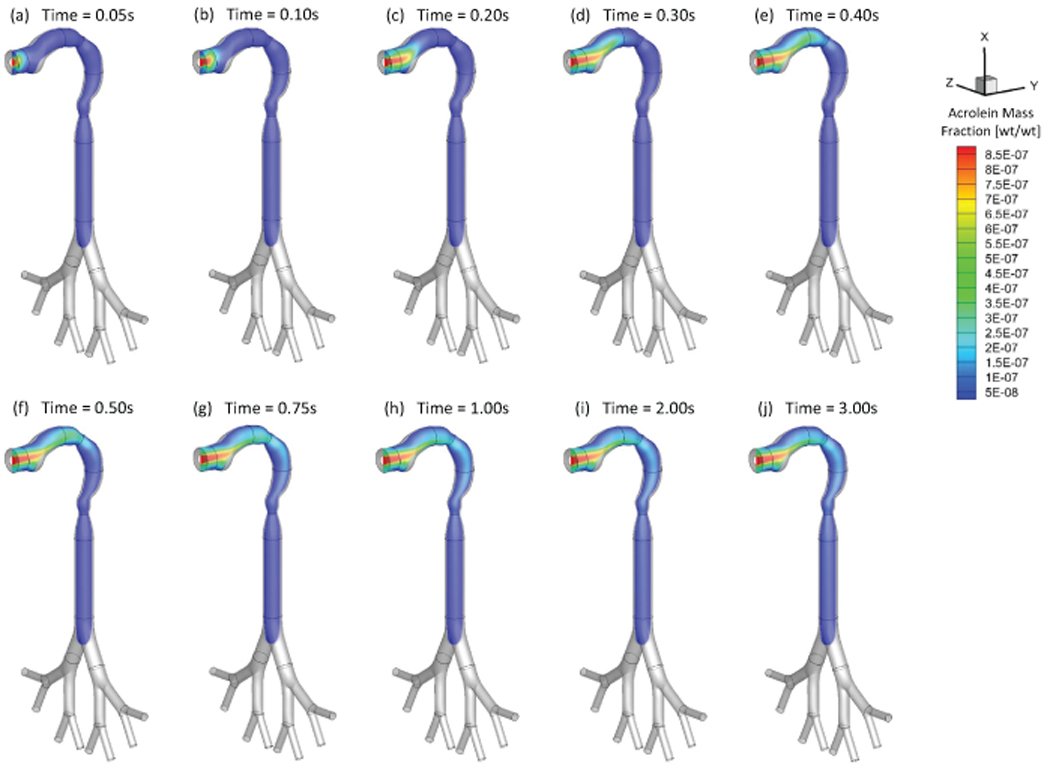
Mass fraction distribution of acrolein vapor at different (Qin=55 ml per 3.0 s): (a) t=0.05 s; (b) t=0.10 s; (c) t=0.20 s; (d) t=0.30 s; (e) t=0.40 s; (f) t=0.50 s; (g) t=0.75 s; (h) t=1.00 s; (i) t=2.00 s; (j) t=3.00 s.
Figure 5:
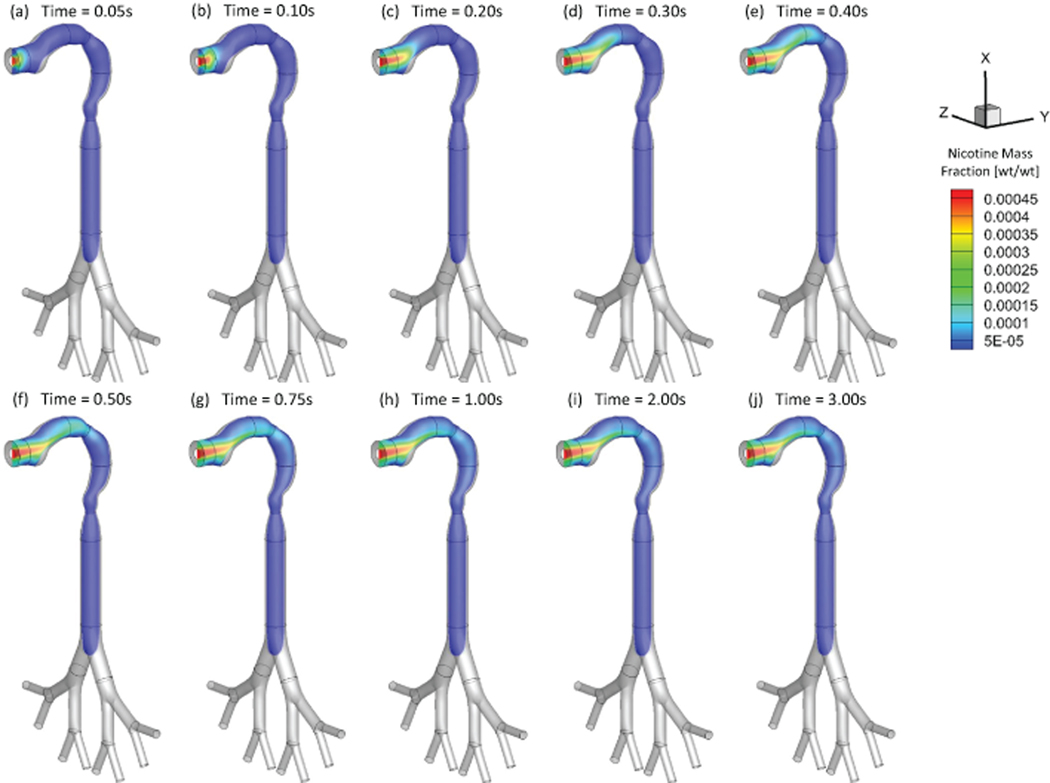
Mass fraction distribution of nicotine vapor at different (Qin=55 ml per 3.0 s): (a) t=0.05 s; (b) t=0.10 s; (c) t=0.20 s; (d) t=0.30 s; (e) t=0.40 s; (f) t=0.50 s; (g) t=0.75 s; (h) t=1.00 s; (i) t=2.00 s; (j) t=3.00 s.
3.3. Puff Topography Influence on EC Aerosol Transport Dynamics
The impact of puff topography on EC aerosol transport and deposition were investigated and shown in Figures 6 and 7. As shown in Figure 6 for two puff volumes, most particles deposit on the mouth to glottis region for both inlet puffing volumes. Higher puffing flow rate induce longer residence time of particles in G1 to G3, leading to higher deposition due to inertial impaction. “Hot spots” of particle deposition include lower palate, pharynx, glottis, and bifurcating points of each generation.
Figure 6:
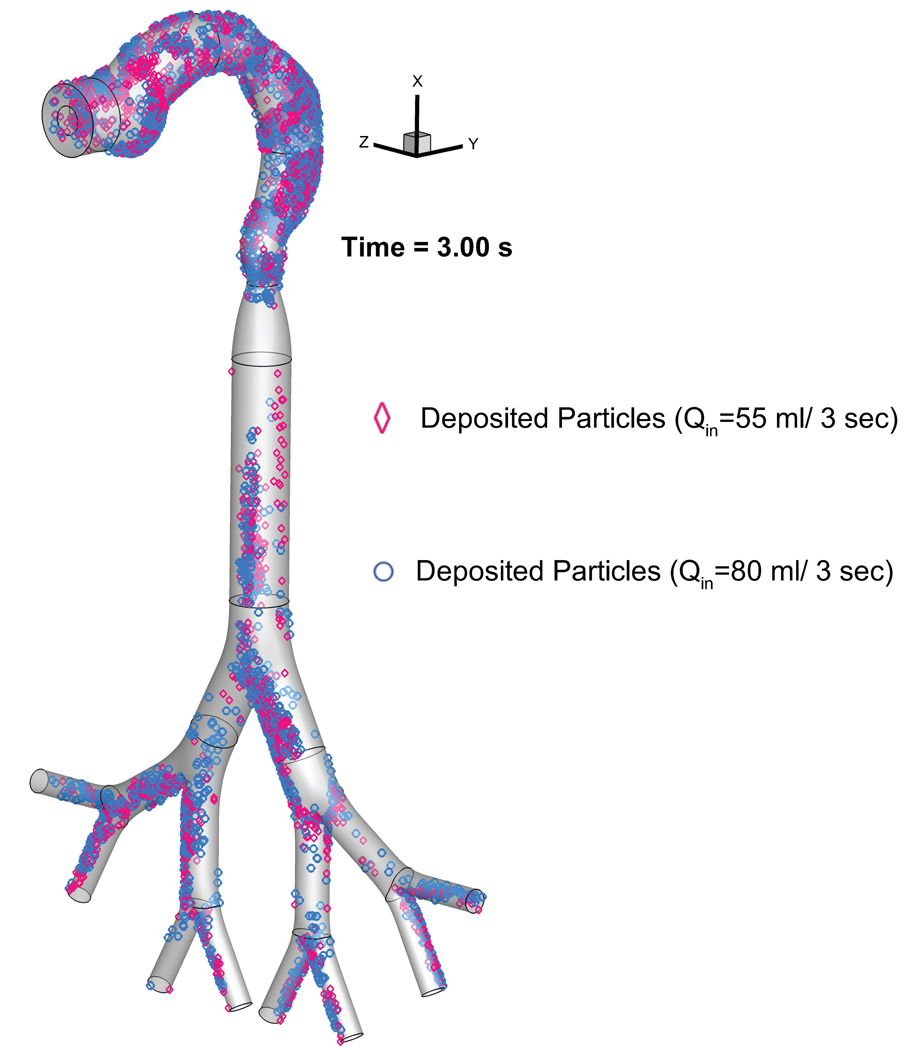
Comparison of the EC particle deposition patterns at t=3.0 s between two puffing volumes.
Additionally, comparisons of regional deposition fractions (RDFs) for all cases with different inlet conditions are shown in Figure 7. The histogram indicates that high puff flow rate leads to enhanced RDFs due to the stronger inertial impaction effect and less EC particles will be able to transport into deeper airways. Increased holding time will also increase RDFs because of the increased particle residence time. The subsequent holdings to active puffs increase the residence time of the EC particles, which were still suspending in the lung. Hence, the regional deposition will continuously occur with the progress of holding time.
3.4. Translocations of EC Toxicants in the Systemic Region
As the lung input to the PBTK model, total toxicant deposition was calculated by adding depositions of both particulate and vapor phases. Optimized values of bioavailability factors were determined for the simplified CFPD-PBTK connection model, by matching plasma concentration profiles from benchmark experiments (Ramôa et al., 2015; Shahab et al., 2017; Goniewicz et al., 2017). Since CFPD results indicate that the existence of the acrolein and nicotine in the region after trachea is negligible (see Sect. 3.2), it can be concluded that the total uptake of both nicotine and acrolein are mostly dependent on their absorption in human upper airways. Distribution and translocation of the toxicants are discussed separately in the following sections.
3.4.1. Nicotine Translocation
The concentration input profile in both vapor phase and particulate phase for nicotine are provided for all simulation cases with different puff topographies, i.e., two puffing volumes (55 and 80 ml per 3.0 s) and three holding times (0.0 s, 2.0 s, and 7.0 s). Figures 8 (a) and (b) show the concentration profiles for 10 seconds including 3 second puffing time followed by 2 and 7 seconds holding time for nicotine at two puffing volumes of 55 and 80 ml. The AUC over 30-second puffing duration for each case is also provided which shows the average uptake value of each puff. Particle depositions are scaled up based on the realistic particle number concentrations. Subsequently, nicotine input concentration due to particle deposition and vapor absorption are considered, and the correlation is generated using nonlinear regression by the least square method.
Figure 8:
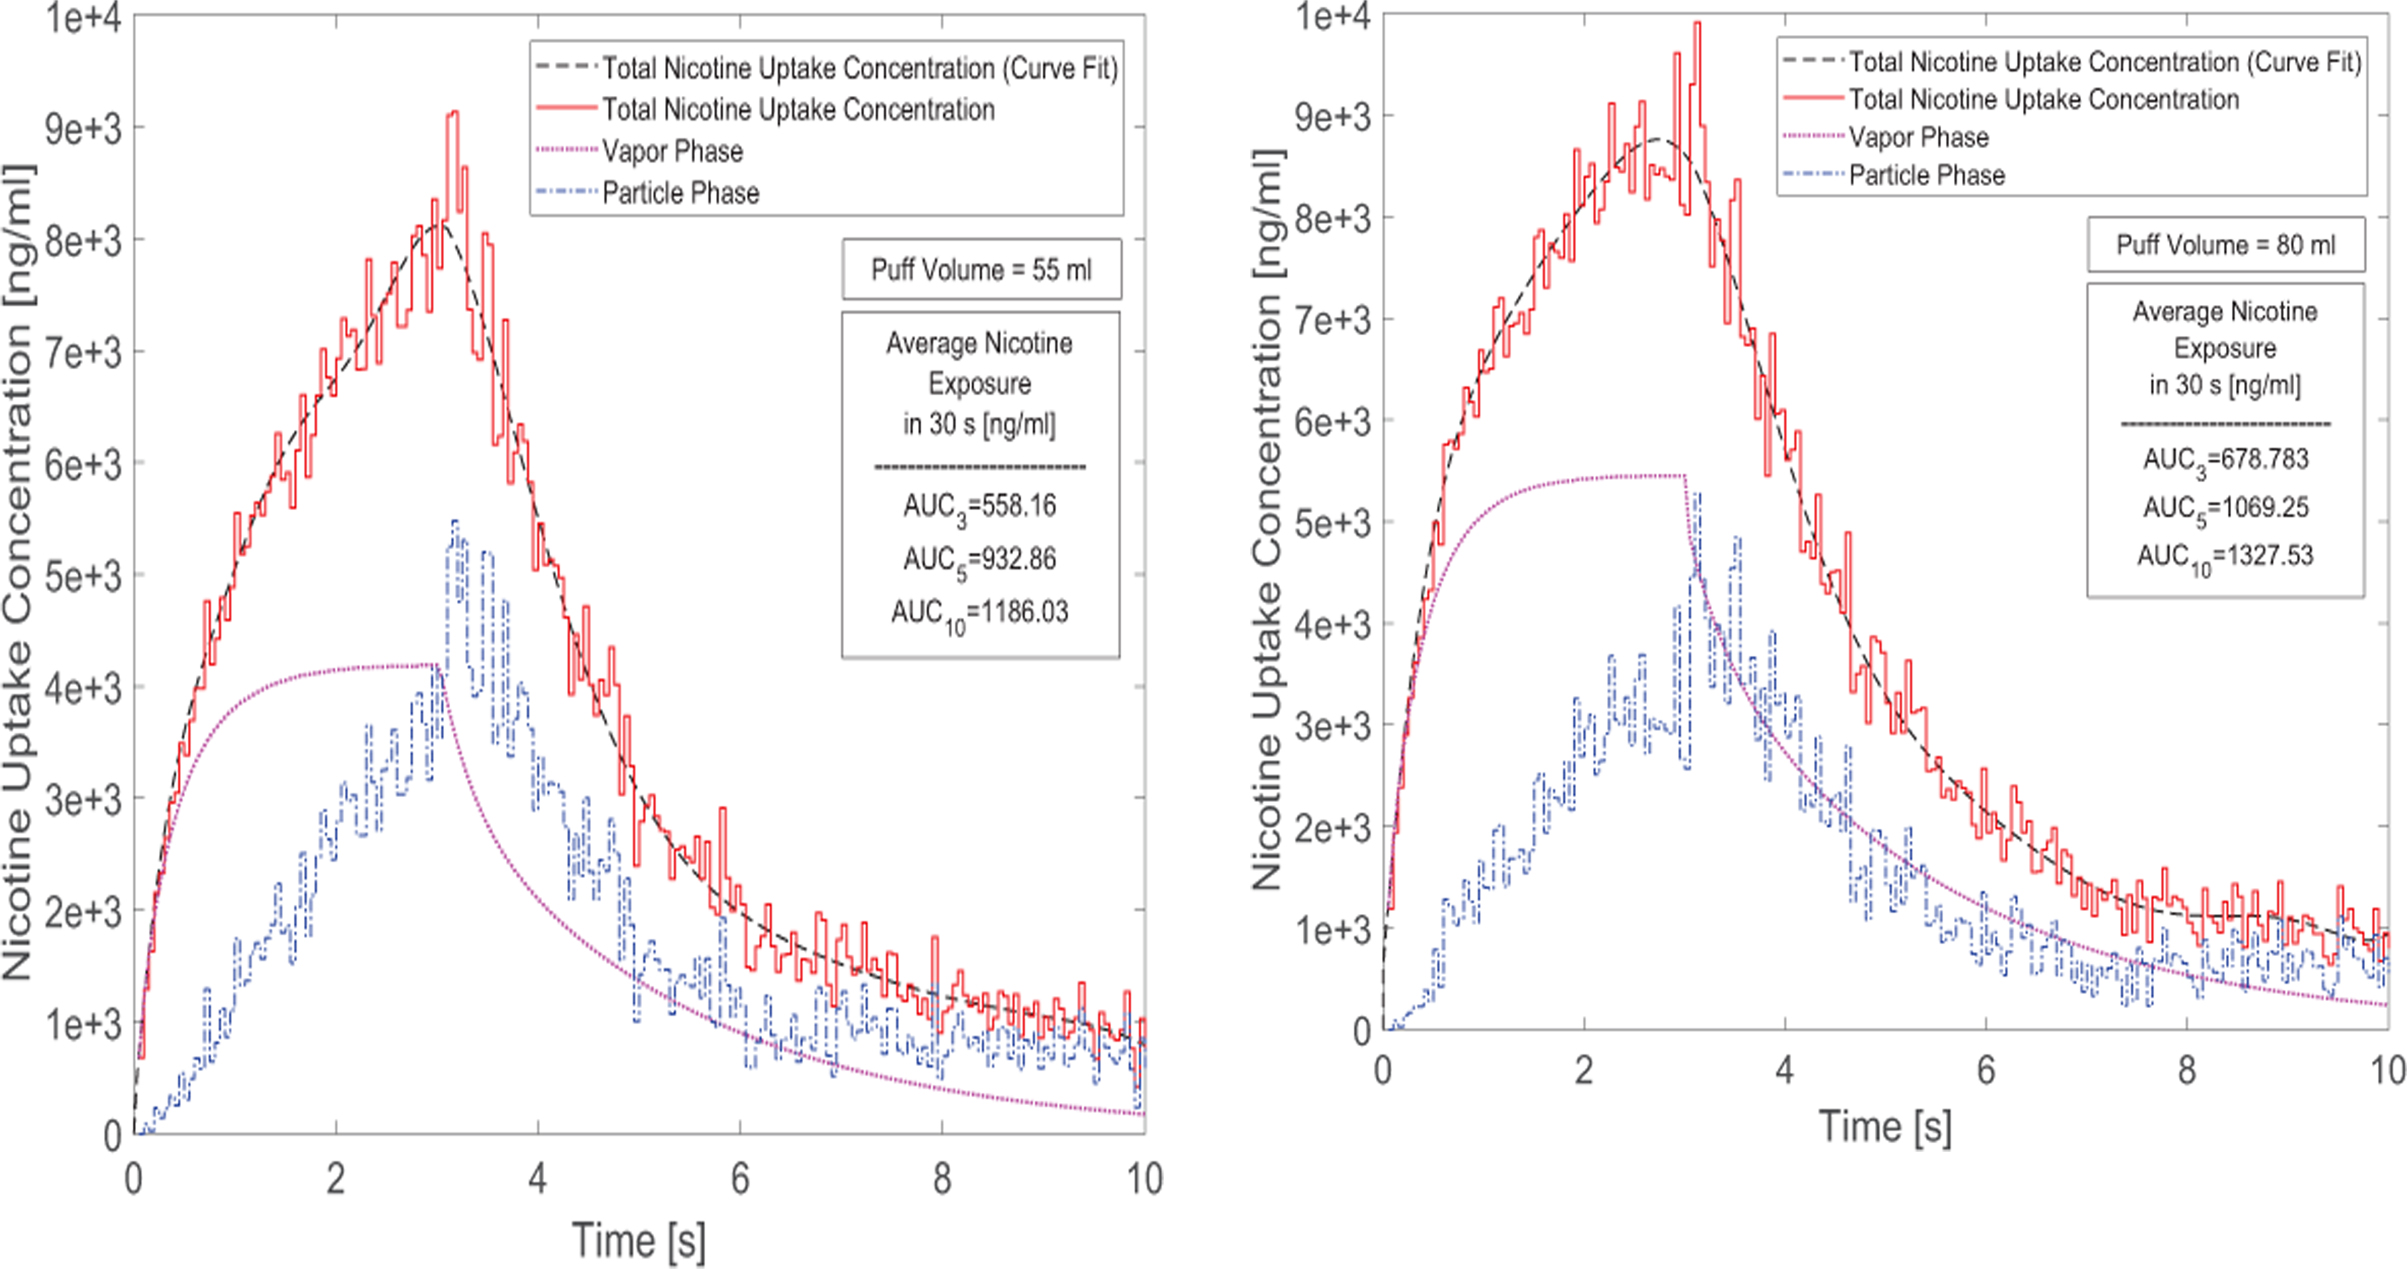
Time courses of nicotine uptake concentration after 3-second puffing duration followed by 7 seconds holding time: (a) 55 ml puffing volume, (b) 80 ml puffing volume for 10 seconds of the total puffing duration (30 seconds).
The AUCs show that for the case of 55 ml puffing volume the average uptake concentration per puff can be significantly higher for 2.0 s holding time (67.13 % increase) and for 7 seconds holding time (112.49% increase). Also for the case with 80 ml puffing volume, the increases are 57.52% and 95.57% respectively for 2 and 7 second holding times. Moreover, increasing puff volume will increase vapor absorption. However, it has little influence on particle deposition. As a result, the total deposition of the nicotine and respectively its uptake has increased by 21.61% for the case without holding time. This difference between different puffing volumes is simulated as 14.62% and 11.93% for 2 and 7 second holding times respectively in the course of 30.0 s puff duration. In this study, the influence of the exhalation has not been considered, and the deposition concentration after the holding time is set to zero. This assumption is reasonable since most deposition of nicotine in both vapor and particle forms occur before t=10.0 s (see Figures 8 (a) and (b)).
The predicted nicotine plasma concentrations under different puff volumes are provided in Figures 9 (a) and (b). 10 puffs with 30.0 s puffing duration are considered. The first puff results in a sudden increase of nicotine concentration. The subsequent 9 puffs increase the concentration gradually with a slower rate. The peak plasma concentrations after 10 puffs for the case of 55 and 80 ml puffing volumes are 15.58 ng/ml and 18.88 ng/ml without considering holding time. It can also be observed that due to the higher absorption and deposition, the increase in holding time generates higher plasma concentrations. At the same time, the realistic holding time will result in a change of the exhalation time. Overall, the increase in holding times will contribute to the exponential increase of the nicotine bioavailability. Changing puffing volume only has a slight effect on nicotine plasma concentration compared to changing holding time.
Figure 9:
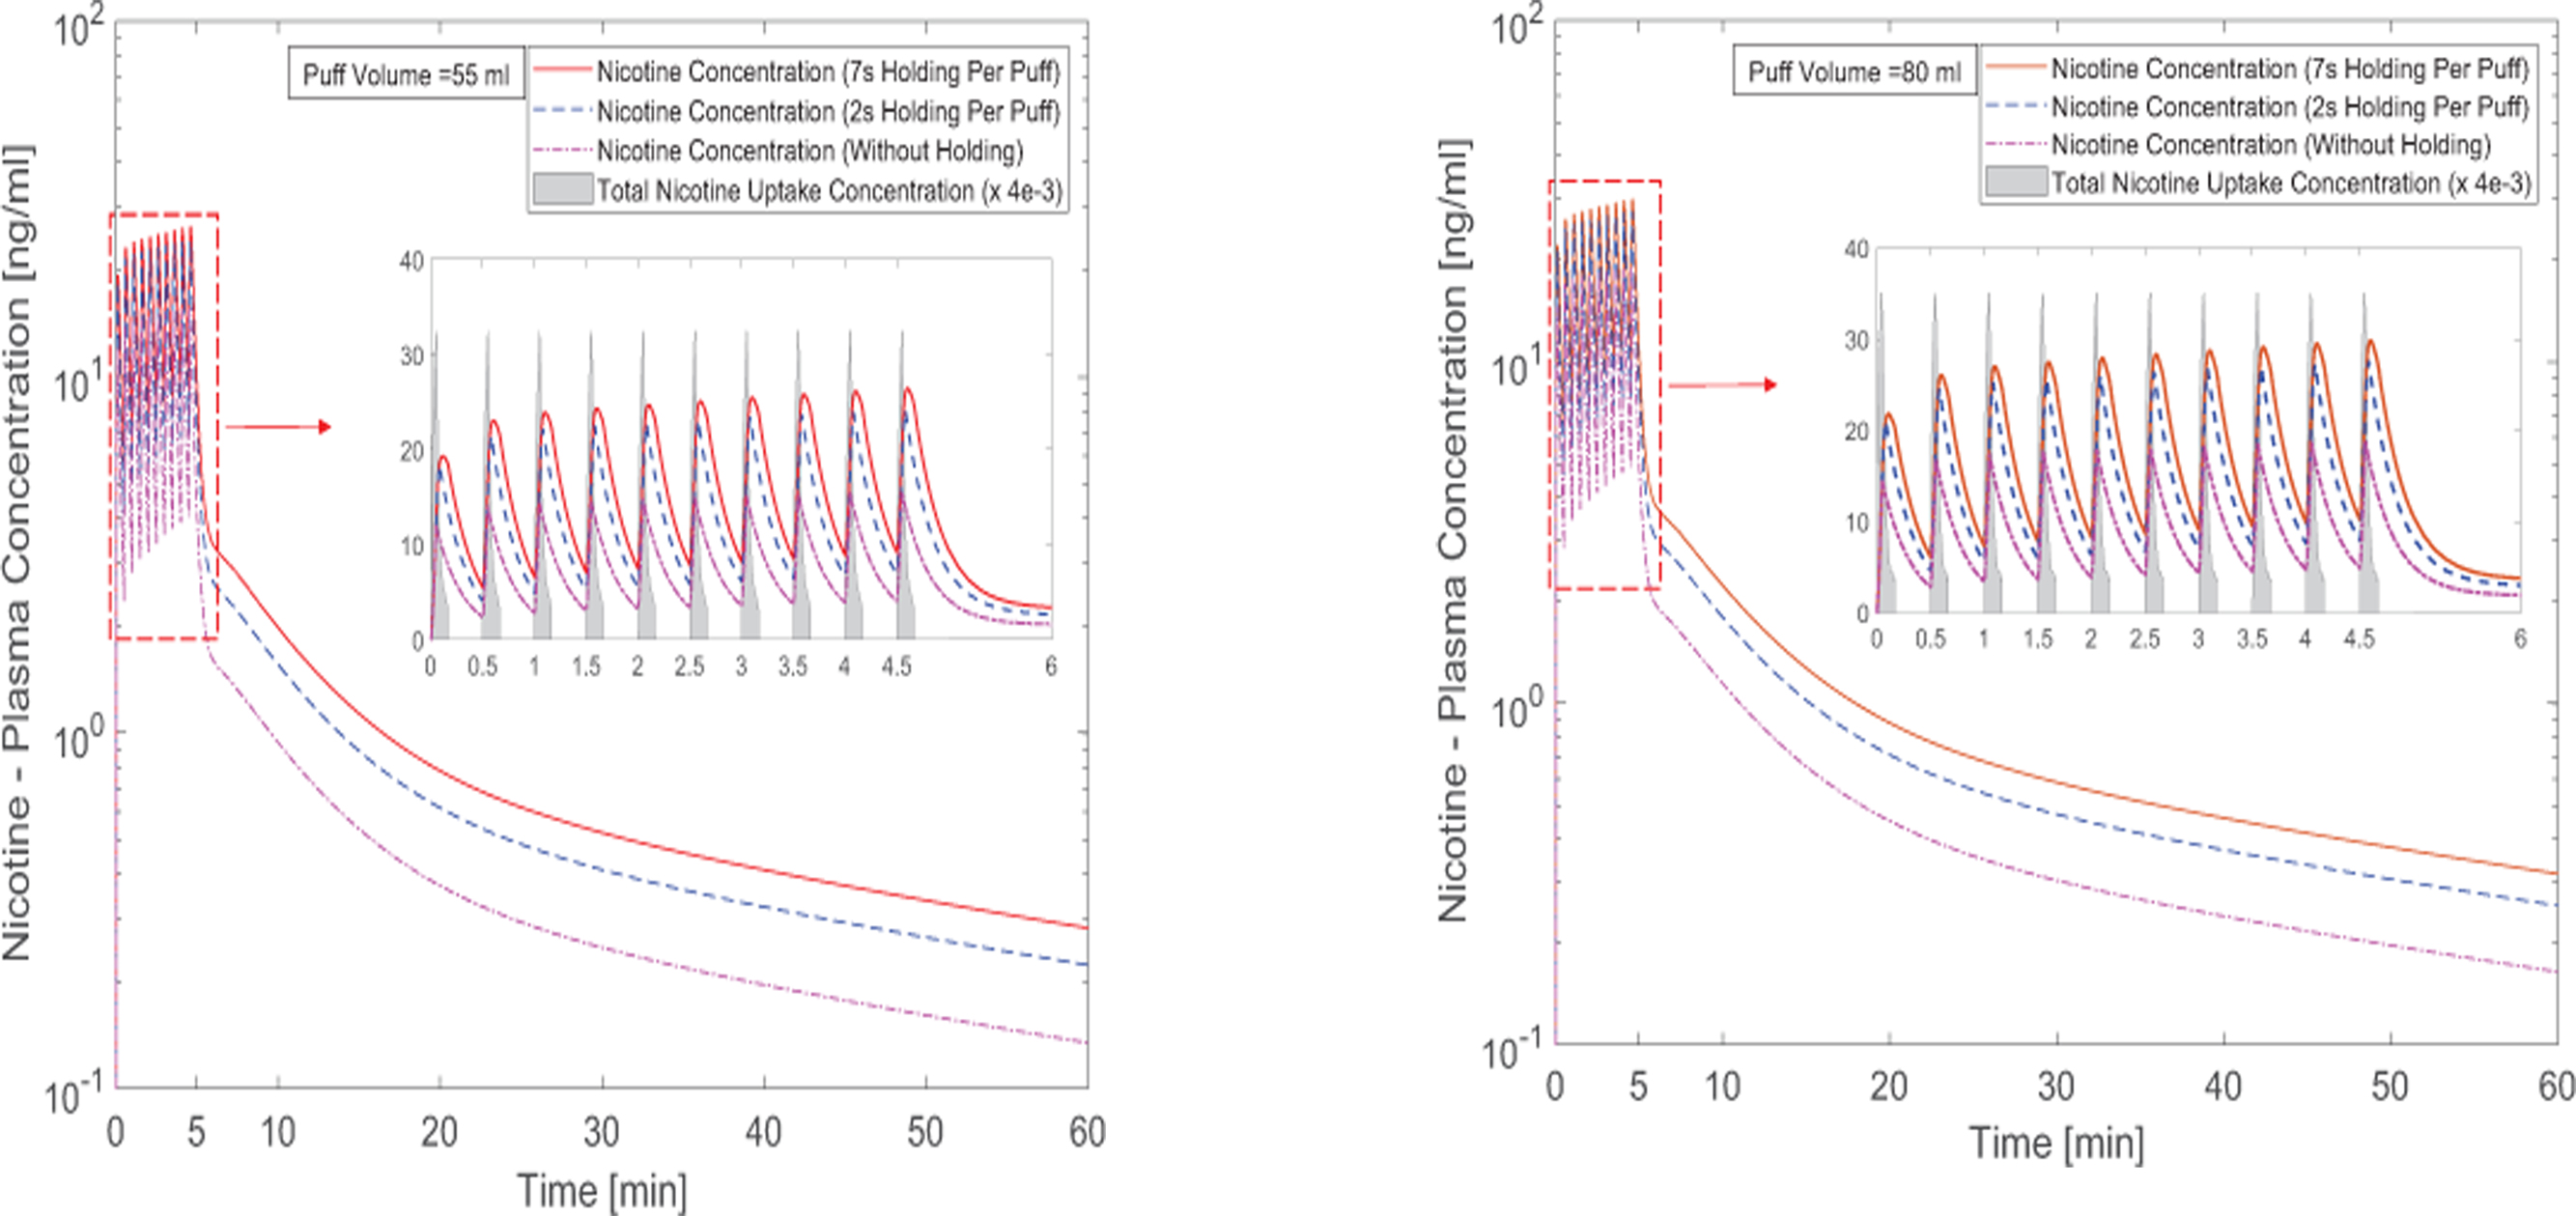
Time courses of nicotine plasma concentration: (a) 55 ml puffing volume, (b) 80 ml puffing volume (the nicotine uptake concentration has been scaled down for better visualization).
3.4.2. Acrolein Translocation
Acrolein exists only in the vapor phase based on the initial condition applied in this study. As a result, the uptake concentration will be induced by the vapor phase absorption, which is shown in Figure 10 for the two cases with 55 and 80 ml puff volumes. It is obvious that the increase in puff volume results in the increase of the peak value of the uptake concentration from 0.508 to 0.792 ng/ml. The average AUC for 30 seconds for different cases with different holding times are also provided. For the cases with of 55 ml and 80 ml puffing volumes, increases of AUC as representative of per puff exposure after considering two holding times of 2.0 s and 7.0 s are 45.51%, 83.27%, 44.45%, and 134.53 respectively.
Figure 10:
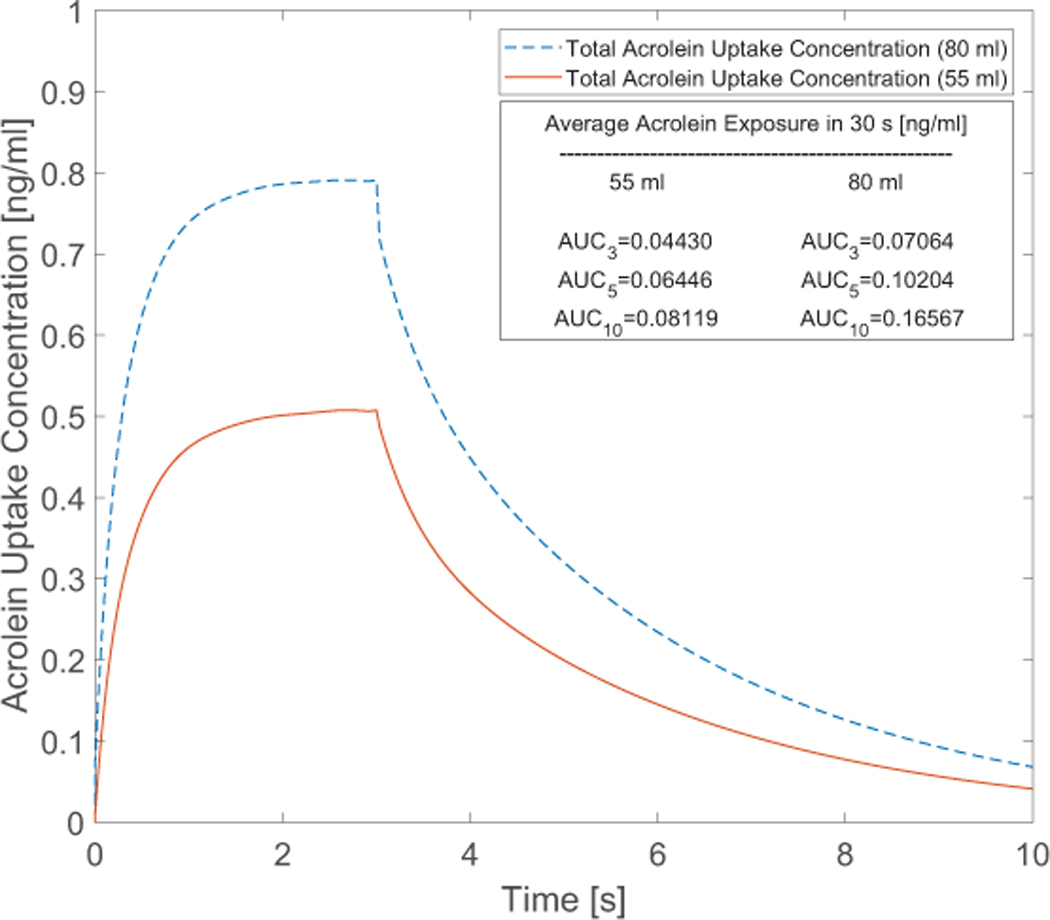
Time course of acrolein uptake concentration after 3-second puffing duration followed by 7 seconds holding time at two puffing volumes of 55 and 80 ml for 10 seconds of the total puffing duration (30 seconds).
Figures 11 (a) and (b) present the acrolein plasma concentration within 10 puffs. The puff by puff increase of the acrolein concentration can be observed. The first puff has resulted in major increase in the concentration. After 10 puffs, peak concentrations of acrolein with different holding times from 0.0 s to 7.0 s are 0.001221, 0.001648, 0.001803 ng/ml for 55 ml puffing volume case and 0.001947, 0.002614, 0.002864 ng/ml for 80 ml puffing volume case. For better visualization effect, the acrolein uptakes were scaled down by 4e-3 for better visualization. The reason for the difference is that the difference of the considered lymph vein volume compared to the plasma volume.
Figure 11:
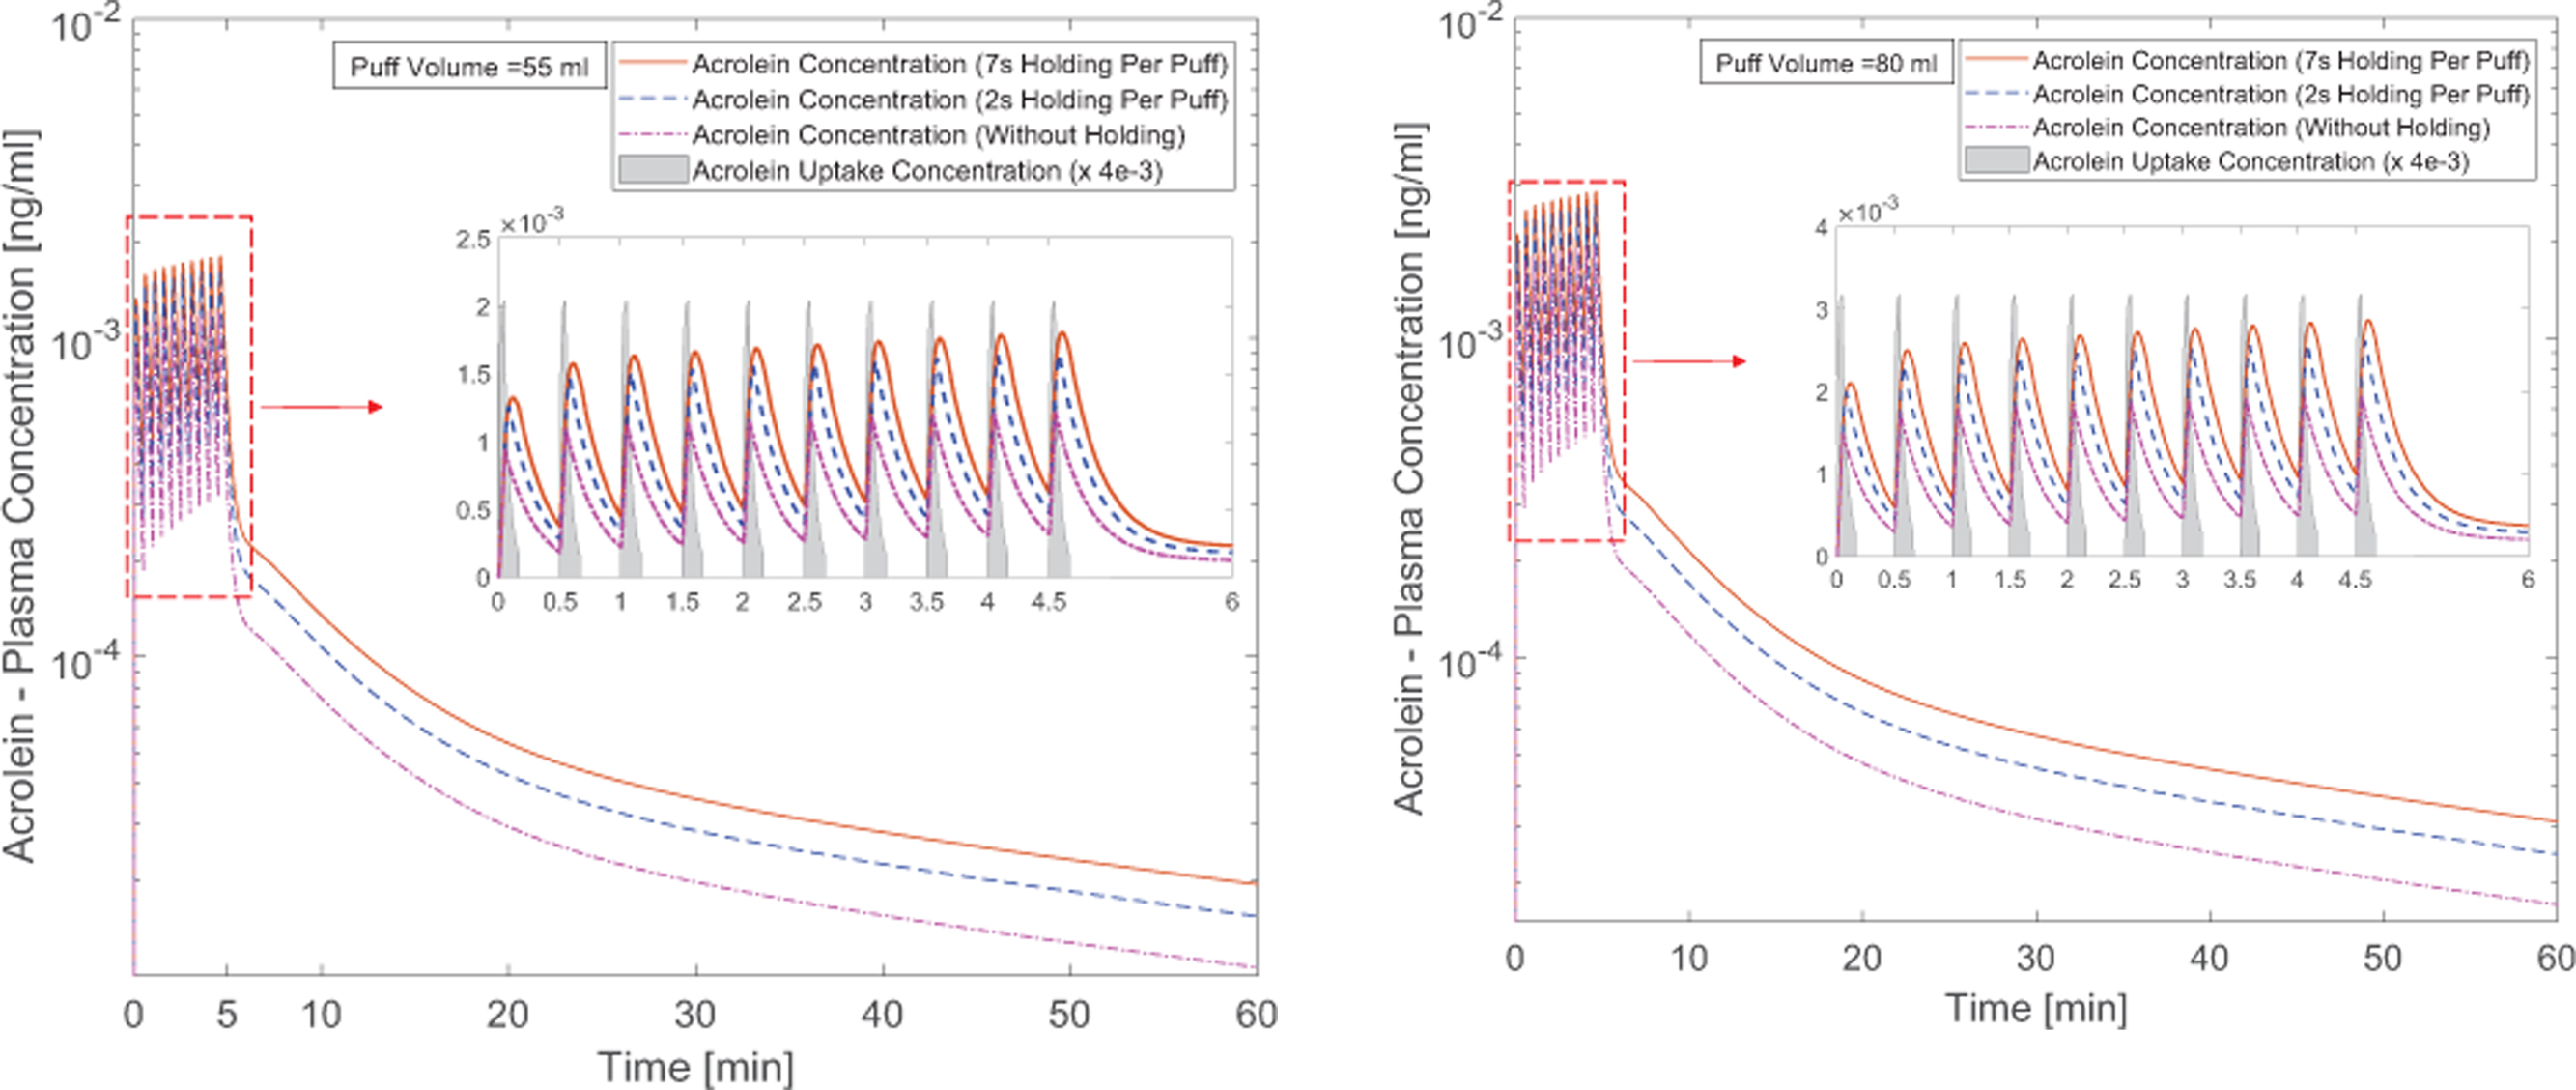
Time courses of acrolein plasma concentration: (a) 55 ml puffing volume, (b) 80 ml puffing volume (the acrolein uptake concentration has been scaled down for better visualization).
The formation of 3-HPMA produced by the binding between acrolein and glutathione has been identified in the urinary sample of rats (Alarcon, 1976). As a result, 3-HPMA is considered as the main metabolite and possible biomarker of acrolein bioavailability. 3-HPMA concentration at the kidney is shown in Figure 12. It should be noted that in this study the regional bioavailability factors are considered as representative of reactions taking place to form the metabolites of the species. In this way, complete conversion of acrolein to 3-HPMA has been initiated to the PBTK model for the acrolein. It is worth mentioning that acrolein itself has lyophilic characteristic and the perfusion-limited models can be reliable prediction based on our simulation. However, it is also important for the future studies to investigate the fate of transport in the tissue for its main metabolites. In Figure 12, the puff-by-puff increase of the concentration in the kidney can be observed. Damped concentration profile in the kidney can be attributed to the configuration of the compartments. The peak concentration in excretion for 55 ml puffing volume are 110.74, 160.40, and 201.58 ng/mg creatinine for the three cases with 0.0, 2.0, and 7.0 s holdings after the 3.0 s puff duration. Also, for cases with 80 ml puffing volume, the peak values are 176.78, 245.35, and 321.15 ng/mg creatinine respectively.
Figure 12:
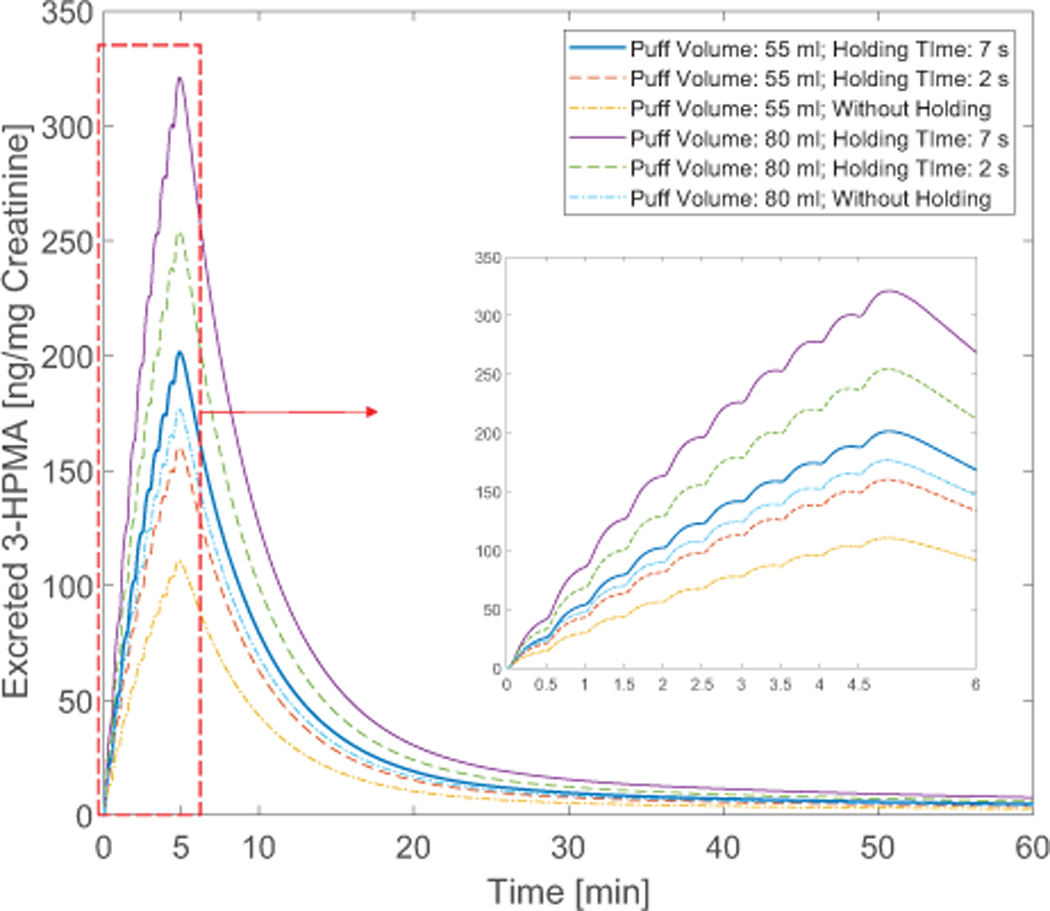
Time courses of the ratio between excreted 3-HPMA and creatinine in the kidney with different puff topographies
Based on the simulation the excretion profile shows a peak value that is suggested by the experiments (Shahab et al., 2017). The increase in puff volume from 55 to 80 ml for a case without holding time has contributed to 59.63% increase. However, by increasing the holding time for the case with 55 ml puffing volume, the peak value increase is approximately 82.03%. This difference can depict the importance of the holding time that can contribute to significant change in translocation magnitude in the human body. Existing standards of the puffing machines have focused mostly on three parameters: puff volume, duration and interval time. Therefore, the importance of the additional parameter that must also be investigated in the futural experiments. Other parameters may include EC product type (McNeill et al., 2015), and interaction between EC chemicals (Kane and Alarie, 1978).
4. Conclusions
In this study, a multiscale CFPD-PBTK model is developed and applied to accurately predict multicomponent EC aerosol transport, deposition, and translocation from the human respiratory system to systemic regions. Specifically, aerosol dynamics was modeled by the CFPD model established based on the Euler-Lagrange scheme. A 9-compartment PBTK framework subsequently simulates the translocation of nicotine and acrolein in the systemic region. Employing the CFPD-PBTK model, it is the first time that in-silico investigations can reflect realistic EC vaping scenarios, i.e., multiple puffs with real EC user behaviors. The model advances the field of aerosol exposure science to pave the way to a valuable computational simulation tool for assessing the long-term health effects of inhaled e-cigarette toxicants in the human respiratory pathway and systemic regions. Quantitative data of EC toxicant fates to the health endpoints are generated and discussed. Based on the numerical results, conclusions and novel insight are summarized as follows:
Most of the vaporized nicotine and acrolein are absorbed in the upper airway from mouth to G1. In contrast, EC aerosol particle deposition occurs in all regions from mouth to G3.
Both particulate and vapor forms of nicotine and acrolein contribute to the deposition and translocation in the human body.
The increase from 55 to 80 ml puffing volume results in significant increase of the peak nicotine and acrolein plasma concentration as 21.2% and 59.45% for the cases without holding.
With fixed puffing volume, increasing holding time will result in the increase of peak plasma concentration for both nicotine and acrolein.
Holding time between consecutive puffs has significant impacts on the EC aerosol deposition and translocation. Therefore, it is necessary to include holding time in both experimental and numerical studies to provide accurate predictions.
5. Future Work
Future work will focus on the improvement of the CFPD-PBTK model considering more complex aerosol dynamics. The next generation CFPD-PBTK model will include the coagulation, condensation, and evaporation among phases. The interconnection model will be developed for different pulmonary regions, to reflect the different diffusion and reaction characteristics. Additionally, subject-specific human airway configurations will be used for vulnerable subpopulation groups to EC products, e.g., adolescents, and COPD patients. To improve the current PBTK model, the couplings among compartments will be considered to simulate the realistic time delay effects in different organs. Also, a diffusion-limited PBTK model will be developed for formaldehyde and other toxicants in EC aerosols.
Supplementary Material
Acknowledgements
Research reported in this publication was supported by the National Institute of General Medical Sciences of the National Institute of Health under Award Number P20GM103648. The authors also gratefully acknowledge the financial support of Dr. Jiang Lin from the National Natural Science Foundation of China (No. 51246002). The use of ANSYS software (Canonsburg, PA) as part of the ANSYS-OSU academic partnership agreement is gratefully acknowledged (Dr. Thierry Marchal, Global Industry Director). Some of the computing for this project was performed at the OSU High Performance Computing Center at Oklahoma State University (Dr. Dana Brunson, Director and Dr. Evan Linde, Research Cyberinfrastructure Analyst).
References
- Abraham K, Andres S, Palavinskas R, Berg K, Appel KE, & Lampen A (2011). Toxicology and risk assessment of acrolein in food. Molecular nutrition & food research, 55(9), 1277–1290. [DOI] [PubMed] [Google Scholar]
- Alarcon R (1976). Studies on the in vivo formation of acrolein: 3-hydroxy-propylmercapturic acid as an index of cyclophosphamide (NSC-26271) activation. Cancer treatment reports, 60(4), 327–335. [PubMed] [Google Scholar]
- Alfi M, & Talbot P (2013). Health-related effects reported by electronic cigarette users in online forums. Journal of medical Internet research, 15(4). [DOI] [PMC free article] [PubMed] [Google Scholar]
- Allen JG, Flanigan SS, LeBlanc M, Vallarino J, MacNaughton P, Stewart JH, & Christiani DC (2016). Flavoring chemicals in e-cigarettes: diacetyl, 2, 3-pentanedione, and acetoin in a sample of 51 products, including fruit-, candy-, and cocktail-flavored e-cigarettes. Environmental health perspectives, 124(6), 733. [DOI] [PMC free article] [PubMed] [Google Scholar]
- Andersen M, Sarangapani R, Gentry R, Clewell H, Covington T, & Frederick CB (2000). Application of a hybrid CFD-PBPK nasal dosimetry model in an inhalation risk assessment: an example with acrylic acid. Toxicological Sciences, 57(2), 312–325. [DOI] [PubMed] [Google Scholar]
- Belka M, Lizal F, Jedelsky J, Jicha M, & Pospisil J (2017). Measurement of an electronic cigarette aerosol size distribution during a puff Paper presented at the EPJ Web of Conferences. [Google Scholar]
- Bush ML, Frederick CB, Kimbell JS, & Ultman JS (1998). A CFD–PBPK hybrid model for simulating gas and vapor uptake in the rat nose. Toxicology and applied pharmacology, 150(1), 133–145. [DOI] [PubMed] [Google Scholar]
- Chen X, Feng Y, Zhong W, & Kleinstreuer C (2017). Numerical investigation of the interaction, transport and deposition of multicomponent droplets in a simple mouth-throat model. Journal of aerosol science, 105, 108–127. [Google Scholar]
- Cobb NK, Byron MJ, Abrams DB, & Shields PG (2010). Novel nicotine delivery systems and public health: the rise of the “e-cigarette”. In: American Public Health Association. [DOI] [PMC free article] [PubMed]
- Corley RA, Kabilan S, Kuprat AP, Carson JP, Jacob RE, Minard KR, … Glenny R (2015). Comparative risks of aldehyde constituents in cigarette smoke using transient computational fluid dynamics/physiologically based pharmacokinetic models of the rat and human respiratory tracts. Toxicological Sciences, 146(1), 65–88. [DOI] [PMC free article] [PubMed] [Google Scholar]
- Corley RA, Kabilan S, Kuprat AP, Carson JP, Minard KR, Jacob RE, … Cox T (2012). Comparative computational modeling of airflows and vapor dosimetry in the respiratory tracts of rat, monkey, and human. Toxicological Sciences, 128(2), 500–516. [DOI] [PMC free article] [PubMed] [Google Scholar]
- De Woskin R, Greenberg M, Pepelko W, & Strickland J (2003). Toxicological review of acrolein (cas no. 107–02-08) in support of summary information on the integrated risk information system (Iris) Washington, DC: US Environmental Protection Agency. [Google Scholar]
- Feng Y, Kleinstreuer C, Castro N, & Rostami A (2016). Computational transport, phase change and deposition analysis of inhaled multicomponent droplet–vapor mixtures in an idealized human upper lung model. Journal of aerosol science, 96, 96–123. [Google Scholar]
- Goniewicz ML, Gawron M, Smith DM, Peng M, Jacob P, & Benowitz NL (2017). Exposure to nicotine and selected toxicants in cigarette smokers who switched to electronic cigarettes: a longitudinal within-subjects observational study. Nicotine & Tobacco Research, 19(2), 160–167. [DOI] [PMC free article] [PubMed] [Google Scholar]
- Goniewicz ML, Hajek P, & McRobbie H (2014). Nicotine content of electronic cigarettes, its release in vapour and its consistency across batches: regulatory implications. Addiction, 109(3), 500–507. [DOI] [PubMed] [Google Scholar]
- Haghnegahdar A, Feng Y (2017). The translocation of nicotine from human lung to systemic regions due to e-cigarette aerosol inhalation: a numerical study. 5th International Conference on Computational and Mathematical Biomedical Engineering (CMBE), Pittsburgh, PA, USA. [Google Scholar]
- Ingebrethsen BJ, Cole SK, & Alderman SL (2012). Electronic cigarette aerosol particle size distribution measurements. Inhalation toxicology, 24(14), 976–984. [DOI] [PubMed] [Google Scholar]
- Kane LE, & Alarie Y (1978). Evaluation of sensory irritation from acrolein-formaldehyde mixtures. The American Industrial Hygiene Association Journal, 39(4), 270–274. [DOI] [PubMed] [Google Scholar]
- Kimbell J, Gross E, Joyner D, Godo M, & Morgan K (1993). Application of computational fluid dynamics to regional dosimetry of inhaled chemicals in the upper respiratory tract of the rat. Toxicology and applied pharmacology, 121(2), 253–263. [DOI] [PubMed] [Google Scholar]
- Kleinstreuer C, & Feng Y (2013). Lung deposition analyses of inhaled toxic aerosols in conventional and less harmful cigarette smoke: a review. International journal of environmental research and public health, 10(9), 4454–4485. [DOI] [PMC free article] [PubMed] [Google Scholar]
- Lisko JG, Tran H, Stanfill SB, Blount BC, & Watson CH (2015). Chemical composition and evaluation of nicotine, tobacco alkaloids, pH, and selected flavors in e-cigarette cartridges and refill solutions. Nicotine & Tobacco Research, 17(10), 1270–1278. [DOI] [PMC free article] [PubMed] [Google Scholar]
- Manigrasso M, Buonanno G, Fuoco FC, Stabile L, & Avino P (2015). Aerosol deposition doses in the human respiratory tree of electronic cigarette smokers. Environmental Pollution, 196, 257–267. [DOI] [PubMed] [Google Scholar]
- McNeill A, Brose LS, Calder R, Hitchman SC, Hajek P, & McRobbie H (2015). E-cigarettes: an evidence update [DOI] [PubMed]
- Mishra A, Chaturvedi P, Datta S, Sinukumar S, Joshi P, & Garg A (2015). Harmful effects of nicotine. Indian journal of medical and paediatric oncology: official journal of Indian Society of Medical & Paediatric Oncology, 36(1), 24. [DOI] [PMC free article] [PubMed] [Google Scholar]
- Morris JB, Hassett DN, & Blanchard KT (1993). A physiologically based pharmacokinetic model for nasal uptake and metabolism of nonreactive vapors. Toxicology and applied pharmacology, 123(1), 120–129. [DOI] [PubMed] [Google Scholar]
- Morris PB, Ference BA, Jahangir E, Feldman DN, Ryan JJ, Bahrami H, … Al-Mallah MH (2015). Cardiovascular effects of exposure to cigarette smoke and electronic cigarettes. Journal of the American College of Cardiology, 66(12), 1378–1391. [DOI] [PubMed] [Google Scholar]
- Ramôa CP, Hiler MM, Spindle TR, Lopez AA, Karaoghlanian N, Lipato T, … Eissenberg T (2015). Electronic cigarette nicotine delivery can exceed that of combustible cigarettes: a preliminary report. Tobacco control, tobaccocontrol-2015–052447 [DOI] [PMC free article] [PubMed]
- Robinson DE, Balter NJ, & Schwartz SL (1992). A physiologically based pharmacokinetic model for nicotine and cotinine in man. Journal of pharmacokinetics and biopharmaceutics, 20(6), 591–609. [DOI] [PubMed] [Google Scholar]
- Shahab L, Goniewicz ML, Blount BC, Brown J, McNeill A, Alwis KU, … West R (2017). Nicotine, Carcinogen, and Toxin Exposure in Long-Term E-Cigarette and Nicotine Replacement Therapy UsersA Cross-sectional StudyE-Cigarettes and Toxin Exposure. Annals of internal medicine, 166(6), 390–400. [DOI] [PMC free article] [PubMed] [Google Scholar]
- Smith J, Van Ness H, & Abbott M (1996). Chemical engineering thermodynamics. Sat, 18, 1–3. [Google Scholar]
- Uchiyama S, Ohta K, Inaba Y, & Kunugita N (2013). Determination of carbonyl compounds generated from the E-cigarette using coupled silica cartridges impregnated with hydroquinone and 2, 4-dinitrophenylhydrazine, followed by high-performance liquid chromatography. Analytical Sciences, 29(12), 1219–1222. [DOI] [PubMed] [Google Scholar]
- Wang G-W, Guo Y, Vondriska TM, Zhang J, Zhang S, Tsai LL, … Prabhu SD (2008). Acrolein consumption exacerbates myocardial ischemic injury and blocks nitric oxide-induced PKCε signaling and cardioprotection. Journal of molecular and cellular cardiology, 44(6), 1016–1022. [DOI] [PubMed] [Google Scholar]
- Flora JW, Wilkinson CT, Wilkinson JW, Lipowicz PJ, Skapars JA, Anderson A, & Miller JH (2017). Method for the determination of carbonyl compounds in e-cigarette aerosols. Journal of Chromatographic Science, 55(22): 142–148. [DOI] [PMC free article] [PubMed] [Google Scholar]
- Morris JB (2012). Biologically-based modeling insights in inhaled vapor absorption and dosimetry. Pharmacology & therapeutics, 136(3): 401–413. [DOI] [PubMed] [Google Scholar]
Associated Data
This section collects any data citations, data availability statements, or supplementary materials included in this article.


