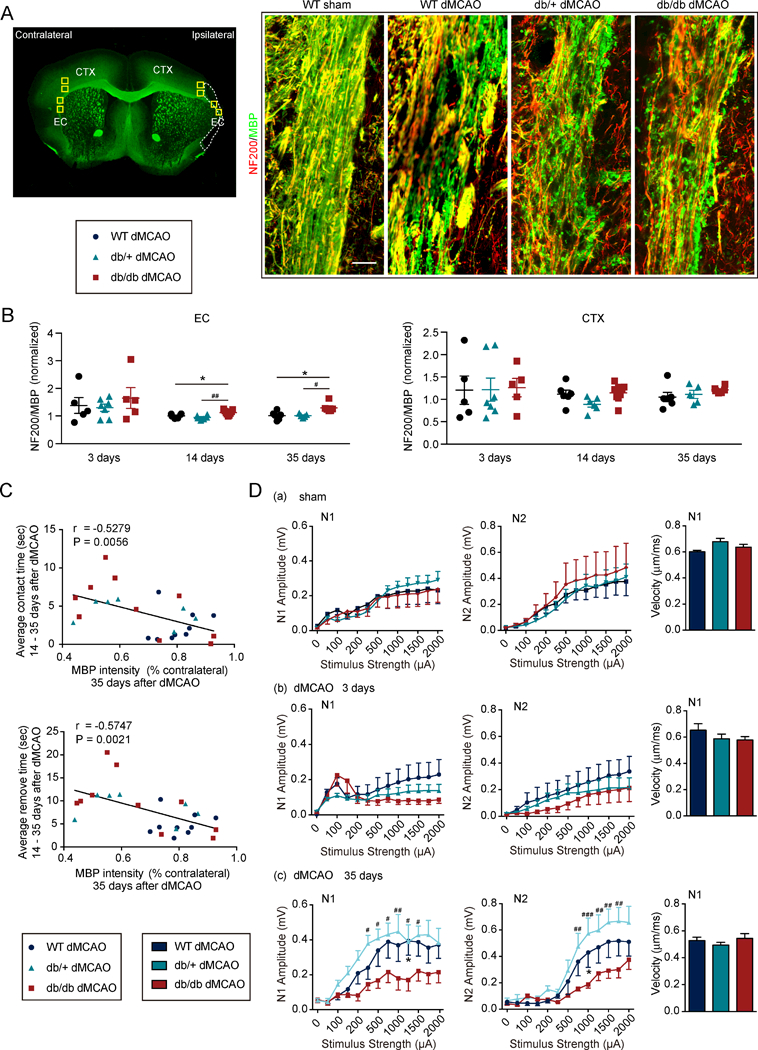
Figure 3. Deterioration of WM injury in db/db mice is associated with impairments in long-term neurological functions after dMCAO.

A, Left: Yellow rectangles illustrate the anatomical location of microscopic images captured in the ipsilateral peri-infarct regions and corresponding contralateral areas. Right: Representative images of NF200 and MBP double-immunostained coronal sections 35d after dMCAO or sham operation. Scale bar: 40 μM. B, Ratio of NF200 (red) and MBP (green) staining intensities in the external capsule (EC) or cortex (CTX) 3d, 14d and 35d after dMCAO. n=5 – 9/group. one-way ANOVA followed by Bonferroni post hoc. C, Pearson correlation between MBP levels in the EC 35d after dMCAO and average latency to contact or remove adhesive tape from 14d to 35d after dMCAO. n=7–10/group. D, Electrophysiological studies were performed on brain slices prepared from WT mice, db/+ mice and db/db mice at 3d (n=6–8/group) and 35d (n=3–4/group) after dMCAO or in sham animals (n=4/group). (a-c) Quantification of amplitude and velocity in myelinated N1 fibers and amplitude in unmyelinated N2 fibers in sham mice (a) and 3d (b) and 35d (c) after dMCAO. *p<0.05, WT vs. db/db; #p<0.05, ##p<0.01, ###p < 0.001, db/+ vs. db/db; two-way ANOVA followed by Bonferroni post hoc.
