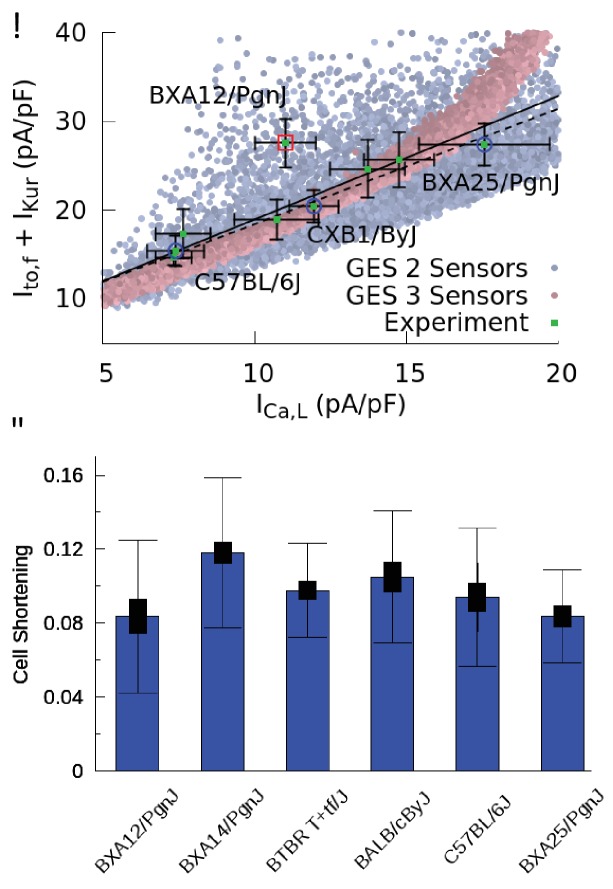
Figure 4. Good enough solutions in the Hybrid Mouse Diversity Panel (HMDP).
(A) Central result of this paper showing quantitative agreement between theoretically predicted and experimentally measured compensation of inward Ca2+ and outward K+ currents. Equivalent plot of Figure 3F showing the sum of and versus for nine different mouse strains using peak values of those currents (proportional to conductances) after a voltage step from −50 to 0 mV. Mean current values (green filled squares) are shown together with standard errors of the mean (thin bars) for each strain. The number of cells used for each strain is given in Table 1 of the Materials and methods section. Computationally determined GES are superimposed and shown as faded red points using all three sensors (CaT amplitude, average , and diastolic ) and faded blue points for two sensors (CaT amplitude and average ). Lines represent linear regression fits using the method of Chi-squared minimization with errors in both coordinates including (solid line, p=0.0144) and excluding (dashed line, p=0.0007) the outlier strain BXA12/PgnJ marked by a red box. The small p values of those fit validate the computationally predicted three-way compensation of Ca2+ and K+ currents. The three strains selected for the organ scale study (C57BL/6J, CXB1/ByJ, and BXA25/PgnJ) with low, medium, and high conductance, respectively, are highlighted by blue circles. (B) Cell shortening, measured as the fraction of resting cell length at 4 Hz pacing frequency in different HMPD strains where thick and thin bars correspond to standard error of the mean and standard deviation, respectively. A standard ANOVA test shows no significant differences in cell shortening between strains (p=0.4136) supporting the hypothesis that different combinations of conductances produce a similar CaT and contractile activity.


