Abstract
Invariant floral forms are important for reproductive success and robust to natural perturbations. Petal number, for example, is invariant in Arabidopsis thaliana flowers. However, petal number varies in the closely related species Cardamine hirsuta, and the genetic basis for this difference between species is unknown. Here we show that divergence in the pleiotropic floral regulator APETALA1 (AP1) can account for the species-specific difference in petal number robustness. This large effect of AP1 is explained by epistatic interactions: A. thaliana AP1 confers robustness by masking the phenotypic expression of quantitative trait loci controlling petal number in C. hirsuta. We show that C. hirsuta AP1 fails to complement this function of A. thaliana AP1, conferring variable petal number, and that upstream regulatory regions of AP1 contribute to this divergence. Moreover, variable petal number is maintained in C. hirsuta despite sufficient standing genetic variation in natural accessions to produce plants with four-petalled flowers.
Research organism: A. thaliana
eLife digest
Many plants produce flowers that attract insects to land on them. Different insects are attracted to flowers of different shapes and colors. Therefore, it is generally advantageous for plants of the same species to produce flowers that look very similar.
For example, a small weed known as Arabidopsis – which is often used in research studies – produces little white flowers that all have four petals. Thus, the number of petals in Arabidopsis flowers is said to be a ‘robust’ trait. However, a closely-related plant called hairy bittercress produces flowers with any number of petals between zero and four. Studying the genetic differences between Arabidopsis and hairy bittercress can help to reveal why the numbers of petals on hairy bittercress flowers vary.
A gene called APETALA1 helps to control how petals form. Monniaux, Pieper et al. found that Arabidopsis and hairy bittercress have different versions of this gene that determine whether the number of petals may vary between individual flowers. Inserting the Arabidopsis version of APETALA1 into hairy bittercress plants caused the plants to produce flowers that had more similar numbers of petals to each other, that is, the petal number became more robust.
Monniaux, Pieper et al. then used a statistical method called quantitative trait locus analysis to identify the precise location of regions in the hairy bittercress genome that control petal number. This showed that the Arabidopsis version of APETALA1, but not the hairy bittercress version, conceals the action of these genes that could alter petal number.
These findings reveal that evolutionary change in a single gene of hairy bittercress unmasked the action of other genes that caused petal number to vary. A next step will be to identify some of these genes and understand how they control petal number.
Introduction
Determining the genetic basis of developmental traits, and how these evolve to generate novelties, is a major goal of evolutionary developmental biology. Developmental systems are remarkably robust to natural perturbations, such that individuals tend to develop normally despite variation in the environment or their genetic make-up (Wagner, 2005). Therefore, a particular challenge is to understand the developmental transitions between the robust morphology of individuals within a species, and the variation in form between species.
Petal number is a robust trait in flowering plants and usually invariant within species and even higher taxonomic orders. For example, three petals are commonly found in monocots while five petals are characteristic of many core eudicots (Endress, 2011; Specht and Bartlett, 2009). On the other hand, petal number is much more labile in basal angiosperms (Endress, 2001; Endress, 2011; Specht and Bartlett, 2009), suggesting that this trait was canalized during angiosperm evolution to produce a stable phenotype in the face of genetic and environmental perturbation. Petals are usually required to open the flower and to help attract pollinators (Fenster et al., 2004; van Doorn and Van Meeteren, 2003), therefore a stable number of petals could ensure a reliable display of the reproductive organs and a reproducible cue for pollinators.
The model plant Arabidopsis thaliana belongs to the Brassicaceae family, which are commonly called crucifers after the cross-shaped arrangement of four petals in their flowers (Endress, 1992). Petals acquire their identity via the combined activity of A- and B-class floral organ identity genes, according to the ABC model of flower development (Coen and Meyerowitz, 1991). However, less is known about the genetic control of petal number. In A. thaliana flowers, initiation of four petals depends on the size of the floral meristem, the establishment of boundaries that demarcate the position of petal primordia on the floral meristem, the transient formation of auxin activity maxima in these positions, and the general mechanisms of lateral organ outgrowth (Huang and Irish, 2015; Huang and Irish, 2016 ; Irish, 2008). Consistent with this complexity, few A. thaliana mutants specifically affect petal number; among them is petal loss (ptl), which displays a variable loss of petals caused by mutation of the PTL trihelix transcription factor (Brewer et al., 2004; Griffith et al., 1999). Other mutants pleiotropically affect petal number, such as mutations in the MADS-box transcription factor APETALA1 (AP1), which shows floral meristem identity defects in addition to variable petal loss (Irish and Sussex, 1990; Mandel et al., 1992).
Cardamine hirsuta is a close relative of A. thaliana that lacks a robust phenotype of four petals (Hay et al., 2014). Instead, C. hirsuta flowers display a variable number of petals, between zero and four, on a single plant (Monniaux et al., 2016; Pieper et al., 2016). This phenotype varies in response to both environmental and genetic perturbation. C. hirsuta flowers show seasonal variation in petal number, with spring-flowering plants producing more petals than summer-flowering plants (McKim et al., 2017). Seasonal cues, such as day length, winter cold, and particularly ambient temperature, all influence the number of petals produced in C. hirsuta flowers (McKim et al., 2017). Furthermore, petal number is strongly influenced by natural genetic variation in C. hirsuta. A polygenic architecture of small to moderate effect quantitative trait loci (QTL), that shift the trait in both directions, contribute to petal number variation in C. hirsuta (Pieper et al., 2016). Alleles of large effect and low pleiotropy were identified in genetic screens for four-petalled mutants in C. hirsuta, but were not detected by QTL analysis in natural accessions (Pieper et al., 2016). Thus, the distribution of allelic effects found in natural populations of C. hirsuta is more likely to maintain variation, rather than robustness, in petal number.
Petal number varies both within and between species, evolving from a robust state of four petals, typified by A. thaliana, to a variable state in C. hirsuta. Phenotypic divergence between species is necessarily derived from variation within species, but identifying these evolutionary transitions is not a straight-forward task. This is because similar phenotypes that vary within and between species may or may not be caused by similar genetic mechanisms. For example, the same light-pigmentation alleles that are fixed in a yellow-bodied Drosophila species, segregate in a closely related brown-bodied species and contribute to clinal variation in its body colour (Wittkopp et al., 2009). However, in another example, genes responsible for leaf shape differences between A. thaliana and C. hirsuta were not detected as leaf shape QTL in C. hirsuta (Cartolano et al., 2015). Therefore, to understand how petal number variation is produced and how it evolved, it is important to investigate both the genetic basis of variation within species and divergence between species. For example, to address questions such as: How many genes contribute to trait divergence between species? How large are their effects? Do they have pleiotropic functions? How do they interact with genes causing variation in natural populations?
A simple prediction about robust phenotypes, such as petal number in A. thaliana, is that they are invariant because genetic variation is reduced by stabilizing selection on the phenotype. On the other hand, a developmental pathway might be robust because certain alleles prevent the phenotypic effects of new mutations. This would effectively buffer the phenotype and hide underlying genetic variation. Previous studies of vulva development in Caenorhabditis (Félix, 2007), and eye development in cavefish (Rohner et al., 2013), support the latter view, showing that there is extensive, selectable genetic variation affecting robust phenotypes, which can be exposed by genetic or environmental perturbation. Moreover, studies that use gene expression as a trait, have mapped QTL that influence variance rather than mean expression level (Hulse and Cai, 2013), and identified selection acting on expression noise rather than mean level (Metzger et al., 2015). However, there are few examples (Rohner et al., 2013) where the genetic basis of morphological differences between species can be traced to the release of cryptic variation.
In this study, we investigate the evolutionary transition from a robust phenotype of four petals, typified by A. thaliana, to a variable petal number in C. hirsuta. We show that divergence in the pleiotropic floral regulator AP1 can account for the difference in petal number robustness between species. This large effect of AP1 is explained by epistatic interactions: A. thaliana AP1 masks the phenotypic expression of all petal number QTL in C. hirsuta and, in this way, confers robustness. We show that C. hirsuta AP1 fails to complement this function of A. thaliana AP1, conferring variable petal number, and that upstream regulatory regions of AP1 contribute to this divergence.
Results
Petal number variation in C. hirsuta flowers
The flowers of A. thaliana and other Brassicaceae species are readily distinguished by their four petals. This phenotype is robust to natural genetic variation; for example, flowers from genetically diverse A. thaliana accessions consistently produce four petals (Figure 1a). C. hirsuta lacks this robustness and shows variation in petal number. For example, we found similar frequencies of each petal number between zero and four in flowers from 39 C. hirsuta accessions sampled from across the species range (Figure 1b) (Hay et al., 2014). Therefore, petal number varies within C. hirsuta and is a species-level trait that distinguishes C. hirsuta from A. thaliana.
Figure 1. Petal number is robust in A. thaliana and variable in C. hirsuta.
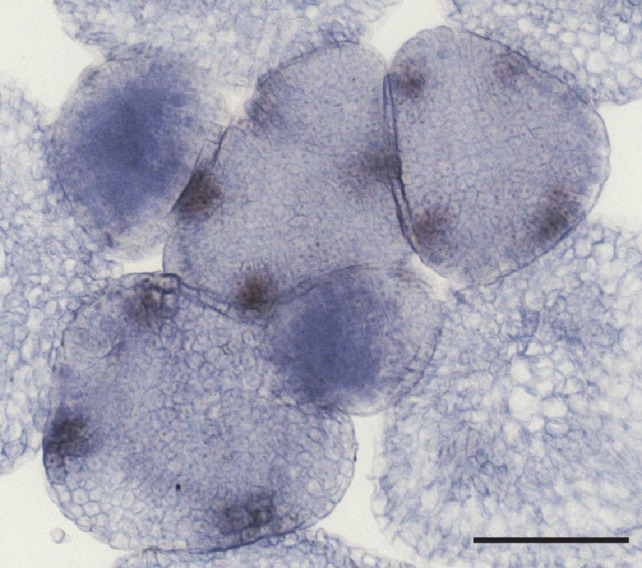
Four-petalled A. thaliana flower compared with C. hirsuta flowers containing 0, 1, 2, 3 or 4 petals. (a, b) Histograms showing petal number on the x-axis and frequency of flowers of the y-axis for (a) 17 A. thaliana accessions (n = 3725 flowers from 149 plants) and (b) 39 C. hirsuta accessions (n = 3362 flowers from 143 plants). (c, e) Scanning electron micrographs of stage eight flowers with covering sepals dissected away to show medial stamen primordia and small petal primordia (dashed circles) present in A. thaliana (c) and absent in C. hirsuta (e). (d, f) Longitudinal sections of stage eight flowers showing small petal primordia present in A. thaliana (d) and absent in C. hirsuta (f). Abbreviations: pe, petal; st, stamen. Scale bars: 20 µm (c–f).

Figure 1—figure supplement 1. Scanning electron micrograph of a C. hirsuta stage eight flower.
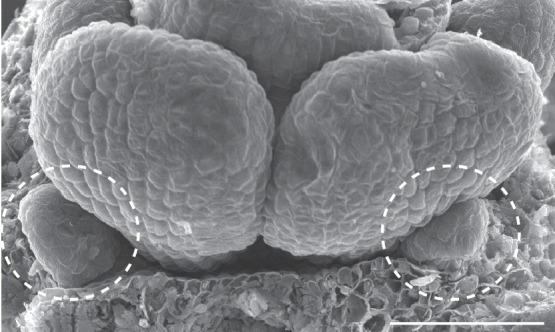
Figure 1—figure supplement 2. Petal position in C. hirsuta flowers (n = 144 flowers, flower numbers 1 – 25).

Petals initiate in the second whorl of A. thaliana and C. hirsuta flowers, each positioned between two outer sepals, with the inner whorls being occupied by male and female reproductive organs (stamens and carpels) (McKim et al., 2017; Smyth et al., 1990). Small petal primordia are readily observed in the second whorl of A. thaliana floral buds, located between first-whorl sepals and third-whorl stamens (Figure 1c,d). In contrast to this, petal primordia were often missing in C. hirsuta flowers at similar developmental stages (Figure 1e). Instead, we observed a flat surface in the second whorl with no indication of outgrowths (Figure 1f). However, when we found petal primordia in C. hirsuta flowers, their development appeared indistinguishable from those in A. thaliana (Figure 1—figure supplement 1). These petals occupied any of the four positions available in the second whorl, with a slightly higher frequency in abaxial positions (Figure 1—figure supplement 2). Therefore, the number of petals in a C. hirsuta flower is determined at early stages of petal initiation and outgrowth.
Auxin activity maxima fail to form in whorl two of C. hirsuta floral meristems
To study the earliest stages of petal initiation, we tracked floral meristem development using time-lapse confocal laser scanning microscopy and analysed growth in these 4-dimensional image stacks (Barbier de Reuille et al., 2015). We followed the formation of auxin activity maxima during petal initiation in A. thaliana and C. hirsuta using the DR5::VENUS and DR5v2::VENUS auxin activity sensors (Barkoulas et al., 2008; Heisler et al., 2005; Liao et al., 2015). At sites of petal initiation in A. thaliana, auxin activity maxima formed in 2 – 3 epidermal cells on the floral meristem flank prior to growth of these cells (Figure 2a,b; 83% DR5::VENUS observation rate, Figure 2—figure supplement 1). However, in C. hirsuta, auxin activity maxima often failed to form on the floral meristem, and instead were either absent or aberrantly located in the first whorl between sepals (Figure 2c,d; 36% DR5v2::VENUS observation rate, Figure 2—figure supplement 1). Therefore, four sites of petal initiation are usually marked by auxin activity maxima in the second whorl of the floral meristem in A. thaliana, but not C. hirsuta.
Figure 2. Auxin activity maxima fail to form in whorl two of C. hirsuta floral meristems.
(a–d) Heat maps of change in relative cell area of floral primordia over 24 hr of growth (a, c) and surface projections of DR5::VENUS expression (b, d) in A. thaliana (a, b) and C. hirsuta (c, d). Colour bars: percentage increase (warm colours) and decrease (cool colours) of cell area (a, c) and signal intensity (yellow) in arbitrary units (b, d). Dashed circles indicate expression maxima that correspond to initiating petals. Floral primordia are shown in side view facing a lateral sepal. (e) Beeswarm plot of average petal number in A. thaliana ptl-1 (n = 149 flowers, 10 plants) and ptl-1; AtPTL::AtPTL:YFP (n = 266 flowers, 19 independent insertion lines), and C. hirsuta Ox (n = 145 flowers, 10 plants) and AtPTL::AtPTL:YFP (n = 110 flowers, eight independent insertion lines). Red lines indicate means. (f, g) CLSM projections showing AtPTL::AtPTL:YFP expression (yellow) in the regions between sepals in stage 3–4 flowers of C. hirsuta (f) and A. thaliana (g). (h) C. hirsuta ag flower. (i) Barplot of mean petal number in whorls 2 and 3 of C. hirsuta ag flowers (n = 136 flowers, four plants). Note that mean stamen number is distributed between 4 – 5 in C. hirsuta, reflecting variation in lateral stamen number (Hay et al., 2014), and third whorl petals show similar variation in ag. (j) Relative expression of C. hirsuta AP1 in floral organs pooled from whorls 1, 2 (w1/w2) and whorls 3, 4 (w3/w4), in Ox compared to ag flowers, determined by quantitative RT-PCR and reported as means of three biological replicates (Student’s t-test: p<0.001). Error bars represent s.e.m. Scale bars: 20 μm (a–d, f–g), 0.5 mm (h).

Figure 2—figure supplement 1. CLSM time-lapse series of DR5::VENUS in A. thaliana and DR5v2::VENUS in C. hirsuta flowers.

Figure 2—figure supplement 2. Representative flowers.

Figure 2—figure supplement 3. In situ hybridization of C. hirsuta PTL.
The ptl mutant in A. thaliana mimics the variable petal number found in C. hirsuta and shows a similar distribution of auxin activity during petal initiation as wild-type C. hirsuta (Figure 2d) (Griffith et al., 1999; Lampugnani et al., 2013). Therefore, we tested whether differences in PTL function could explain why petal number is robust in A. thaliana but variable in C. hirsuta. A functional fusion protein of A. thaliana PTL (AtPTL::AtPTL:YFP) was sufficient to restore four petals in the ptl mutant, but did not alter petal number when expressed in C. hirsuta (Figure 2e; Figure 2—figure supplement 2). Given that AtPTL::AtPTL:YFP expressed correctly in the regions between sepals in C. hirsuta and A. thaliana flowers (Figure 2f,g), similar to the endogenous PTL transcripts in C. hirsuta and A. thaliana (Figure 2—figure supplement 3) (Brewer et al., 2004; Lampugnani et al., 2012; Lampugnani et al., 2013), these results indicate that differences in PTL function are unlikely to account for the variation in petal number between C. hirsuta and A. thaliana.
Petals are defined by both their identity and position within a flower. To test whether the variable number of petals in C. hirsuta is dependent on their identity or on the location where they arise in the second whorl, we used the homeotic mutant agamous (ag), to alter floral organ identity. In C. hirsuta ag mutants, four petals replaced the four stamens normally found in the third whorl of wild-type flowers, while petal number remained variable and lower than four in the second whorl (Figure 2h,i). This means that floral organs with petal identity show no variation in number if they arise outside the second whorl. As predicted by the ABC model (Coen and Meyerowitz, 1991), we found AP1 ectopically expressed in third whorl petals of ag mutants in C. hirsuta (Figure 2j). Therefore, ectopic expression of AP1 is associated with an invariant number of petals, whereas endogenous AP1 expression in whorl two of the C. hirsuta floral meristem is associated with variable petal number.
A. thaliana AP1 confers robust petal number in C. hirsuta and masks natural variation
We reasoned that AP1 might be a good candidate to contribute to petal number variation in C. hirsuta, particularly given that ap1 mutants in both C. hirsuta and A. thaliana show variable petal loss (Bowman et al., 1993; Monniaux et al., 2017). To test this possibility, we used a genomic construct of A. thaliana AP1 (AtAP1::AtAP1:GFP (Urbanus et al., 2009)), which was sufficient to restore four petals in the ap1 mutant (Mann-Whitney U test, p=1.07e-06) and eliminate the ectopic flowers that characterize the partial loss of floral meristem identity of ap1 mutants (Mann-Whitney U test, p=2.92e-06; Figure 3a–c). We found that this transgene was sufficient to convert C. hirsuta petal number from variable to robust, elevating petal number towards the A. thaliana value of four petals (pairwise Mann-Whitney U test with Bonferroni correction, p=2.4e-08; Figure 3a,d,e). In contrast to this, the distribution of petal number remained variable in C. hirsuta lines expressing the endogenous AP1 locus (ChAP1::ChAP1:GFP; pairwise Mann-Whitney U test with Bonferroni correction, p=0.07: Figure 3a). This suggests that the function of the endogenous AP1 locus to confer four petals is attenuated in C. hirsuta. Therefore, divergence in AP1 function likely contributed to the variation in petal number between A. thaliana and C. hirsuta.
Figure 3. A. thaliana AP1 confers robust petal number in C. hirsuta and masks natural variation.
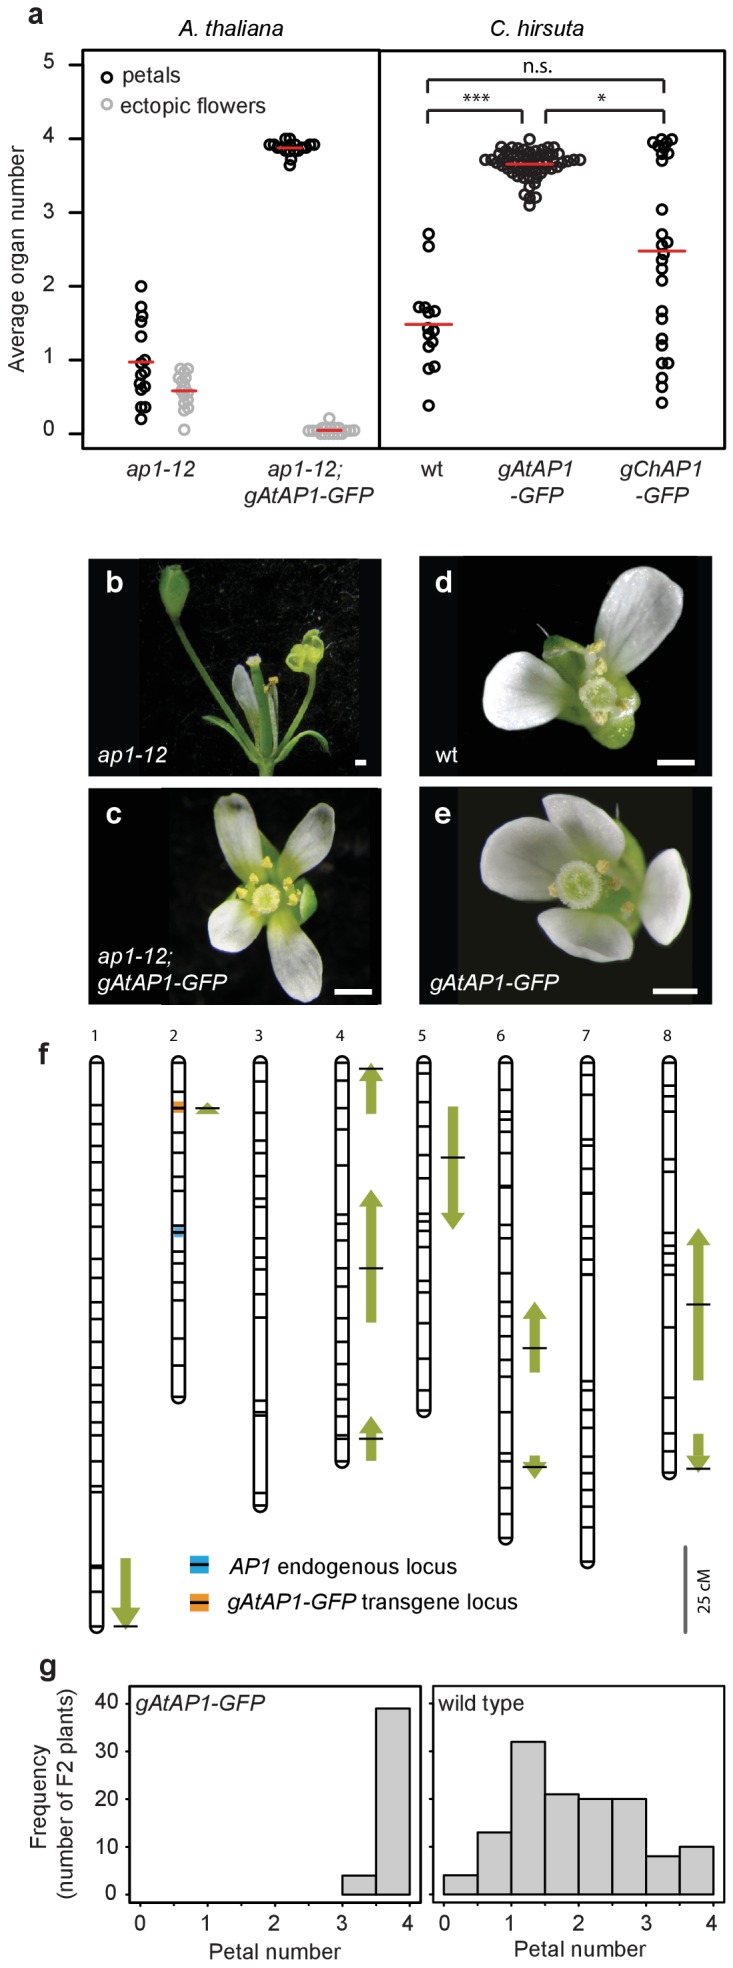
(a) Beeswarm plot of average petal number (black) and average number of ectopic flowers (grey) in A. thaliana ap1-12 (n = 375 flowers, 15 plants) and ap1-12; gAtAP1-GFP (AtAP1::AtAP1:GFP; n = 472 flowers, 19 plants, two independent insertion lines), and average petal number (black) in C. hirsuta wild-type (wt; n = 331 flowers, 14 plants), gAtAP1-GFP (n = 1286 flowers, 57 plants, five independent insertion lines) and gChAP1-GFP (ChAP1::ChAP1:GFP) (n = 628 flowers, 26 plants, two independent insertion lines). Red lines indicate means. Differences between C. hirsuta genotypes assessed by pairwise Mann-Whitney U test with Bonferroni correction: ***p=2.4e-08; *p=0.015; n.s. p=0.07. (b–e) Representative flowers of A. thaliana ap1-12 (b), ap1-12; gAtAP1-GFP (c), and C. hirsuta wild type (d), gAtAP1-GFP (e). Scale bars: 0.5 mm. (f) QTL for average petal number detected in the C. hirsuta Ox gAtAP1-GFP × Nz F2 mapping population are shown as arrows on the 8 chromosomes of the genetic map. Positions with the most significant effects are indicated by horizontal black lines and the length of the arrows is scaled to the 2(Log(p)) interval for each QTL. Arrow direction indicates whether the Ox allele for each QTL increases (upward pointing) or decreases (downward pointing) petal number. Positions of the AP1 endogenous locus (blue line) and the gAtAP1-GFP transgene (orange line) are indicated on the genetic map. Scale bar: 25 cM. (g) Distribution of average petal number in plants of the Ox × Nz F2 population that segregate homozygous for the gAtAP1-GFP transgene (left histogram) or without the transgene (right histogram).
This raises the question whether petal number variation both between and within species may be caused by similar genetic changes. If AP1 divergence contributed to petal number variation between species, do AP1 polymorphisms contribute to this phenotype within C. hirsuta? To address this question, we inspected the locations of petal number QTL previously identified in five mapping populations derived from bi-parental crosses of different C. hirsuta accessions (Pieper et al., 2016), and an additional population constructed in this study (Figure 3f). We found that none of the QTL mapped to the AP1 locus, which was represented by a specific genetic marker on chromosome 2 (Figure 3f, Table 1) (Pieper et al., 2016). Therefore, allelic variation at AP1 does not contribute to the quantitative variation in petal number mapped in C. hirsuta.
Table 1. A. thaliana AP1 masks the effects of C. hirsuta petal number QTL.
| QTL | Chromosome | Position | QTL effects | |||
|---|---|---|---|---|---|---|
| (cM) | Wild-type plants |
gAtAP1
homozygous plants |
||||
| additive | dominance | additive | dominance | |||
| Q1 | 1 | 147.8 | −0.18 | 0.28 | - | - |
| Q2 (gAtAP1) | 2 | 11.9 | n.a. | n.a. | n.a. | n.a. |
| Q3 | 4 | 1.6 | - | 0.32 | - | - |
| Q4 | 4 | 53.9 | −0.19 | - | - | - |
| Q5 | 4 | 98.6 | −0.33 | - | - | - |
| Q6 | 5 | 25.7 | 0.28 | - | - | - |
| Q7 | 6 | 74.8 | −0.28 | - | - | - |
| Q8 | 6 | 116.6 | 0.82 | - | - | - |
| Q9 | 8 | 63.5 | −0.27 | - | - | - |
| Q10 | 8 | 105.6 | 0.38 | - | - | - |
n.a. – not available because the effects of all other QTL were determined conditional on zygosity at this QTL. '– '– No significant effect.
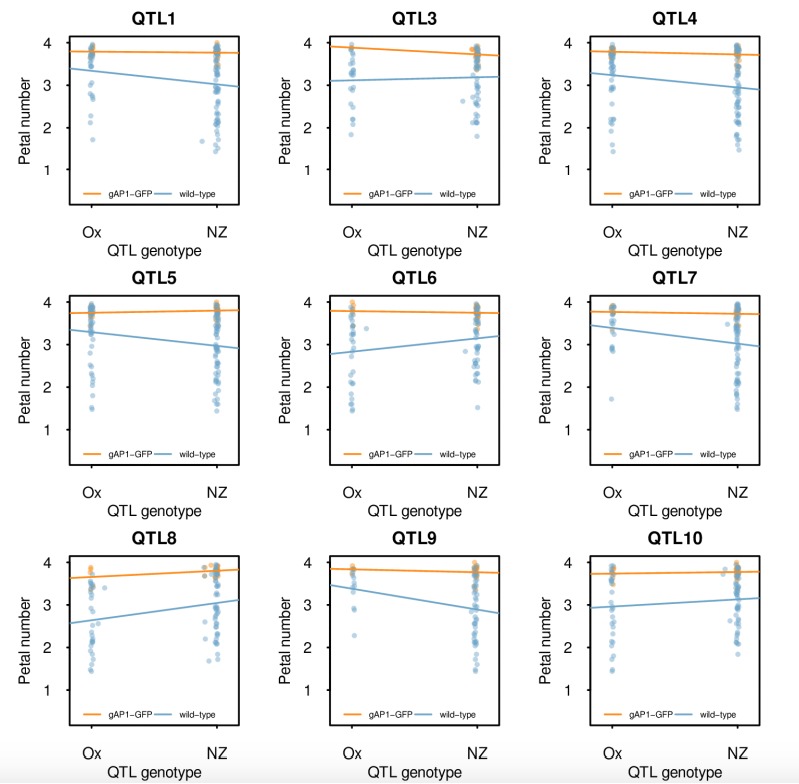
However, an alternative possibility is that AP1 divergence indirectly caused petal number to vary within C. hirsuta by altering the robustness of this phenotype to genetic variation. Given that petal number is a canalized trait in A. thaliana and robust to genetic variation (Figure 1a), we hypothesized that AP1 divergence may have decanalized petal number in C. hirsuta, giving phenotypic expression to formerly cryptic variation (Figure 1b) (Félix, 2007; Paaby and Rockman, 2014). A key prediction of this hypothesis is that A. thaliana AP1 should canalize petal number in C. hirsuta via epistatic interactions with petal number QTL. We tested this genetic prediction in an F2 population created by crossing C. hirsuta Ox containing the A. thaliana AP1 genomic locus (AtAP1::AtAP1:GFP), with the Nz accession (Figure 3f). We detected nine petal number QTL in addition to the A. thaliana AP1 transgene locus (Table 1, Figure 3f). Strikingly, the allelic effects of these 9 QTL were undetectable in the presence of the A. thaliana AP1 genomic locus (Table 1). This epistasis was readily observed in the distribution of petal number between plants homozygous for the A. thaliana AP1 transgene, which had four petals, and plants that lacked the transgene, which had variable petal number (Figure 3g). Thus, A. thaliana AP1 canalized C. hirsuta petal number by masking the phenotypic effects of at least 9 QTL.
Changes in AP1 expression contribute to species-specific petal number
Our findings suggest that the AP1 genes from A. thaliana and C. hirsuta may have a differential ability to confer four petals. To test whether or not C. hirsuta AP1 could fully complement the function of A. thaliana AP1, we introduced a ChAP1::ChAP1:GFP transgene into an ap1 mutant background in A. thaliana. Rather than restoring four petals like ap1-12; AtAP1::AtAP1:GFP (Figure 3a), we found that the distribution of petal number remained variable in ap1-12; ChAP1::ChAP1:GFP flowers (homogeneity of variance accepted by Levene’s test, p=0.282; Figure 4a,b), mimicking the variable petal number found in C. hirsuta. Petal number varied between zero and four, and the average petal number was significantly lower in ap1 plants expressing the AP1 genomic clone from C. hirsuta rather than A. thaliana (Figures 3a and 4a,b, Mann-Whitney U test p=2.08e-07). In contrast, ChAP1::ChAP1:GFP expression was sufficient to reduce the ectopic flowers in ap1 mutants (Figure 4b), indicating that AP1 divergence between C. hirsuta and A. thaliana affected petal number independently of floral meristem identity. Therefore, the results of these gene swaps indicate that C. hirsuta AP1 has a reduced ability to promote four petals when compared to A. thaliana AP1.
Figure 4. AP1 divergence contributes to species-specific petal number.
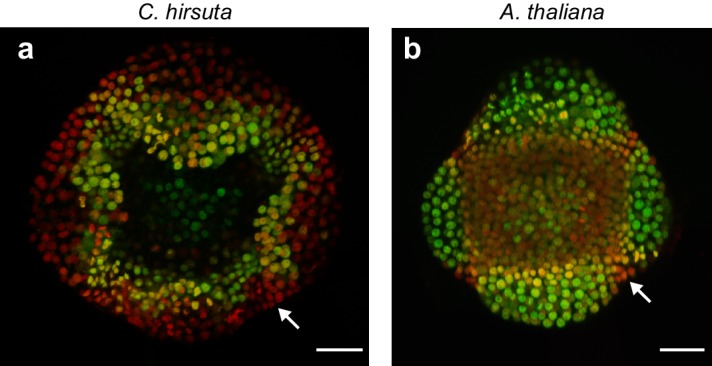
(a) A. thaliana flowers of ap1-12; gChAP1-GFP (ChAP1::ChAP1:GFP) genotype. (b) Beeswarm plot of average petal number (black) and average number of ectopic flowers (grey) in A. thaliana wild-type (n = 369 flowers, 15 plants), ap1-12 (n = 375 flowers, 15 plants) and ap1-12; gChAP1-GFP (n = 598 flowers, 25 plants, two independent insertion lines). Red lines indicate means. Levene’s test showed that the variance in petal number differed between wild-type and ap1-12 (***p=5.588e-05) and wild-type and ap1-12; gChAP1-GFP (**p=0.005823), but not between ap1-12 and ap1-−12; gChAP1-GFP (p=0.282). (c) Beeswarm plot of average petal number in A. thaliana ap1-12 plants either untransformed or transformed with chimeric AP1 constructs comprising the promoter sequences from either AtAP1 (A. thaliana) or ChAP1 (C. hirsuta) and the cDNA sequences from either AtAP1 or ChAP1. A two-way ANOVA test on ranked data showed a significant effect of promoter sequence on petal number (p=9.45e-08) but no effect of coding sequence (p=0.103) and no interaction effect between the promoter and coding sequences (p=0.258). Post-hoc Tukey's HSD tests showed that AP1 constructs containing the A. thaliana promoter had significantly higher petal number than those containing the C. hirsuta promoter, and all transgenic genotypes had higher petal number than ap1-12 at 0.05 level of significance. ap1-12: n = 375 flowers, 15 plants; ap1-12; pAtAP1::AtAP1: n = 1454 flowers, 37 plants, 10 independent insertion lines; ap1-12; pAtAP1::ChAP1: n = 1414 flowers, 36 plants, nine independent insertion lines; ap1-12; pChAP1::AtAP1: n = 986 flowers, 25 plants, five independent insertion lines; ap1-12; pChAP1::ChAP1: n = 717 flowers, 18 plants, five independent insertion lines. (d) Beeswarm plot of relative AP1 expression levels in inflorescences of C. hirsuta transgenic lines of gChAP1-GFP (black) and gAtAP1-GFP (orange) with 2 or four transgene copies. AP1 expression is quantified by qRT-PCR in three biological replicates of each sample and expressed relative to AP1 expression in wild-type inflorescences (dashed line). Relative AP1 expression is higher for gAtAP1-GFP lines, both for two (Student’s t-test, p<0.01) and four (p<0.05) transgene copies. n = 26 plants from six independent insertion lines for gAtAP1-GFP; n = 24 plants from five independent insertion lines for gChAP1-GFP. (e–f) Surface projections showing nuclear expression (green) of gAtAP1-GFP (d) and gChAP1-GFP (e) in stage 4 C. hirsuta flowers viewed from the lateral sepal. The dashed circle indicates the petal initiation domain on the floral meristem. (g) Boxplot of the size of inter-sepal regions (Physical) and the extent of AP1 expression along these transects into whorl 2 (AP1 expr) in C. hirsuta stage four floral meristems of gAtAP1-GFP and gChAP1-GFP. Size of the AP1 expression domain differs significantly between genotypes (Wilcoxon test, p<0.001; n = 7 samples each genotype) but physical size does not (p=0.44). Box and whiskers: quartiles, circles: outliers, black lines: median. Scale bars: 0.5 mm (a), 20 µm (e, f).

Figure 4—figure supplement 1. Quantification of ectopic flowers produced by chimeric AP1 constructs complementing A. thaliana ap1-12.
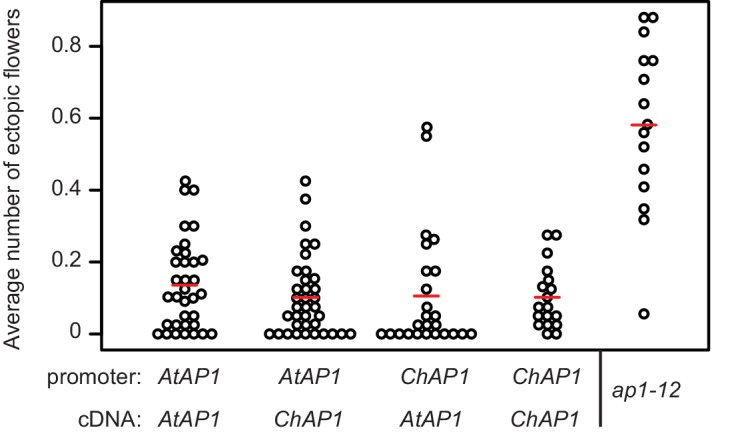
Figure 4—figure supplement 2. Example of a time-lapse series for AtAP1::AtAP1:GFP and ChAP1::ChAP1:GFP flowers in C. hirsuta.

Figure 4—figure supplement 3. Quantitative image analysis of C. hirsuta stage-4 flower meristems expressing AtAP1::AtAP1:GFP.

Figure 4—figure supplement 4. Measurements of the physical boundary size and the AP1 expression boundary size (as defined in Figure 4—figure supplement 3) in 7 samples of AtAP1::AtAP1:GFP and ChAP1::ChAP1:GFP stage-4 flowers in C. hirsuta.

Figure 4—figure supplement 5. Variability of measurements of the physical boundary size and the AP1 expression boundary size, as defined in Figure 4—figure supplement 3.

Figure 4—figure supplement 6. Measurements of the lateral and median lengths of the flower and of the meristem, and the meristem area (as defined in Figure 4—figure supplement 3) in 7 samples of AtAP1::AtAP1:GFP and ChAP1::ChAP1:GFP stage-4 flowers in C. hirsuta.

Figure 4—figure supplement 7. CLSM projections of C. hirsuta (a) and A. thaliana (b) stage four flowers co-expressing gAtAP1-GFP (green) and gChAP1-RFP (red).
Next, we considered the relative contributions of regulatory and coding sequences to this species-specific difference in AP1 function. To address this question, we expressed endogenous and chimeric versions of A. thaliana and C. hirsuta AP1, swapping the promoter and coding sequences, in an ap1 mutant background in A. thaliana. We found that petal number was significantly elevated by the A. thaliana AP1 promoter, compared to the C. hirsuta AP1 promoter, irrespective of the AP1 coding sequence driven by these promoters (Figure 4c). Whereas all constructs functioned equivalently to rescue the ectopic flowers found in ap1 mutants (Figure 4—figure supplement 1). Therefore, functional differences in AP1 that are responsible for petal number variation between A. thaliana and C. hirsuta, are more likely to reside in regulatory regions of the gene rather than coding sequences.
Species-specific AP1 expression
Since upstream regulatory regions contributed to AP1 divergence, we investigated whether expression differed between C. hirsuta and A. thaliana AP1. We reasoned that the reduced function of C. hirsuta AP1 to promote four petals may reflect reduced levels of gene expression. To test this prediction, we compared AP1 expression between C. hirsuta lines with matched copy numbers of either AtAP1::AtAP1:GFP or ChAP1::ChAP1:GFP transgenes, and found that expression levels were significantly lower in floral tissues of ChAP1::ChAP1:GFP than AtAP1::AtAP1:GFP lines (Figure 4d). To visualize the spatiotemporal dynamics of expression, we localized AP1::AP1:GFP fusion proteins from each species in the four-dimensional context of the growing C. hirsuta flower (Figure 4—figure supplement 2). In stage four floral buds, we observed A. thaliana AP1::AP1:GFP nuclear signal in the sepal whorl and on the flanks of the floral meristem, in the small regions where petals initiate in whorl two (Figure 4e). In contrast to this, C. hirsuta AP1::AP1:GFP was essentially restricted to the sepal whorl throughout stages 4 and 5 (Figure 4f, Figure 4—figure supplement 2). Using top-view, two-dimensional snapshots of these curved surface images, we measured how far the AP1::AP1:GFP signal extended into whorl two in each transgenic line (Figure 4—figure supplements 3–5). We found that the expression of A. thaliana AP1::AP1:GFP extended significantly further than C. hirsuta AP1::AP1:GFP (approximately 5 µm, Figure 4g). Moreover, we found no significant change in size or geometry between flowers expressing either the A. thaliana or C. hirsuta AP1 genomic constructs (Figure 4g, Figure 4—figure supplement 6). This contrasts with the changes in growth and maturation of floral buds that are associated with the regulation of C. hirsuta petal number by seasonal changes in temperature (McKim et al., 2017). Therefore, the expression domain of ChAP1::ChAP1:GFP is reduced compared to AtAP1::AtAP1:GFP, comprising fewer cells in the petal whorl on the flanks of the floral meristem in C. hirsuta.
By co-localizing the expression of both AtAP1::AtAP1:GFP and ChAP1::ChAP1:RFP in stage 4 flowers of C. hirsuta and A. thaliana, we also found that C. hirsuta AP1::AP1:RFP expression is enriched in the regions between sepals (Figure 4—figure supplement 7). Since peaks of auxin activity are displaced away from the petal whorl to the region between sepals in C. hirsuta flowers (Figure 2d), and since distortions of this region have been shown to influence petal initiation in A. thaliana (Baker et al., 2005; Lampugnani et al., 2012; Lampugnani et al., 2013; Laufs et al., 2004; Mallory et al., 2004), the enrichment of C. hirsuta AP1 in this domain might be relevant for petal number variation in C. hirsuta.
Maintaining variable petal number in C. hirsuta
Our findings suggest that petal number is a robust phenotype in A. thaliana that became decanalized in C. hirsuta, such that AP1 divergence allowed previously cryptic loci to quantitatively affect petal number. Allelic variation at these QTL maintains the distribution of petal numbers found among natural accessions of C. hirsuta (Pieper et al., 2016). A striking feature of this distribution is the absence of natural accessions with four petals (Figure 5a). Moreover, few accessions have an average petal number approaching four (Figure 5a). To explore the genetic basis of this phenotypic distribution, we constructed experimental populations from founder accessions with phenotypes close to the mean (arrowheads, Figure 5a). These recombinant inbred populations contained a high frequency of lines with high average petal numbers, including four petals (Figure 5b, and other examples in (Pieper et al., 2016)). This shows that there is sufficient standing genetic variation to produce phenotypes through recombination that are not observed in natural accessions.
Figure 5. Petal number distributions differ between natural and experimental populations of C. hirsuta and outcrossing frequency associates with petal number.
(a–b) Distributions of C. hirsuta petal number in 45 natural accessions (a) and a population of RILs derived from Ox and Wa accessions (b, reproduced from (Pieper et al., 2016)). Mean petal number of Ox and Wa are indicated in (a). (c) Average petal number (±s.e.m.) at every floral node in homozygous wild-type and fp2 plants (genotyped at SNP:2:2905982) in field conditions (n = 10 plants from each genotype). Flowers 1–10 were removed from every plant (indicated by dashed line) since petal number in these flowers did not differ significantly between genotypes (p>0.05, Mann-Whitney U test). Seeds produced from remaining flowers on the main inflorescence were harvested. (d) Progeny of 10 wild-type and 10 fp2 mothers were genotyped at SNP:2:2905982 to determine their paternity (n = 1703 wild-type and 1610 fp2 seedlings). Pollination events were considered as selfing when the genotype of the progeny corresponded to the maternal genotype; outcrossing when the genotype of the progeny was heterozygous; and contaminant when the genotype of the progeny corresponded to the other parental genotype. These were likely seed contaminants from the outside of collection bags. Rates of outcrossing were significantly different between genotypes, p<0.05, whereas rates of contaminations were not p>0.05 (Chi-square test with Yates’ continuity correction). Moreover, outcrossing and contaminations per parent plant were not correlated (r2 = 0.025), suggesting that they are independent events.

Figure 5—figure supplement 1. Measurement of fitness traits in wild-type (Ox) and AtAP1::AtAP1:GFP plants.

Figure 5—figure supplement 2. Field experiment to paternity-test progeny of C. hirsuta wild-type and four petals2 (fp2) genotypes.

To explore this finding, we reasoned that producing four-petalled flowers could incur an energetic cost. However, in standard growth conditions, we could not detect any difference in seed output between C. hirsuta wild-type and AtAP1::AtAP1:GFP plants that differed in petal number (Figure 5—figure supplement 1). Alternatively, variable petal number could be the cause or consequence of variation in other trait(s) that contribute to maintaining petal number within its variable range. Given that petals are responsible for the opening of most flowers (van Doorn and Van Meeteren, 2003), thus allowing cross-pollination, we tested whether petal number was associated with outcrossing rate in C. hirsuta. Using field conditions to grow two genotypes that differed significantly in petal number (2.65 ± 0.08 vs 3.45 ± 0.05, Mann-Whitney U test p<0.001; Figure 5c, Figure 5—figure supplement 2), we paternity-tested the progeny of these plants and found a significantly higher outcrossing rate in the genotype with higher petal number (Chi-square test p<0.05, Monte-Carlo permutation test p<0.001, Figure 5d, Figure 5—figure supplement 2). Therefore, outcrossing frequency is associated with petal number in C. hirsuta.
Discussion
In this study, we identified AP1 as a gene of major effect in the evolutionary transition from a robust phenotype of four petals, typified by A. thaliana, to a variable petal number in C. hirsuta. Despite this large effect, AP1 polymorphisms do not contribute directly to within-species variation in C. hirsuta petal number. Instead, the decanalization of petal number in C. hirsuta involved regulatory changes in AP1 that relaxed its epistasis over alleles that cause petal number to vary. Therefore, our results suggest that AP1 divergence likely exposed cryptic genetic variation in C. hirsuta that contributes directly to maintaining variable petal number within natural accessions of C. hirsuta.
AP1 is an important regulator of A. thaliana flower development, acting early to initiate flowers and later to specify floral organs (Bowman et al., 1993; Irish and Sussex, 1990; Mandel et al., 1992). It functions predominantly as a transcriptional repressor during floral initiation and later as an activator during sepal and petal initiation, and has been described as a ‘true hub’ in the gene regulatory network that initiates flower development (Kaufmann et al., 2010). We found that AP1 genes from A. thaliana and C. hirsuta diverged in their ability to specify an invariant number of four petals. This difference mapped broadly to upstream regulatory rather than coding regions of AP1, and did not alter the function of AP1 in flower initiation or sepal specification; suggesting that regulatory sequence divergence can disable specific linkages in gene regulatory networks while maintaining pleiotropic functions in other tissues (Rebeiz and Tsiantis, 2017).
We showed that differences in AP1 expression are associated with the functional divergence in AP1 between A. thaliana and C. hirsuta. Specifically, C. hirsuta AP1 transcript levels are reduced in floral tissues and protein abundance is reduced in the small regions of stage four flowers where petals initiate. Robustness to variation in developmental systems is often a consequence of nonlinear dose-response curves between gene activity and phenotype (Félix and Barkoulas, 2015). For example, vulva development in Caenorhabditis elegans is robust to genetic variation in lin-3 expression, such that 15–50 lin-3 mRNA molecules defines a robust range that allows wild-type cell fate patterning, bounded by two thresholds, beyond which the phenotype varies (Barkoulas et al., 2013). We propose that the expression of A. thaliana AP1 defines a robust range where petal number is buffered against perturbations (Figure 6a). C. hirsuta AP1 is expressed below this threshold, such that petal number varies in response to genetic, environmental, and stochastic perturbations (Figure 6a) (McKim et al., 2017; Monniaux et al., 2016; Pieper et al., 2016).
Figure 6. Cartoons depicting the proposed role of AP1 in phenotypic buffering and canalization.

(a) Non-linear relationship between AP1 expression and petal number (black line). The range of AtAP1 expression (orange) is within a zone of high phenotypic robustness, while the range of ChAP1 expression (brown) is outside of this robust zone, such that petal number is sensitive to perturbations. (b) Left: decanalization of petal number in C. hirsuta from an invariant phenotype of four petals, typified by A. thaliana. AP1 divergence (orange arrow) allowed phenotypic expression of QTL (blue arrows) in the C. hirsuta genome to quantitatively affect petal number. Right: cartoons of Waddington’s landscape depicting petal number as a canalized phenotype in A. thaliana (ball rolls down path of least resistance shaped by canals in the landscape); this landscape is underpinned by a genetic network including AP1 (orange rope) and QTL (blue ropes). Decanalization of petal number in C. hirsuta involved regulatory changes in AP1 (cut orange rope) that relaxed its epistasis over QTL that cause petal number to vary (deformations in the landscape). Based on (Waddington, 1957; Paaby and Rockman, 2014).
Waddington’s model of canalization invokes a similar concept of phenotypic buffering against natural variation. In his classical metaphor of marbles rolling down canals, he depicted the surface of the landscape being pulled down by guy ropes and fastened to anchors that represented genes (Waddington, 1957). Like this, the genetic underpinnings of the landscape may vary, but produce a consistent phenotype (e.g. A. thaliana petal number, Figure 6b) (Paaby and Rockman, 2014). Petal number is invariant among natural accessions of A. thaliana, reflecting its robustness to genetic variation. However, we could change A. thaliana petal number to variable by complementing ap1 mutants with the AP1 genomic locus from C. hirsuta. These flowers mimicked the variable petal number found in C. hirsuta, suggesting that there may be variability in the gene regulatory network controlling petal number in A. thaliana that is hidden beneath the uniformity of wild-type development.
In C. hirsuta, petal number is decanalized, such that natural genetic variation deforms Waddington’s landscape, producing a variable phenotype (Figure 6b). We mapped this natural variation to specific QTL in the C. hirsuta genome and showed that introducing the A. thaliana AP1 locus masked the effects of all QTL. Therefore, petal number was effectively canalized in C. hirsuta via epistasis of A. thaliana AP1 over existing QTL. Based on these results, we propose that AP1 divergence perturbed the genetic equilibrium in C. hirsuta that confers petal number robustness. Given the large effect of the A. thaliana AP1 locus on petal number, it is interesting that endogenous AP1 polymorphisms do not contribute directly to petal number variation in C. hirsuta. Rather, it is the ability of AP1 to exert epistasis over other loci that diverged between A. thaliana and C. hirsuta (Figure 6b). We propose that this change in genetic interactions was the likely mechanism by which cryptic variation was exposed in C. hirsuta, contributing to the evolution of variable petal number.
Materials and methods
Key resources table.
| Reagent type (species) or resource | Designation | Source or reference | Identifiers | Additional information |
|---|---|---|---|---|
| Gene (Cardamine hirsuta) | AP1 | Gan et al. (2016) | CARHR062020 | |
| Gene (C. hirsuta) | PTL | Gan et al. (2016) | CARHR209620 | |
| Gene (C. hirsuta) | AG | Gan et al. (2016) | CARHR225900 | |
| Gene (C. hirsuta) | Clathrin/AP2M | Gan et al. (2016) | CARHR174880 | |
| Biological sample (C. hirsuta) | Ox | Hay and Tsiantis (2006) | herbarium specimen voucher Hay 1 (OXF) | |
| Biological sample (Arabidopsis thaliana) | Col-0 | CS60000 | ||
| Genetic reagent (A.thaliana) | pDR5rev::3XVENUS-N7 | Heisler et al., 2005 | ||
| Genetic reagent (C. hirsuta) | pDR5rev::3XVENUS-N7 | Barkoulas et al., 2008 | ||
| Genetic reagent (C. hirsuta) | DR5-v2::3xVenus | Liao et al., 2015 | ||
| Genetic reagent (A.thaliana) | ap1-12 | N6232 | ||
| Genetic reagent (A.thaliana) | ptl-1 | N276 | ||
| Genetic reagent (C. hirsuta) | ag-1 | this paper | EMS mutant | |
| Genetic reagent (C. hirsuta) | fp2 | Pieper et al. (2016) | ||
| Genetic reagent (A.thaliana) | AtPTL::AtPTL:YFP | this paper | 2.9 kb genomic sequence of PTL | |
| Genetic reagent (A.thaliana) | AtPTL::AtPTL:YFP; ptl-1 | this paper | 2.9 kb genomic sequence of PTL | |
| Genetic reagent (C. hirsuta) | AtPTL::AtPTL:YFP | this paper | 2.9 kb genomic sequence of PTL | |
| Genetic reagent (A.thaliana) | AtAP1::AtAP1:GFP | Urbanus et al., 2009 | ||
| Genetic reagent (C. hirsuta) | AtAP1::AtAP1:GFP | Urbanus et al., 2009 | ||
| Genetic reagent (C. hirsuta) | ChAP1::ChAP1:GFP | Monniaux et al., 2017 | ||
| Genetic reagent (A. thaliana) | ChAP1::ChAP1:GFP; ap1-12 | Monniaux et al., 2017 | ||
| Genetic reagent (A. thaliana) | AtAP1::AtAP1:GFP; ap1-12 | Urbanus et al., 2009 | ||
| Genetic reagent (A. thaliana) | ChAP1::ChAP1:RFP; AtAP1::AtAP1:GFP | this paper | 6.6 kb genomic sequence of AP1 | |
| Genetic reagent (C. hirsuta) | ChAP1::ChAP1:RFP; AtAP1::AtAP1:GFP | this paper | 6.6 kb genomic sequence of AP1 | |
| Genetic reagent (A. thaliana) | pAtAP1::AtAP1; ap1-12 | this paper | 2.9 kb promoter sequence of AP1 driving AP1 cDNA | |
| Genetic reagent (A. thaliana) | pAtAP1::ChAP1; ap1-12 | this paper | 2.9 kb promoter sequence of AP1 driving AP1 cDNA | |
| Genetic reagent (A. thaliana) | pChAP1::ChAP1; ap1-12 | this paper | 2.9 kb promoter sequence of AP1 driving AP1 cDNA | |
| Genetic reagent (A. thaliana) | pChAP1::AtAP1; ap1-12 | this paper | 2.9 kb promoter sequence of AP1 driving AP1 cDNA | |
| Genetic reagent (C. hirsuta) | Ox gAtAP1-GFP × Nz F2 | this paper | 312 individuals used for QTL analysis | |
| Software | MorphoGraphX | Barbier de Reuille et al., 2015 |
Accession numbers and plant material
The wild-type genotype in C. hirsuta is the reference Oxford (Ox) accession, herbarium specimen voucher Hay 1 (OXF) (Hay and Tsiantis, 2006), and in A. thaliana, the reference Col-0 accession. DR5::VENUS transgenic lines in A. thaliana (Heisler et al., 2005) and C. hirsuta (Barkoulas et al., 2008) have been described previously. NASC accession numbers for A. thaliana mutants: ap1-12 (N6232), ptl-1 (N276). Additional A. thaliana and C. hirsuta accessions have been described previously (1001 Genomes Consortium. Electronic address: magnus.nordborg@gmi.oeaw.ac.at and 1001 Genomes Consortium, 2016; Hay et al., 2014). C. hirsuta genome assembly gene identifiers: ChAP1 (CARHR062020), ChPTL (CARHR209620), ChAG (CARHR225900), Clathrin/AP2M (CARHR174880) (Gan et al., 2016).
Plant growth conditions and petal number scoring
All plants were grown in long day conditions unless otherwise stated. Greenhouse: 16 hr light (22°C), 8 hr dark (20°C); controlled environment room long days: 16 hr light (21°C), 8 hr dark (20°C) and short days: 10 hr light (21°C), 14 hr dark (21°C); growth cabinet short days: 8 hr light (22°C), 16 hr dark (20°C). Petal number was generally scored on 10–15 plants from each genotype, except when scoring the T1 generation of transgenic lines. Flowers were scored every second day by removing them from the plant with tweezers, and observing them with a head band magnifier or stereo microscope. For the C. hirsuta ag mutant, flowers from four plants were removed every second day and scored with a binocular loop. Whorl one was removed to allow scoring of whorl two organs, which were then removed to score whorl three organs.
EMS mutagenesis and ag mutant isolation
C. hirsuta Ox seeds were mutagenized by agitation with ethyl methanesulfonate (EMS, Sigma), sown on soil, harvested as pools of five M1 plants, and M2 plants were screened for floral phenotypes as described previously (Pieper et al., 2016). The four petals 2 (fp2) (Pieper et al., 2016) and agamous (ag-1) mutants were isolated and backcrossed twice to Ox. The ag-1 sequence bears a C to T single nucleotide change predicted to convert a Gln residue to a stop codon and produce a truncated 33 AA protein. Expressing an AtAG:GFP translational fusion (gift from G. Angenent (Urbanus et al., 2009)) complemented the C. hirsuta ag-1 mutant phenotype.
Quantitative RT-PCR (qPCR) and transgene copy number determination
Five and ten flowers from one plant of C. hirsuta wild-type and ag-1, respectively, were pooled to generate one biological replicate for RNA extraction. Three biological replicates were generated per genotype. For quantification of AP1 expression levels in C. hirsuta AtAP1::AtAP1:GFP and ChAP1::ChAP1:GFP lines, a secondary inflorescence from 29 and 24 plants from five independent lines, respectively, was used for RNA extraction, together with three wild-type biological replicates. For these plants, transgene copy number was determined from genomic DNA by a Taqman qPCR assay using the Hygromycin resistance gene (IDna Genetics, Norwich, UK). RNA was extracted using Spectrum Plant Total RNA kit (Sigma) and DNA was digested by on-column DNase I digestion (Sigma). Reverse Transcription was performed with SuperScript III Reverse Transcriptase (ThermoFisher Scientific) using 1 µg of RNA template. Quantitative PCR was performed with the Power SYBR Green Master Mix (ThermoFisher Scientific) with the following primers: AP1-qPCR-F (5’- CCAGAGGCATTATCTTGGGGAAGACTTG) and AP1-qPCR-R (5’- GCTCATTGATGGACTCGTACATAAGTTGGT) to amplify either ChAP1 or AtAP1, and Clathrin-qPCR-F (5’- TCGATTGCTTGGTTTGGAAGATAAGA) and Clathrin-qPCR-R (5’- TTCTCTCCCATTGTTGAGATCAACTC) to amplify the reference gene Clathrin/AP2M. Expression was calculated with the ΔΔCt method (Pfaffl, 2001), normalized against the reference gene, and expressed relative to wild-type levels.
Transgenic plant construction
For the AtPTL::AtPTL:YFP construct, a 2.8 kb PTL promoter up to the second exon, driving functional PTL expression (Lampugnani et al., 2012), was amplified with primers pPTL-F (5’-ATATATTGAGAAGAGATTAAAAACTTAG) and pPTL-R (5’-GTATCCATGTTCCTCGGACA) from Col-0 genomic DNA and cloned into the multiSite Gateway donor vector pDONR-P4-P1R. The full 2.9 kb genomic sequence of PTL was amplified with primers gPTL-F (5’-ATGGATCAAGATCAGCATC) and gPTL-R (5’-CTGATTCTCTTCTTTACTGAGC) from Col-0 genomic DNA and cloned into the multiSite Gateway donor vector pDONR-221. The YFP coding sequence was cloned into the multiSite Gateway donor vector pDONR-P2R-P3. The AtPTL::AtPTL:YFP construct was created by recombining together the three previous vectors into the pGII-0229 destination vector, as described in the MultiSite Gateway manual (Thermo Fisher Scientific). Eight and nineteen independent lines of AtPTL::AtPTL:YFP were generated in C. hirsuta wild type and A. thaliana ptl-1 respectively. Petal number was scored on all independent lines in the T1 generation, together with C. hirsuta wild type and A. thaliana ptl-1.
Twenty independent lines of AtAP1::AtAP1:GFP (gift from G. Angenent (Urbanus et al., 2009)) were generated in C. hirsuta wild-type and A. thaliana ap1-12 backgrounds. This translational fusion contains a 6.6 kb genomic fragment of A. thaliana AP1 including 3 kb of regulatory sequence upstream of the translational start. ChAP1::ChAP1:GFP was previously described (Monniaux et al., 2017) and contains a comparable 6.6 kb genomic fragment of C. hirsuta AP1. Ten independent lines of ChAP1::ChAP1:GFP were generated in C. hirsuta wild type and A. thaliana ap1-12. For all the AP1-related lines, petal number was scored on 2 to 5 single-insertion homozygous T3 lines, together with wild-type C. hirsuta and A. thaliana ap1-12.
ChAP1::ChAP1:RFP was constructed in the modified destination vector pB7RWG2 (gift from M. Kater (Gregis et al., 2009)) by recombining the same C. hirsuta AP1 genomic fragment used above. Six independent lines were generated in A. thaliana AtAP1::AtAP1:GFP for co-localisation studies. Four independent lines were generated in C. hirsuta and selected for strong expression in the third generation. Homozygous plants were crossed to an AtAP1::AtAP1:GFP strong expressing line for co-localisation studies.
The pAtAP1::AtAP1, pAtAP1::ChAP1, pChAP1::AtAP1 and pChAP1::ChAP1 constructs were generated by three-fragment multi-site Gateway in the pGII-0227 destination vector. The AtAP1 and ChAP1 promoters contain 2.9 kb upstream of the start codon and were amplified with primers pAtAP1-F (5’- CGAACGTGGTGGTTAGAAGA) and pAtAP1-R (5’-TTTTGATCCTTTTTTAAGAAACTT), and primers pChAP1-F (5’-CATATAGCTTGGATCATGCTC) and pChAP1-R (5’-TTTGATCCTATTTTGAGAAACTTCTT) respectively. Ten independent lines, with five plants per line, were scored for petal and ectopic flower number together with A. thaliana wild type and ap1-12. Lines with a clear ap1-12 phenotype were considered not to be complemented by the transgene and were removed from the analysis.
The DR5-v2::3xVENUS plasmid was a gift from Dolf Weijers (Liao et al., 2015). Eleven independent insertion lines were generated in C. hirsuta wild type. All lines were checked for expression in the T1 generation and two representative lines were selected to image by time-lapse CLSM in the T2 generation.
All binary vectors were transformed into C. hirsuta or A. thaliana by Agrobacterium tumefaciens (strains GV3101 or C58)-mediated floral dip.
Scanning electron microscopy (SEM)
Shoot apices were induced to flower by a shift from short to long day conditions and fixed in FAA, post-fixed in osmium tetraoxide, dehydrated, critical point dried and dissected before coating with gold/palladium for viewing in a JSM-5510 microscope (JEOL). Floral primordia were staged according to (Smyth et al., 1990).
Confocal laser scanning microscopy (CLSM) and quantitative image analysis
Time-lapse imaging was performed using 4–5 week old plants grown on soil in long day conditions. The inflorescence was cut and flowers were dissected off to uncover young floral primordia at the shoot apex. Dissected shoots (around 0.5 cm long sections) were transferred to ½ MS medium supplemented with 1.5% plant agar, 1% sucrose and 0.1% Plant Preservative Mixture (Plant Cell Technology). To outline cells, samples were stained with 0.1% propidium iodide (PI, Sigma) for 2 – 5 min before each observation. Floral primordia were immersed in water and imaged from the top at 24 hr intervals. Confocal imaging was performed using a Leica SP8 up-right confocal microscope equipped with a long working-distance water immersion objective (L 40x/0.8 W) (Leica) and HyD hybrid detectors (Leica). Excitation was achieved using an argon laser with 514 nm for VENUS and PI. Images were collected at 526 – 545 nm for VENUS, and 600 – 660 nm for PI. Between imaging, samples were transferred to a growth cabinet and cultured in vitro in standard long day conditions at 20°C. Confocal image stacks of time-lapse series were analyzed using MorphoGraphX software (Barbier de Reuille et al., 2015; Kierzkowski et al., 2012). The outer 10 Full datasets of A. thaliana and C. hirsuta time-lapse series used to track growth and DR5::VENUS and DR5v2::VENUS expression shown in Figure 2—figure supplement 1. To measure physical boundary size and size of AP1-GFP expression, the epidermal (2 to 5 µm) GFP signal was projected on the surface of the sample with MorphoGraphX. Top-view snapshots of the flower meristem with GFP-projected signal were acquired and subsequently analyzed with FiJi (Schindelin et al., 2012) as described in Figure 4—figure supplement 3.
Histology and in situ hybridization
Shoot apices were induced to flower by a shift from short to long day conditions. Digoxigenin-labeled antisense RNA probes to C. hirsuta ChPTL were generated by mixing together three synthetic probes covering the whole ChPTL cDNA (GenScript HK Limited, USA). 8 – 10 µm inflorescence cross-sections were fixed, embedded in paraffin and hybridized with the ChPTL probe as previously described (Vlad et al., 2014). The signal was observed and images were acquired with a Zeiss AxioImager.M2 light microscope equipped with an Axiocam HR color camera. To cover the entire hybridization pattern in depth, images of two consecutive sections were registered and minimal projections generated using the image processing package Fiji (Schindelin et al., 2012). Cropping, gamma and colour correction were done using Photoshop CS5 and performed on entire images only. For semi-thin sections, apices were fixed in 2.5% glutaraldehyde in phosphate buffer, dehydrated, step-wise infiltrated with and embedded in TAAB Low Viscosity resin (TAAB) and 1.5 μm sections were stained with 0.05% toluidine blue.
Quantitative trait locus (QTL) analysis
QTL analysis of petal number was performed on a C. hirsuta F2 population derived from a cross between an AtAP1::AtAP1:GFP transgenic line in the Ox accession and the Nz accession. Petal number was quantified in 312 individuals that were pre-screened by PCR amplification of the GFP sequence such that approximately 1/4 of the plants were wild-type. The first 25 flowers on each plant were removed on the day they opened and petal number was counted using a dissecting microscope. The 312 F2 plants were genotyped with 155 Sequenom markers (Welcome Trust Center for Human Genetics, High Throughput Genomics, Oxford, UK) designed to cover the whole genome according to an early version of the C. hirsuta genome assembly (Gan et al., 2016), and a dCAPS marker was generated for the C. hirsuta AP1 locus using primers AP1cisF1 (5’-TCCCTAAAACCGCTCTTAGC) and AP1cisR1 (5’-AGAGAGATAAAGAAGAGTTCAGGC) and the restriction enzyme AluI. The genetic map was made using JoinMap 4 (Van Ooijen, 2006), including the genotype for AtAP1::AtAP1:GFP as a dominant marker to determine the location of the transgene, and had a total length of 910 centiMorgans in eight linkage groups. QTL analyses were performed with Genstat 13th Edition (VSN International, Hemel Hempstead, UK) using all 312 F2 plants. Genetic predictors were calculated with a maximum distance of 2 cM between them from the molecular marker data and the genetic map. Average petal number per F2 plant was used as a phenotype for QTL analysis. Simple interval mapping and composite interval mapping were performed. The latter procedure was repeated several times while adding and/or removing cofactors until no further improvement could be made. The resulting set of 10 cofactors was used in a final QTL model to estimate QTL effects. A model with nine cofactors, when excluding the AtAP1::AtAP1:GFP locus, was fitted to data from F2 plants that were either homozygous for the AtAP1::AtAP1:GFP transgene or wild-type.
Field experiment and paternity testing of C. hirsuta wild type and four petals 2 (fp2)
Seeds from Ox and fp2 (Pieper et al., 2016) were stratified for 1 week at 4°C and sown on 15.03.2016 on hydrated Jiffy plugs. Seedlings were first grown in a greenhouse without temperature or light control, and later transferred to the field on 13.04.2016. More details on experimental design can be found in Figure 5 and Figure 5—figure supplement 2. Genomic DNA was extracted from parent and progeny plants with Edwards Buffer and isopropanol precipitation and amplified with primers m458 (5’-GCCTAATCTTGCACAACACGAAATCT) and m459 (5’-GATTCTAAAGTTCTGTCAAAAGGAGAAACCTGA), designed with dCAPS Finder (http://helix.wustl.edu/dcaps/dcaps.html), to genotype SNP:2:2905982 by dCAPS. PCR was performed with Mango Taq polymerase (Bioline) under the following conditions: initial denaturation of 5 min at 95°C, 40 cycles of 30 s at 95°C, 30 s at 56°C and 30 s at 72°C, final extension of 10 min at 72°C. 1/5th volume of the reaction was digested with 2.5 units of DdeI (New England Biolabs) for 2 hr at 37°C and migrated on a 3% agarose gel to resolve the uncut 141 bp amplicon for fp2, and the two cut fragments of 116 bp and 25 bp for Ox.
Fitness measurements
40 plants of C. hirsuta wild type and a homozygous T4 line of AtAP1::AtAP1:GFP were grown in a greenhouse with standard conditions (20°C, long days). 20 of these plants were scored for petal number, and the other 20 were bagged carefully to recover all seeds. A fraction of the seeds was counted and weighed with the seed analyser MARVIN (GTA Sensorik GmbH) and total seed number was estimated by proportionality with the total seed weight.
Acknowledgements
We thank M Tsiantis for sharing unpublished C. hirsuta accessions and for helpful discussions and continuous support throughout this work. We thank P Huijser and R Berndtgen for assistance with in situ hybridisation, C Rojas for assistance with field experiments, W Faigl, G Angenent, M Kater, D Weijers and the Arabidopsis Biological Resource Center for materials, J Baker and M Kalda for photography, and S Laurent, M Abraham, and D Bailey for advice. This work was supported by Biotechnology and Biological Sciences Research Council grant BB/H01313X/1 to AH and Human Frontiers Science Program grant RGP0008/2013 to RS. AH was supported by a Royal Society University Research Fellowship and the Max Planck Society W2 Minerva programme, MM and SM by European Molecular Biology Organization Long Term Fellowships, SM by a National Science and Engineering Research Council of Canada Post-Doctoral Fellowship, and DK by Deutsche Forschungsgemeinschaft SFB 680 grant to M Tsiantis.
Funding Statement
The funders had no role in study design, data collection and interpretation, or the decision to submit the work for publication.
Contributor Information
Angela Hay, Email: hay@mpipz.mpg.de.
Christian S Hardtke, University of Lausanne, Switzerland.
Sheila McCormick, University of California-Berkeley, United States.
Funding Information
This paper was supported by the following grants:
Biotechnology and Biological Sciences Research Council BB/H01313X/1 to Angela Hay.
Human Frontier Science Program RGP0008/2013 to Richard S Smith.
Royal Society University Research Fellowship to Angela Hay.
Max-Planck-Gesellschaft W2 Minerva Fellowship to Angela Hay.
European Molecular Biology Organization Long Term Fellowship to Marie Monniaux, Sarah M McKim.
Natural Sciences and Engineering Research Council of Canada Post-Doctoral Fellowship to Sarah M McKim.
Additional information
Competing interests
No competing interests declared.
Author contributions
Investigation, Visualization, Writing—original draft, Writing—review and editing.
Investigation, Visualization, Writing—review and editing.
Investigation.
Investigation, Visualization.
Investigation.
Supervision, Funding acquisition.
Conceptualization, Supervision, Funding acquisition, Investigation, Writing—original draft, Project administration, Writing—review and editing.
Additional files
Data availability
All data generated or analysed during this study are included in the manuscript and supporting files.
References
- 1001 Genomes Consortium. Electronic address: magnus.nordborg@gmi.oeaw.ac.at. 1001 Genomes Consortium 1,135 genomes reveal the global pattern of polymorphism in Arabidopsis thaliana. Cell. 2016;166:481–491. doi: 10.1016/j.cell.2016.05.063. [DOI] [PMC free article] [PubMed] [Google Scholar]
- Baker CC, Sieber P, Wellmer F, Meyerowitz EM. The early extra petals1 mutant uncovers a role for microRNA miR164c in regulating petal number in Arabidopsis. Current Biology. 2005;15:303–315. doi: 10.1016/j.cub.2005.02.017. [DOI] [PubMed] [Google Scholar]
- Barbier de Reuille P, Routier-Kierzkowska A-L, Kierzkowski D, Bassel GW, Schüpbach T, Tauriello G, Bajpai N, Strauss S, Weber A, Kiss A, Burian A, Hofhuis H, Sapala A, Lipowczan M, Heimlicher MB, Robinson S, Bayer EM, Basler K, Koumoutsakos P, Roeder AHK, Aegerter-Wilmsen T, Nakayama N, Tsiantis M, Hay A, Kwiatkowska D, Xenarios I, Kuhlemeier C, Smith RS. MorphoGraphX: a platform for quantifying morphogenesis in 4D. eLife. 2015;4:e05864. doi: 10.7554/eLife.05864. [DOI] [PMC free article] [PubMed] [Google Scholar]
- Barkoulas M, Hay A, Kougioumoutzi E, Tsiantis M. A developmental framework for dissected leaf formation in the Arabidopsis relative Cardamine hirsuta. Nature Genetics. 2008;40:1136–1141. doi: 10.1038/ng.189. [DOI] [PubMed] [Google Scholar]
- Barkoulas M, van Zon JS, Milloz J, van Oudenaarden A, Félix MA. Robustness and epistasis in the C. elegans vulval signaling network revealed by pathway dosage modulation. Developmental Cell. 2013;24:64–75. doi: 10.1016/j.devcel.2012.12.001. [DOI] [PubMed] [Google Scholar]
- Bowman JL, Alvarez J, Weigel D, Meyerowitz EM, Smyth DR. Control of flower development in Arabidopsis thaliana by APETALA1 and interacting genes. Development. 1993;119:721–743. [Google Scholar]
- Brewer PB, Howles PA, Dorian K, Griffith ME, Ishida T, Kaplan-Levy RN, Kilinc A, Smyth DR. PETAL LOSS, a trihelix transcription factor gene, regulates perianth architecture in the Arabidopsis flower. Development. 2004;131:4035–4045. doi: 10.1242/dev.01279. [DOI] [PubMed] [Google Scholar]
- Cartolano M, Pieper B, Lempe J, Tattersall A, Huijser P, Tresch A, Darrah PR, Hay A, Tsiantis M. Heterochrony underpins natural variation in Cardamine hirsuta leaf form. PNAS. 2015;112:10539–10544. doi: 10.1073/pnas.1419791112. [DOI] [PMC free article] [PubMed] [Google Scholar]
- Coen ES, Meyerowitz EM. The war of the whorls: genetic interactions controlling flower development. Nature. 1991;353:31–37. doi: 10.1038/353031a0. [DOI] [PubMed] [Google Scholar]
- Endress PK. Evolution and floral diversity: the phylogenetic surroundings of Arabidopsis and Antirrhinum. International Journal of Plant Sciences. 1992;153:S106–S122. doi: 10.1086/297069. [DOI] [Google Scholar]
- Endress PK. Origins of flower morphology. Journal of Experimental Zoology. 2001;291:105–115. doi: 10.1002/jez.1063. [DOI] [PubMed] [Google Scholar]
- Endress PK. Evolutionary diversification of the flowers in angiosperms. American Journal of Botany. 2011;98:370–396. doi: 10.3732/ajb.1000299. [DOI] [PubMed] [Google Scholar]
- Félix MA. Cryptic quantitative evolution of the vulva intercellular signaling network in Caenorhabditis. Current Biology. 2007;17:103–114. doi: 10.1016/j.cub.2006.12.024. [DOI] [PubMed] [Google Scholar]
- Félix MA, Barkoulas M. Pervasive robustness in biological systems. Nature Reviews Genetics. 2015;16:483–496. doi: 10.1038/nrg3949. [DOI] [PubMed] [Google Scholar]
- Fenster CB, Armbruster WS, Wilson P, Dudash MR, Thomson JD. Pollination syndromes and floral specialization. Annual Review of Ecology, Evolution, and Systematics. 2004;35:375–403. doi: 10.1146/annurev.ecolsys.34.011802.132347. [DOI] [Google Scholar]
- Gan X, Hay A, Kwantes M, Haberer G, Hallab A, Ioio RD, Hofhuis H, Pieper B, Cartolano M, Neumann U, Nikolov LA, Song B, Hajheidari M, Briskine R, Kougioumoutzi E, Vlad D, Broholm S, Hein J, Meksem K, Lightfoot D, Shimizu KK, Shimizu-Inatsugi R, Imprialou M, Kudrna D, Wing R, Sato S, Huijser P, Filatov D, Mayer KF, Mott R, Tsiantis M. The Cardamine hirsuta genome offers insight into the evolution of morphological diversity. Nature Plants. 2016;2:16167. doi: 10.1038/nplants.2016.167. [DOI] [PMC free article] [PubMed] [Google Scholar]
- Gregis V, Sessa A, Dorca-Fornell C, Kater MM. The Arabidopsis floral meristem identity genes AP1, AGL24 and SVP directly repress class B and C floral homeotic genes. The Plant Journal. 2009;60:626–637. doi: 10.1111/j.1365-313X.2009.03985.x. [DOI] [PubMed] [Google Scholar]
- Griffith ME, da Silva Conceição A, Smyth DR. PETAL LOSS gene regulates initiation and orientation of second whorl organs in the Arabidopsis flower. Development. 1999;126:5635–5644. doi: 10.1242/dev.126.24.5635. [DOI] [PubMed] [Google Scholar]
- Hay A, Tsiantis M. The genetic basis for differences in leaf form between Arabidopsis thaliana and its wild relative Cardamine hirsuta. Nature Genetics. 2006;38:942–947. doi: 10.1038/ng1835. [DOI] [PubMed] [Google Scholar]
- Hay AS, Pieper B, Cooke E, Mandáková T, Cartolano M, Tattersall AD, Ioio RD, McGowan SJ, Barkoulas M, Galinha C, Rast MI, Hofhuis H, Then C, Plieske J, Ganal M, Mott R, Martinez-Garcia JF, Carine MA, Scotland RW, Gan X, Filatov DA, Lysak MA, Tsiantis M. Cardamine hirsuta: a versatile genetic system for comparative studies. The Plant Journal. 2014;78:1–15. doi: 10.1111/tpj.12447. [DOI] [PubMed] [Google Scholar]
- Heisler MG, Ohno C, Das P, Sieber P, Reddy GV, Long JA, Meyerowitz EM. Patterns of auxin transport and gene expression during primordium development revealed by live imaging of the Arabidopsis inflorescence meristem. Current Biology. 2005;15:1899–1911. doi: 10.1016/j.cub.2005.09.052. [DOI] [PubMed] [Google Scholar]
- Huang T, Irish VF. Temporal control of plant organ growth by TCP transcription factors. Current Biology. 2015;25:1765–1770. doi: 10.1016/j.cub.2015.05.024. [DOI] [PubMed] [Google Scholar]
- Huang T, Irish VF. Gene networks controlling petal organogenesis. Journal of Experimental Botany. 2016;67:61–68. doi: 10.1093/jxb/erv444. [DOI] [PubMed] [Google Scholar]
- Hulse AM, Cai JJ. Genetic variants contribute to gene expression variability in humans. Genetics. 2013;193:95–108. doi: 10.1534/genetics.112.146779. [DOI] [PMC free article] [PubMed] [Google Scholar]
- Irish VF, Sussex IM. Function of the apetala-1 gene during Arabidopsis floral development. The Plant Cell Online. 1990;2:741–753. doi: 10.1105/tpc.2.8.741. [DOI] [PMC free article] [PubMed] [Google Scholar]
- Irish VF. The Arabidopsis petal: a model for plant organogenesis. Trends in Plant Science. 2008;13:430–436. doi: 10.1016/j.tplants.2008.05.006. [DOI] [PubMed] [Google Scholar]
- Kaufmann K, Wellmer F, Muiño JM, Ferrier T, Wuest SE, Kumar V, Serrano-Mislata A, Madueño F, Krajewski P, Meyerowitz EM, Angenent GC, Riechmann JL. Orchestration of floral initiation by APETALA1. Science. 2010;328:85–89. doi: 10.1126/science.1185244. [DOI] [PubMed] [Google Scholar]
- Kierzkowski D, Nakayama N, Routier-Kierzkowska AL, Weber A, Bayer E, Schorderet M, Reinhardt D, Kuhlemeier C, Smith RS. Elastic domains regulate growth and organogenesis in the plant shoot apical meristem. Science. 2012;335:1096–1099. doi: 10.1126/science.1213100. [DOI] [PubMed] [Google Scholar]
- Lampugnani ER, Kilinc A, Smyth DR. PETAL LOSS is a boundary gene that inhibits growth between developing sepals in Arabidopsis thaliana. The Plant Journal. 2012;71:724–735. doi: 10.1111/j.1365-313X.2012.05023.x. [DOI] [PubMed] [Google Scholar]
- Lampugnani ER, Kilinc A, Smyth DR. Auxin controls petal initiation in Arabidopsis. Development. 2013;140:185–194. doi: 10.1242/dev.084582. [DOI] [PubMed] [Google Scholar]
- Laufs P, Peaucelle A, Morin H, Traas J. MicroRNA regulation of the CUC genes is required for boundary size control in Arabidopsis meristems. Development. 2004;131:4311–4322. doi: 10.1242/dev.01320. [DOI] [PubMed] [Google Scholar]
- Liao CY, Smet W, Brunoud G, Yoshida S, Vernoux T, Weijers D. Reporters for sensitive and quantitative measurement of auxin response. Nature Methods. 2015;12:207–210. doi: 10.1038/nmeth.3279. [DOI] [PMC free article] [PubMed] [Google Scholar]
- Mallory AC, Dugas DV, Bartel DP, Bartel B. MicroRNA regulation of NAC-domain targets is required for proper formation and separation of adjacent embryonic, vegetative, and floral organs. Current Biology. 2004;14:1035–1046. doi: 10.1016/j.cub.2004.06.022. [DOI] [PubMed] [Google Scholar]
- Mandel MA, Gustafson-Brown C, Savidge B, Yanofsky MF. Molecular characterization of the Arabidopsis floral homeotic gene APETALA1. Nature. 1992;360:273–277. doi: 10.1038/360273a0. [DOI] [PubMed] [Google Scholar]
- McKim SM, Routier-Kierzkowska A-L, Monniaux M, Kierzkowski D, Pieper B, Smith RS, Tsiantis M, Hay A. Seasonal regulation of petal number. Plant Physiology. 2017;175:00563. doi: 10.1104/pp.17.00563. [DOI] [PMC free article] [PubMed] [Google Scholar]
- Metzger BP, Yuan DC, Gruber JD, Duveau F, Wittkopp PJ. Selection on noise constrains variation in a eukaryotic promoter. Nature. 2015;521:344–347. doi: 10.1038/nature14244. [DOI] [PMC free article] [PubMed] [Google Scholar]
- Monniaux M, Pieper B, Hay A. Stochastic variation in Cardamine hirsuta petal number. Annals of Botany. 2016;117:881–887. doi: 10.1093/aob/mcv131. [DOI] [PMC free article] [PubMed] [Google Scholar]
- Monniaux M, McKim SM, Cartolano M, Thévenon E, Parcy F, Tsiantis M, Hay A. Conservation vs divergence in LEAFY and APETALA1 functions between Arabidopsis thaliana and Cardamine hirsuta. The New Phytologist. 2017;216:549–561. doi: 10.1111/nph.14419. [DOI] [PubMed] [Google Scholar]
- Paaby AB, Rockman MV. Cryptic genetic variation: evolution's hidden substrate. Nature Reviews Genetics. 2014;15:247–258. doi: 10.1038/nrg3688. [DOI] [PMC free article] [PubMed] [Google Scholar]
- Pfaffl MW. A new mathematical model for relative quantification in real-time RT-PCR. Nucleic Acids Research. 2001;29:e45. doi: 10.1093/nar/29.9.e45. [DOI] [PMC free article] [PubMed] [Google Scholar]
- Pieper B, Monniaux M, Hay A. The genetic architecture of petal number in Cardamine hirsuta. New Phytologist. 2016;209:395–406. doi: 10.1111/nph.13586. [DOI] [PubMed] [Google Scholar]
- Rebeiz M, Tsiantis M. Enhancer evolution and the origins of morphological novelty. Current Opinion in Genetics & Development. 2017;45:115–123. doi: 10.1016/j.gde.2017.04.006. [DOI] [PMC free article] [PubMed] [Google Scholar]
- Rohner N, Jarosz DF, Kowalko JE, Yoshizawa M, Jeffery WR, Borowsky RL, Lindquist S, Tabin CJ. Cryptic variation in morphological evolution: HSP90 as a capacitor for loss of eyes in cavefish. Science. 2013;342:1372–1375. doi: 10.1126/science.1240276. [DOI] [PMC free article] [PubMed] [Google Scholar]
- Schindelin J, Arganda-Carreras I, Frise E, Kaynig V, Longair M, Pietzsch T, Preibisch S, Rueden C, Saalfeld S, Schmid B, Tinevez JY, White DJ, Hartenstein V, Eliceiri K, Tomancak P, Cardona A. Fiji: an open-source platform for biological-image analysis. Nature Methods. 2012;9:676–682. doi: 10.1038/nmeth.2019. [DOI] [PMC free article] [PubMed] [Google Scholar]
- Smyth DR, Bowman JL, Meyerowitz EM. Early flower development in Arabidopsis. The Plant Cell Online. 1990;2:755–767. doi: 10.1105/tpc.2.8.755. [DOI] [PMC free article] [PubMed] [Google Scholar]
- Specht CD, Bartlett ME. Flower evolution: the origin and subsequent diversification of the angiosperm flower. Annual Review of Ecology, Evolution, and Systematics. 2009;40:217–243. doi: 10.1146/annurev.ecolsys.110308.120203. [DOI] [Google Scholar]
- Urbanus SL, de Folter S, Shchennikova AV, Kaufmann K, Immink RG, Angenent GC. In planta localisation patterns of MADS domain proteins during floral development in Arabidopsis thaliana. BMC Plant Biology. 2009;9:5. doi: 10.1186/1471-2229-9-5. [DOI] [PMC free article] [PubMed] [Google Scholar]
- van Doorn WG, Van Meeteren U. Flower opening and closure: a review. Journal of Experimental Botany. 2003;54:1801–1812. doi: 10.1093/jxb/erg213. [DOI] [PubMed] [Google Scholar]
- Van Ooijen JW. Joinmap 4 Software for the Calculation of Genetic Linkage Maps in Experimental Populations. Wageningen, Netherlands: Kyazma B.V; 2006. [Google Scholar]
- Vlad D, Kierzkowski D, Rast MI, Vuolo F, Dello Ioio R, Galinha C, Gan X, Hajheidari M, Hay A, Smith RS, Huijser P, Bailey CD, Tsiantis M. Leaf shape evolution through duplication, regulatory diversification, and loss of a homeobox gene. Science. 2014;343:780–783. doi: 10.1126/science.1248384. [DOI] [PubMed] [Google Scholar]
- Waddington CH. The Strategy of the Genes; a Discussion of Some Aspects of Theoretical Biology. London: Allen & Unwin; 1957. [Google Scholar]
- Wagner A. Robustness and Evolvability in Living Systems. Princeton, NJ, USA: Princeton University Press; 2005. [Google Scholar]
- Wittkopp PJ, Stewart EE, Arnold LL, Neidert AH, Haerum BK, Thompson EM, Akhras S, Smith-Winberry G, Shefner L. Intraspecific polymorphism to interspecific divergence: genetics of pigmentation in Drosophila. Science. 2009;326:540–544. doi: 10.1126/science.1176980. [DOI] [PubMed] [Google Scholar]