Abstract
Colorimetry detects a color change resulted from a chemical reaction or molecular binding. Despite its wide-spread use in sensing, continuous monitoring of analytes with colorimetry is difficult, especially when the color-producing reaction or binding is irreversible. Here, we report on a gradient-based colorimetric sensor (GCS) to overcome this limitation. Lateral transport of analytes across a colorimetric sensor surface creates a color gradient that shifts along the transport direction over time, and GCS tracks the gradient shift and converts it into analyte concentration in real time. Using a low cost complementary metal-oxide semiconductor imager and imaging processing algorithm, we show submicrometer gradient shift tracking precision and continuous monitoring of ppb-level ozone.
Graphical Abstract
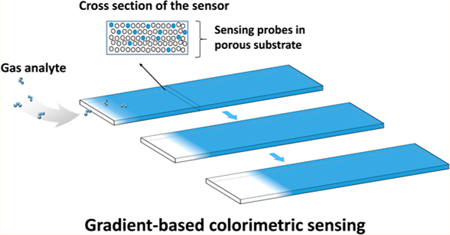
Monitoring of air quality, studying of environmental health, and protection of people from harmful chemical exposures have motivated increasing efforts to develop low cost and high performance chemical sensors.1–6 These efforts include development of miniaturized metal-oxide semiconductor7–9 and electrochemical sensors,10–12 which represent current mainstream commercial gas sensors. Colorimetry is another well-known sensing principle that is also widely used in commercial gas sensors. It detects a color change associated with a specific chemical reaction between an analyte and sensing materials. A distinct feature of colorimetric sensing is its capability for parallel sensing of multiple analytes when used in an array format. Because most colorimetric reactions are irreversible, today’s commercial colorimetric sensors are typically for one-time use and for qualitative or semiquantitative analysis only.13 For these reasons, colorimetric sensors are not suitable for applications that require continuous and reliable quantitative sensing.
To overcome the drawbacks of colorimetric sensing, we previously developed a microfluidics-based colorimetric sensor.14 A microfluidic channel was created on top of the colorimetric sensor, and an air sample was forced to flow into the channel by a pump. The target analyte reacted first with the sensing probes near the channel inlet and then moved along the channel toward the outlet. By detecting color changes sequentially along the microfluidic channel, we were able to detect analytes multiple times without replacing the sensor. We recently reported colorimetric gas detection by actively controlling the exposure dose of sensing elements to gas analyte during each detecting cycle. When the exposure time is limited to 20 s, the sensor chip can be used 150 times before replacement.15 Despite the success, these methods still fall short for continuous tracking of analytes. Here, we introduce a gradient-based colorimetric sensor (GCS) to achieve sensitive, quantitative, and continuous gas monitoring. We present the principle of GCS, build a prototype device, carry out experiments, validate the experimental results with numerical simulations, and demonstrate continuous detection of ozone in real-time.
EXPERIMENTAL SECTION
Materials.
Indigo carmine and citric acid were purchased from Sigma-Aldrich, Inc., which were dissolved in ultrapure water (18 MΩ) containing glycerol. The solutions were cast onto silica gel substrates, purchased from Sorbent Technologies (Polyester backed silica G TLC plates). O3 samples with concentrations from 10 to 500 ppbV were generated by an O3 generator (UVP Corp.) using UV radiation. The actual concentration of each O3 sample was confirmed by an O3 analyzer (2B Technologies, Inc.).
Device Configuration.
A GCS chip with dimensions of 4mm (length) × 0.5 mm (width) × 250 μm (thickness) was cut from silica gel substrates by a laser cutter (Universal Laser Systems). The sensor was coated with a layer of sensing probes (indigo carmine for O3) and then covered with a flat piece of acrylic to prevent exposure of the sensing probes from the top. The GCS chip was illuminated with a white LED (LEDtronics Inc.) and imaged with a complementary metal-oxide semiconductor (CMOS) imager (Logitech, Inc.) for real-time monitoring of the color gradient continuously when exposed to the gas analyte (Figure 1a).
Figure 1.

(a) Schematics of GCS. A porous substrate is coated with a sensing probe that can react with an analyte specifically and change color. The top of the porous substrate is covered with a layer of acrylic to prevent direct exposure of the sensing probe to the analyte from the top, such that the analyte can only diffuse from the edge of the substrate to react with the sensing probe. The local reaction creates a color gradient, and GCS tracks the color gradient shift along the substrate over time. (b) Snapshots of the intensity profiles show shifting of the color gradient over time.
Experimental Methods.
The GCS chip was placed in a test chamber with defined temperature and humidity, and sample gas was introduced into the chamber, which diffused into the porous substrate from the edge. The color gradient change along the sensor substrate was captured at 5 frames/second and analyzed to detect gas analyte over time.
RESULTS AND DISCUSSION
1. GCS Sensing Principle.
The key component of GCS is a sensor chip consisting of a sensing probe-coated porous substrate covered with a top layer to prevent exposure of the sensing probe to analyte from the top (Figure 1a). When the analyte diffuses along the porous substrate from one edge, it starts to react with the sensing probe at the location of its first contact and changes the local color of the porous substrate, which creates a color gradient along the substrate (Figure 1a). The gradient shifts laterally over time when the sensor chip is exposed to the analyte continuously. GCS measures the position of maximum gradient and tracks its lateral shift over time with submicrometer precision, leading to sensitive and continuous monitoring of the analyte.
To demonstrate GCS, we used indigo carmine as the sensing probe, which reacts specifically with O3. O3 is one of the six EPA listed “criteria” air pollutants16 and is harmful to human lung function and the respiratory system,17 causing various diseases such as asthma, bronchitis, and heart attack.18 The porous material was made of silica gel to provide a large surface area for sensitive colorimetry and also allow O3 to diffuse along the porous substrate from one end (inlet) to another (outlet). The top layer was an acrylic sealing plate, which helped confine O3 diffusion along the porous substrate. O3 reacted with sensing probes near the inlet initially, and then with the probes along the GCS over time as the sensing probes near the inlet depleted upon irreversible chemical reaction. The unreacted sensing probe for O3 detection was blue (Figure 1a), which turned into white after complete reaction with O3. The region that separated the reacted (white) and unreacted (blue) sensing probes was described by a color gradient (Figure 1b). The color gradient shifted from left to right upon continuous exposure to O3, and the rate that the gradient position shifted over time reflected O3 concentration. GCS tracked the shift in the gradient position (Δx) by analyzing the intensity profile captured with a CMOS imager. We will show later that the gradient shift (Δx) at time t is directly related to O3 concentration.
2. Simulation and Measurement.
To validate the GCS principle and guide the design of a GCS sensor, we simulated O3 mass transport and chemical reaction kinetics along the porous substrate numerically. The O3 probe is indigo carmine, which is blue at pH < 11.4. The reaction product is isatin sulfonic acid,19 a colorless substance. We confirmed this reaction by measuring the UV−visible spectra of indigo carmine before and after exposure to O3 and found that the reaction of indigo carmine with O3 led to a decrease in optical absorbance at ∼600 nm (Figure S1).
We denote the reaction as, c(g) + n(s) → p(s), where c is the O3 concentration in the air sample, n is the density of reaction sites or sensing probes (indigo carmine) available for the reaction on the O3 sensor, and p is the concentration of the reaction product. The diffusion and reaction kinetics are described by
| (1) |
| (2) |
where k is the reaction rate coefficient, R is the reaction rate, and D is the diffusion coefficient of O3 in the porous silica gel substrate (D = 1.1 × 10⁻¹¹ m2/s). We assumed the following boundary conditions: c(inlet, t) = c0, where c0 is the concentration of the air sample; c(outlet, t) = 0, implying a sufficiently long GCS sensing chip. The concentration (c) is continuous at the interface of the air−silica substrate, and , the concentration gradient, on the top and side walls are zero (reflecting zero flux of O3 or perfect sealing).
Solving eqs 1 and 2 with the boundary conditions defined above allows us to determine c and n along the channel. The color change is proportional to p (product), which is related to n by p = n0 − n, where n0 is the initial concentration of the O3 sensing probes. In other words, the depletion of the O3 sensing probes equals the generation of the reaction product. The simulation shows that the color changes when exposing the sensor to 500 ppbV O3 for different time durations (Figure 2a). Note that the blue bars represent the cross-section of a GCS along the direction from the inlet to outlet, and the white color represents the consumption of the sensing probes at a specific location along the sensor. The concentration profiles along the sensor provide local optical intensity (color change) along the channel (Figure 2b). We note that the simulation results shown in Figure 2 were obtained by taking k = 100 m3/(s·mol). This value was chosen by comparison of simulation and experimental results obtained with a sensing surface without mass transport limitations.
Figure 2.
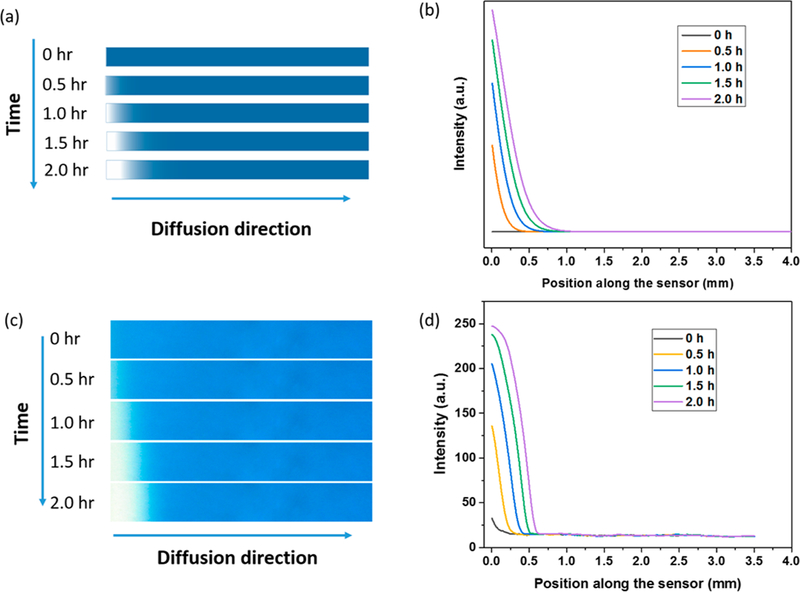
Simulated (top) and measured (bottom) gradient shifts upon continuous exposure to O3 over 2 h. (a) Simulated concentration profiles of unreacted O3 sensing probe (indigo carmine, blue color) when exposed to 500 ppbV O3 for 0, 0.5, 1, 1.5, and 2 h, respectively. (b) Simulated intensity profile (color gradient) along the sensor (colored solid lines). (c) Measured images with the CMOS imager showing color gradient development over 2 h at 500 ppb O3. (d) Measured intensity profile (color gradient) shifts along the sensor surface over time.
To experimentally validate GCS for continuous monitoring of O3, we tested the sensor by exposing the sensor to 500 ppbV O3 over 2 h and observed gradual color development along the sensor (Figure 2c). The measured color changes at different locations over time as shown in Figure 2d are consistent with the simulated results in Figure 2b, indicating the diffusion-reaction equations and the boundary conditions provide a reasonable description of the O3 sensor. The simulation and experiment also show that GCS with passive sampling (diffusion) can continuously track O3 in the air. The lifetime of the sensor can be determined from the gas analyte concentration and the sensor’s sensing capacity, the maximum amount of analyte a sensor can detect over a given time interval. In the present O3 sensor, the capacity was determined to be 7 ppmV·hour, indicating that it can continuously monitor 100 ppbV O3 for 70 h. The EPA O3 exposure limit is 70 ppbV over 8 h averaging time, and O3 concentration in typical ambient air is usually much lower than the EPA standard.16
3. Optical Gradient-Tracking Method.
A key task in GCS is to detect and track the gradient shift. We achieved this task by developing a sensitive imaging-processing algorithm20,21 from the time sequence images captured with a CMOS imager. The algorithm determines the position of the maximum color gradient with the following steps (Figure 3a): (1) Extract the intensity profile from the captured images; (2) find the maximum (max) and minimum (min) intensity values from the intensity profile; (3) determine the position on the intensity profile where the intensity equals the mean value, mid = (max + min)/2; and (4) Track the position over time. Note that the image in the background of Figure 3a was used to show the actual color gradient corresponding to the intensity profile. To validate this method for continuous tracking of O3 concentration, we calibrated the O3-GCS sensor based on the speed of gradient shift at various concentrations of O3. The results in Figure 3b show a linear dependence of the gradient shift speed on O3 concentration over a large concentration range, from 0 to 500 ppb. This concentration range covers most of the personal O3 exposure monitoring applications. From the slope of the calibration, we determined the sensitivity of the O3 sensor to be (1.14 ± 0.06) × 10−7 mm/s/ppb (R2 = 0.99).
Figure 3.
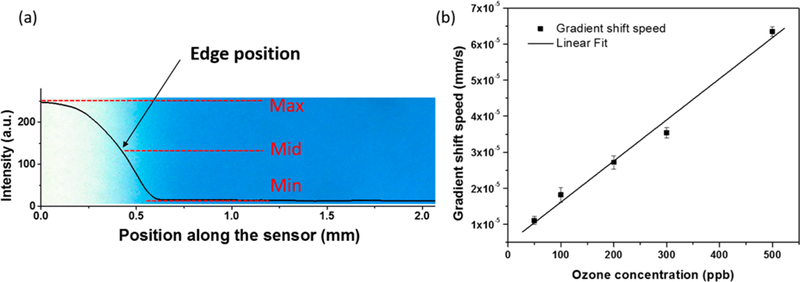
(a) Image of the partially reacted sensor and corresponding intensity profile of the sensor. The optical tracking method finds the maximum (max) and minimum (min) value to calculate the mid value, searches the position along the sensor that has the intensity value closest to mid, and finally defines the position as the gradient position. (b) Calibration of the O3-GCS with a reference O3 analyzer, showing a linear dependence of the sensor response (gradient shift speed) to O3 concentration. The error bar indicates the standard deviation of three tests.
4. Validation of GCS for Detecting O3.
To further validate the GCS capability for continuous detection of O3, we tested the sensor responses to changing O3 concentration in a test chamber. As shown in Figure 4, we extracted the speed of the gradient shift and found that it was proportional to the O3 concentration determined with a reference O3 analyzer (2B Technologies, Inc.). The experiment also showed that the GCS responded quickly to O3 and was limited only by how fast we could change the O3 concentration in the test chamber.
Figure 4.
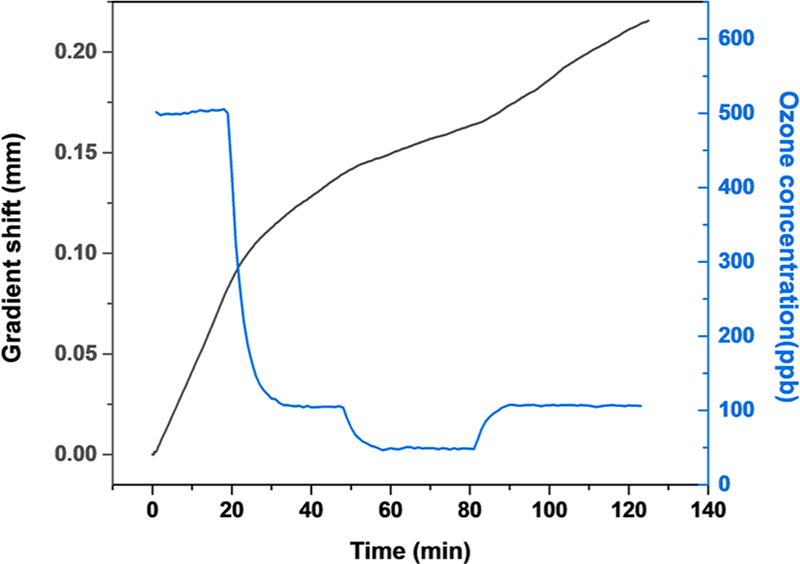
O3-GCS responses to varying O3 concentration (25 °C, 50% RH).
We next tested the selectivity of the O3 sensor by measuring the sensor responses to common pollutants, including 100 ppbV nitrogen dioxide (NO2), 1 ppmV ammonia (NH3), 1 ppmV ethanol, 10 ppmV carbon monoxide (CO), 100 ppbV sulfur dioxide (SO2), and 100 ppbV formaldehyde (HCHO) and compared the response to 100 ppbV O3. As shown in Figure 5, all of the interferents’ responses are less than 5% of that to 100 ppbV O3, demonstrating selective detection of O3 in the presence of these interferents. The excellent selectivity can be attributed to that O3 reacts with indigo carmine strongly and rapidly, producing a distinct change in color.
Figure 5.
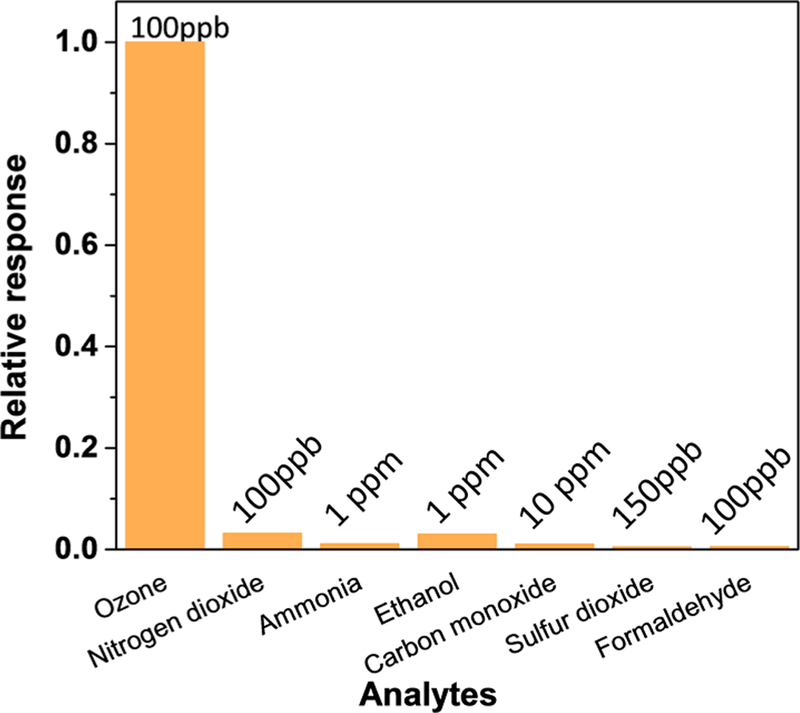
Selectivity test with common interferents (NO2, NH3, ethanol, CO, SO2, and HCHO), where the relative responses are the sensor responses to the interferents normalized by that to O3 at 100 ppbV.
5. Detection Limit, Response Time, and Lifetime.
When choosing gas sensors for a given application, detection limit (DL), response time (τ), and lifetime are important parameters. Because GCS measures the lateral shift (Δx) in the color gradient, the detection limit of GCS is determined by how precisely we can track the position of the color gradient. If we define this precision as three times the noise level (σ2) of the position tracking, and then DL is given by
| (3) |
where S is the sensitivity of GCS determined by the slope of Figure 3b. Eq 3 shows that DL is inversely proportional to τ, so one may improve detection limit by increasing measurement time (allowing sufficient accumulation of gradient shift). However, for a given measurement time, we must minimize the noise level in the tracking of gradient shift. We discuss below the dependence of the noise level on different factors.
The noise level in the gradient position (δx) is related to the color gradient and noise level of the intensity (color) (δI), given by
| (4) |
If the gradient is sharp (Figure 6 a), dI/dx is large, and so is δx, which favors a lower detection limit. On the other hand, if the gradient is smooth (Figure 6b), the detection limit will be poor. The sharpness of the gradient is related to the substrate porosity. So, the selection of a suitable substrate is of great importance. In the present work, we chose a silica substrate with pore diameter 6 nm and pore volume ∼ 0.75 mL/g. The position-tracking position defined by 3× standard deviation is ∼0.08 μm (Figure 6c). The corresponding detection limit is 10 ppb for a response time of 3.5 min.
Figure 6.
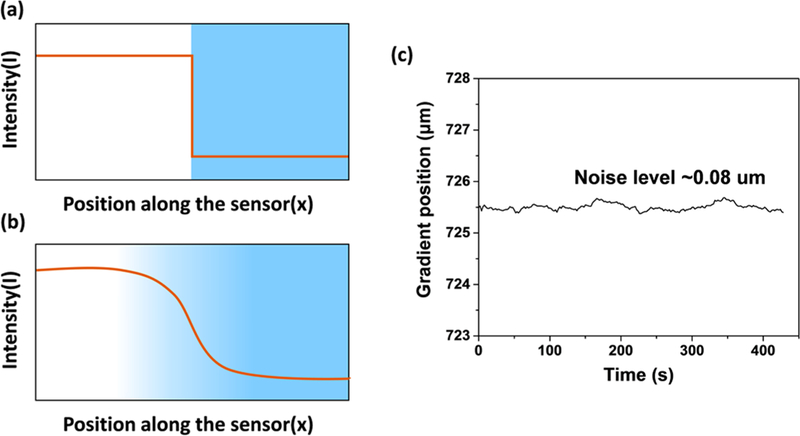
(a) Illustration of a sharp and (b) smooth gradient along a GCS. (c) Gradient position tracking noise level of an O3-GCS when testing clean air. The noise level is ∼0.08 μm.
For continuous monitoring of air quality, one wishes to achieve long lifetime, which is determined how fast the sensing probes are consumed (reacted with the analyte) along the entire GCS surface. This is related to the sensor length, the density of the sensing probes, and concentration of the analyte. For our O3-GCS, as mentioned in Section 2, the length is 4 mm, which can continuously monitor 100 ppbV O3 for 70 h. Longer sensor lifetime should be possible by increasing the length of the sensor and the density of the sensing probes.
CONCLUSIONS
We developed GCS to overcome the difficulty of traditional colorimetric sensors that are limited to one-time use only due to irreversible color change producing chemical reactions. We fabricated an O3-GCS device and showed reliable detection of O3 via passive sampling (without using air pumps). Removing the use of air pumps is critical for miniaturization of the size and power consumption of the device. We carried out a numerical simulation of the GCS with passive air sampling and found that it is in good agreement with the experimental data, indicating the gas sensing process can be described with diffusion and reaction processes. We also developed an optical gradient-tracking technique to detect the gradient shift over submicrometer precision, which allows the O3-GCS to reach a detection limit of 10 ppbV (with 3.5 min sampling). The sensor has a wide dynamic range of 0−500 ppbV and high selectivity to O3 over common interferents in air such as NO2, NH3, CO, SO2, and HCHO. The sensor lifetime is 7 ppmV·hour, corresponding to continuous detection of 100 ppbV O3 for 70 h without sensor replacement.
Supplementary Material
ACKNOWLEDGMENTS
This work was supported by NIBIB/NIH (Grant 1U01EB021980–01) and NSFC (Grant 21575062).
Footnotes
ASSOCIATED CONTENT
Supporting Information:
The Supporting Information is available free of charge on the ACS Publications website at DOI: 10.1021/acs.analchem.8b00506.
REFERENCES
- (1).Choi S-J; Lee I; Jang B-H; Youn D-Y; Ryu W-H; Park CO; Kim I-D Anal. Chem 2013, 85, 1792–1796. [DOI] [PubMed] [Google Scholar]
- (2).Xing R; Xu L; Song J; Zhou C; Li Q; Liu D; Wei Song H Sci. Rep 2015, 5, 10717. [DOI] [PMC free article] [PubMed] [Google Scholar]
- (3).Mondal SP; Dutta PK; Hunter GW; Ward BJ; Laskowski D; Dweik RA Sens. Actuators, B 2011, 158, 292–298. [Google Scholar]
- (4).Cui S; Pu H; Wells SA; Wen Z; Mao S; Chang J; Hersam MC; Chen J Nat. Commun 2015, 6, 8632. [DOI] [PMC free article] [PubMed] [Google Scholar]
- (5).Yamazoe N Sens. Actuators, B 2005, 108, 2–14. [Google Scholar]
- (6).Tsujita W; Yoshino A; Ishida H; Moriizumi T Sens. Actuators, B 2005, 110, 304–311. [Google Scholar]
- (7).Wetchakun K; Samerjai T; Tamaekong N; Liewhiran C; Siriwong C; Kruefu V; Wisitsoraat A; Tuantranont A; Phanichphant S Sens. Actuators, B 2011, 160, 580–591. [Google Scholar]
- (8).Li J; Lu Y; Ye Q; Cinke M; Han J; Meyyappan M Nano Lett 2003, 3, 929–933. [Google Scholar]
- (9).Kamionka M; Breuil P; Pijolat C Sens. Actuators, B 2006, 118, 323–327. [Google Scholar]
- (10).Korotcenkov G; Cho BK Sens. Actuators, B 2012, 161, 28–44. [Google Scholar]
- (11).Pang X; Shaw MD; Lewis AC; Carpenter LJ; Batchellier T Sens. Actuators, B 2017, 240, 829–837. [Google Scholar]
- (12).Peterson P; Aujla A; Grant K; Brundle A; Thompson M; Vande Hey J; Leigh R Sensors 2017, 17, 1653. [DOI] [PMC free article] [PubMed] [Google Scholar]
- (13).Dräger-Tube/CMS Handbook: Handbook for Short Term Measurements in Soil, Water and Air Investigations As Well As Technical Gas Analysis, 16th ed.; Drager̈ Safety AG & Co KGaA: Lübeck, 2011; p 225. [Google Scholar]
- (14).Wang R; Prabhakar A; Iglesias RA; Xian X; Shan X; Tsow F; Forzani ES; Tao N IEEE Sens. J 2012, 12, 1529–1535. [Google Scholar]
- (15).Lin C; Xian X; Qin X; Wang D; Tsow F; Forzani E; Tao N ACS Sens 2018, 3, 327. [DOI] [PubMed] [Google Scholar]
- (16).National Ambient Air Quality Standards Table United States Environmental Protection Agency, https://www.epa.gov/criteria-airpollutants/naaqs-table#3, December 20, 2016. [Google Scholar]
- (17).Jerrett M; Burnett RT; Pope CAI; Ito K; Thurston G; Krewski D; Shi Y; Calle E; Thun MN Engl. J. Med 2009, 360, 1085–1095. [DOI] [PMC free article] [PubMed] [Google Scholar]
- (18).Weinhold B Environ. Health Perspect 2008, 116, A302–A305. [DOI] [PMC free article] [PubMed] [Google Scholar]
- (19).Takeuchi K; Ibusuki T Anal. Chem 1989, 61, 619–623. [DOI] [PubMed] [Google Scholar]
- (20).Guan Y; Shan X; Zhang F; Wang S; Chen H-Y; Tao N Sci. Adv 2015, 1, 1. [DOI] [PMC free article] [PubMed] [Google Scholar]
- (21).Wang H; Shan X; Yu H; Wang Y; Schmickler W; Chen H-Y; Tao N Angew. Chem., Int. Ed 2017, 56, 2132–2135. [DOI] [PubMed] [Google Scholar]
Associated Data
This section collects any data citations, data availability statements, or supplementary materials included in this article.


