Abstract
Quinones participate in diverse electron transfer and proton-coupled electron transfer processes in chemistry and biology. To understand the relationship between these redox processes, an experimental study was carried out to probe the 1 e– and 2 e–/2 H+ reduction potentials of a number of common quinones. The results reveal a non-linear correlation between the 1 e– and 2 e–/2 H+ reduction potentials. This unexpected observation prompted a computational study of 134 different quinones, probing their 1 e– reduction potentials, pKa values, and 2 e–/2 H+ reduction potentials. The density functional theory calculations reveal an approximately linear correlation between these three properties and an effective Hammett constant associated with the quinone substituent(s). However, deviations from this linear scaling relationship are evident for quinones that feature intramolecular hydrogen bonding in the hydroquinone, halogen substituents, charged substituents, and/or sterically bulky substituents. These results, particularly the different substituent effects on the 1 e– versus 2 e–/2 H+ reduction potentials, have important implications for designing quinones with tailored redox properties.
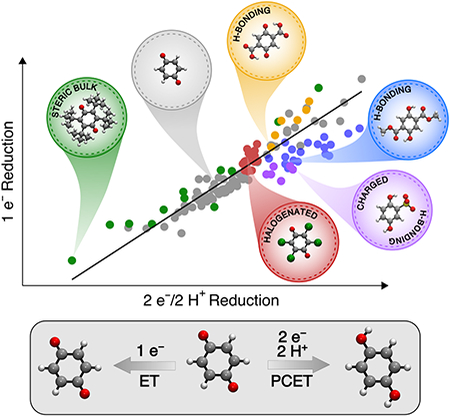
TOC ENTRY:
I. Introduction
Quinones are ubiquitous redox-active organic molecules that play important roles in processes ranging from photosynthesis and aerobic respiration in biology1 to chemical oxidation methods and industrial production of hydrogen peroxide.2 Quinones are also the focus of increased attention in energy storage and conversion applications, including redox flow batteries, dye-sensitized solar cells, and water-splitting devices.3 Studies in our labs have focused on the use of quinones as electron-proton transfer mediators for O2 reduction4 and as aerobic oxidation catalysts that resemble oxidase enzymes with quinone active sites.5, 6
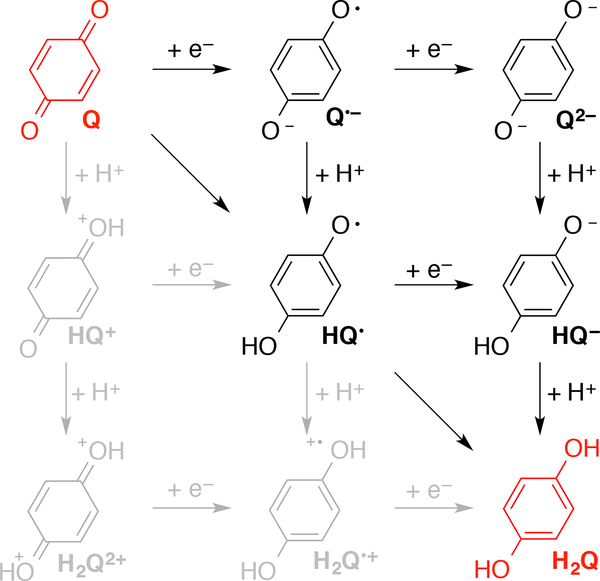
Quinones participate in a variety of redox processes (Scheme 1). For example, the applications noted above feature single electron transfer, proton-coupled electron transfer (PCET), and hydride transfer reactivity. An understanding of the factors that influence the different redox properties of quinones could contribute significantly to the design of new quinones for various applications. The present study was motivated by an interest in the relationship between electron transfer and PCET reactions of quinones.
Scheme 1.
Quinone Electron, Proton, and Proton-Coupled Electron Transfer Processes
Experimental 1 e– and 2 e–/2 H+ reduction potentials of many quinones have been reported previously.7 However, gaps are present in the data, and many of the values were not determined under a uniform set of conditions. This deficiency is addressed in the present study through the acquisition of a broad set of self-consistent experimental data, thereby facilitating systematic analysis of quinone redox properties. The results described below reveal a heretofore unrecognized non-linear correlation between 1 e– and 2 e–/2 H+ quinone reduction potentials. These unexpected observations prompted computational studies of a much larger set of quinones to explore the basis for this behavior. Overall, quinone redox behavior is found to be well described by a Hammett-based linear scaling relationship. However, a more thorough assessment of the experimental and calculated reduction potentials and pKa values of the different quinones draws attention to four different types of substituents that contribute to significant deviations from the global trend: hydrogen-bond acceptors, halogens, charged fragments, and sterically bulky groups. These results provide key insights into quinone structure-activity relationships that may be used in the design and tuning of new quinone-based catalysts, reagents, and/or mediators.
II. Methods
Experimental Details.
All chemicals were used as received unless otherwise stated. 1,4-benzoquinone (1) was purified by sublimation. 2-tert-butyl-1,4-benzoquinone (4), 2,3-dimethyl-1,4-benzoquinone (25), 2,3,5-trimethyl-1,4-benzoquinone (91), 3,5-di-tert-butyl-1,2-benzoquinone, and 4-tert-butyl-1,2-benzoquinone were oxidized from the corresponding hydroquinones following literature procedure.6e,8
Electrochemical experiments were performed with a standard 3-electrode set-up, using a glassy carbon electrode that was polished with alumina before each experiment, a Ag/Ag+ reference electrode (for non-aqueous measurements) or a Ag/AgCl reference electrode (for aqueous measurements), and a Pt wire counter electrode. To reference the Ag/Ag+ potentials to Fc/Fc+, ferrocene was added to the solution and a cyclic voltammetry (CV) scan was taken to measure this potential. To reference to NHE, +197 mV was added to the Ag/AgCl potentials measured experimentally or ferroin was added and the midpoint potential referenced to NHE. All experimental measurements were obtained using a BASi EC Epsilon potentiostat, and the reported potentials have been corrected for iR drop. A scan rate of 50 mV/s was used in all CV experiments. Experimental CVs are included in the Supporting Information (Figures S1–30).
Computational Details.
The computations were performed with density functional theory (DFT) using the B3LYP9 functional and the 6–31++G** basis set.10 The structures were optimized in the solution phase (water or acetonitrile) using the conductor-like polarizable continuum model (C-PCM)11 with Bondi atomic radii,12 and including the nonelectrostatic contributions of dispersion,13 repulsion,13 and cavitation energies.14 Thermochemical data were calculated at T = 298.15 K, and all calculated free energies included zero-point energy, entropic contributions, and solvation effects. The relative reduction potentials and pKa values were calculated from the corresponding reaction free energies using methodology described elsewhere.15 Additional benchmarking was performed using the B3P86,9a,16 BP86,16–17 M06–2X,18 and ωB97XD19 functionals (Figure S31). All calculations were performed using the Gaussian 09 electronic structure program.20
The reduction potentials and pKa values were calculated relative to the corresponding values for the reference species (1) using isodesmic reactions. The isodesmic reactions used for this procedure are provided in the SI on pages S14. This procedure is equivalent to determining the difference between the experimental and calculated values for the reference species and adding this correction to all calculated values. The resulting reduction potentials and pKa values have been shown to be quantitatively accurate for species that are structurally similar to the reference species.15
Calculation of the 2 e–/2 H+ Reduction Potentials.
The electron and proton transfer reactions involved in quinone electrochemistry are summarized in the nine-membered thermodynamic cycle shown in Scheme 1. The hydroquinone (H2Q) may be generated from the quinone (Q) by proceeding sequentially through two reduction and two protonation steps. The cationic species are high-energy species not involved in the PCET reactions of interest and therefore were not investigated. Using this thermodynamic cycle, it was possible to determine the reduction potential for the overall 2 e–/2 H+ process for each quinone in terms of individual reduction and protonation steps:
| (1) |
| (2) |
The 2 e–/2 H+ reduction potential is calculated by considering the following series of four steps (cf. Scheme 1): (1) reduction of the neutral quinone (Q) to produce the radical anion (Q•–), (2) reduction of the Q•– to produce the quinone dianion (Q2–), (3) protonation of the Q2– to produce the protonated anion (HQ–), and (4) protonation of the HQ– to produce the neutral hydroquinone (H2Q). The reduction potentials and pKa values associated with these four steps are calculated independently and are combined to generate the 2 e–/2 H+ reduction potential using Eq. (2). Overall, the examination of six different states and two to four isomers of 134 quinones required ~2000 DFT geometry optimizations and free energy calculations. Only thermodynamic properties were calculated in this work; consideration of kinetic properties would require calculation of free energy barriers for the proton transfer reactions.
III. Results and Discussion
Experimental measurements on quinones.
Fifteen common 1,4-benzoquinone derivatives were selected for preliminary study (Chart 1), and cyclic voltammetry was used to measure the 1 e– and 2 e–/2 H+ reduction potentials for each derivative (see Table S1 in the Supporting Information). The 1 e– reduction potentials were measured under aprotic conditions [0.1 M (Bu4N)PF6 in MeCN], while the 2 e–/2 H+ potentials were determined in acidic aqueous solution 1 M p-TsOH). Reversible (or quasi-reversible) voltammograms were observed under both conditions for most derivatives, and in all cases it was possible to identify an appropriate mid-point potential.(21,22 Our measured reduction potentials correlate well with available values in the literature (cf. Tables S5 and S9) but, importantly, provide a self-consistent set of data for analysis.
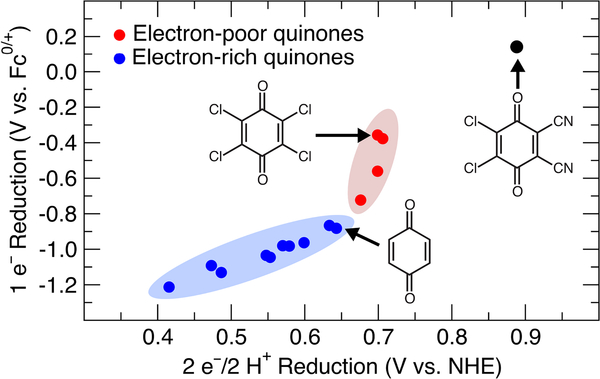
The plot in Figure 1 depicts the relationship between the 1 e– and the 2 e–/2 H+ reduction potentials for the quinones shown in Chart 1. This plot reveals the absence of a linear correlation between these values for the full set of quinones. On the other hand, systematic trends are evident within subsets of related quinones, including (1) the alkyl- and alkoxy-substituted quinones (blue) and (2) halogenated quinones (red). Chloranil 2,3,5,6-tetrachloro-1,4-benzoquinone) is a classical “high-potential” quinone that finds widespread use as an oxidant in organic chemistry.2c It exhibits a significantly higher (i.e., less negative) 1 e– reduction potential than 1,4-benzoquinone (BQ) (DEmp = 525 mV); however, the 2 e–/2 H+ reduction potential of chloranil is only slightly higher (i.e., more positive) than that of BQ (ΔEmp = 56 mV). In comparison, duroquinone (2,3,5,6-tetramethyl-1,4-benzoquinone) has both a significantly lower 1 e– and 2 e–/2 H+ reduction potential than BQ (ΔEmp = 331 mV and 227 mV, respectively). To our knowledge, this unusual result and the factors contributing thereto have not been highlighted or addressed previously in the literature. In order to gain insights into this behavior, computational studies were initiated to probe the 1 e– and 2 e–/2 H+ reduction potentials for an even wider range of quinones.
Figure 1.
Plot of experimental 1 e– (MeCN) versus 2 e–/2 H+ (1 M p-TsOH) reduction potentials for the 1,4-benzoquinone derivatives depicted in Chart 1.
Chart 1.
Quinones used in Experimental Study
Benchmarking computational methods for quinones.
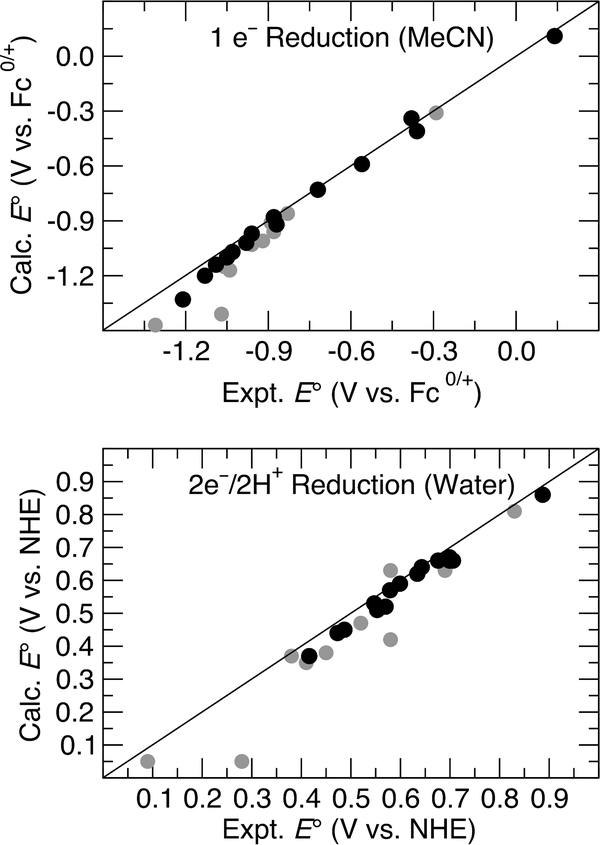
The calculated reduction potentials for numerous quinones were compared to experimental measurements (cf. Chart 1 and Chart S1 and Tables S2 and S3 in the Supporting Information). As shown in Figure 2, excellent agreement was observed between the calculated and experimental 1 e– and 2 e–/2 H+ reduction potentials. The most significant deviations were observed for anthraquinone, naphthoquinone, and ortho-quinone derivatives (gray circles) that are structurally quite different from the reference species (see Supporting Information for details). These deviations decrease if a different reference species (i.e., a different correction constant) is used for each type of structurally distinct quinone. Similarly good agreement between the calculated and experimental reduction potentials was observed when different functionals were used (Figure S31).
Figure 2.
Plots correlating calculated and experimental reduction potentials for diverse quinones (see Chart S1 and Tables S2 and S3 in the Supporting Information for details). Gray circles indicate anthraquinone, naphthoquinone, and ortho-quinone derivatives that are structurally quite different from the reference species (1).
Analysis of linear correlations.
Following these benchmarking studies, we compiled a list of systematically varied mono-, di-, tri-, and tetra-substituted quinones (Chart 2). For each quinone derivative, the aqueous reduction potentials and pKa values involved in the thermodynamic cycle in Scheme 1 were then calculated. From these data, the reduction potentials associated with the corresponding PCET reactions (diagonal steps in Scheme 1) were determined. The full set of data is compiled in the Supporting Information (Table S11).
Chart 2.
Chemical Structures and Numbers of Quinone Systems Studied
Linear correlations between thermodynamic properties have provided insights into many catalytic systems,15d,23 and the pKa values and reduction potentials of quinone derivatives have been shown previously to correlate with Hammett parameters.7d,24 Therefore, the pKa and E° data acquired for the 134 quinones were plotted as a function of an effective Hammett constant, defined as the sum of the substituents’ Hammett constants (Σσ).25 As in previous studies, the σm values were used for halogen substituents to better account for inductive effects,24d,e,26 the σp– values were used for substituents capable of conjugating with the quinone π system,24b and the σp values were used for all other substituents.24a,c,e,26
Figure 3 illustrates that the 2 e–/2 H+ potentials are approximately linearly correlated with the effective Hammett constant. The reduction potentials and pKa values underlying the 2 e–/2 H+ potentials also exhibit approximately linear correlations with the Σσ parameter (see Table S11 in the Supporting Information for a full compilation of the individual reduction potentials and pKa values). As expected, more electron-donating substituents (i.e., lower Σσ) decrease the 1 e– reduction potentials because they make it less favorable to add an electron but increase the pKa values because they enhance the basicity of the quinone oxygen atoms. These offsetting trends are evident in a “leveling” of the PCET reduction potentials,27 manifested by a less steep dependence of the PCET reduction potentials relative to the 1 e– reduction potentials on the effective Hammett constant.
Figure 3.
Plot of the 2 e–/2 H+ reduction potentials (filled black circles), the sum of the pKa values (filled gray circles), and the average of the two 1 e– reduction potentials (open gray circles) as functions of the sum of the Hammett constants (Σσ) for all substituted quinones in Chart 2. As discussed in the text, intramolecular proton transfer (PT) may occur in the Q•– and Q2– states for the SH, OH, or CO2H substituents, but is not included in the calculated values shown in this figure. This intramolecular PT does not impact the 2 e-/2 H+ reduction potentials but does impact the breakdown into the individual contributions from reductions and external protonations.
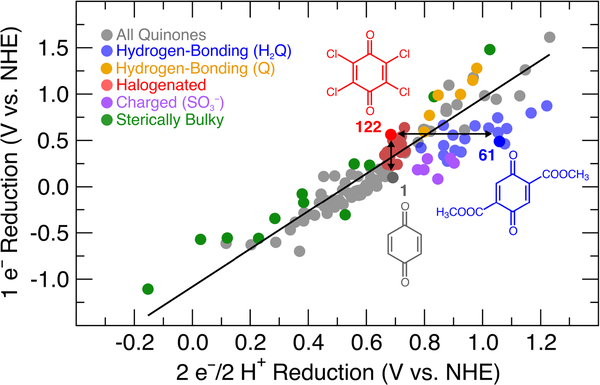
The full set of data for these 134 quinones provided an opportunity to conduct a thorough assessment of 1 e– versus 2 e–/2 H+ reduction potentials (Figure 4), analogous to the preliminary experimental data shown in Figure 1. The data in Figure 4 exhibit a reasonably linear overall correlation between the 1 e– and 2 e–/2 H+ reduction potentials; however, deviations from the linear trendline can be quite significant. For example, as noted above, chloranil (122) and benzoquinone (1) exhibit >500 mV difference in their 1 e– potentials, but they have very similar and even slightly inverted 2 e–/2 H+ potentials. Conversely, other quinone structures exhibit similar 1 e– potentials but significantly different 2 e–/2 H+ potentials. For example, the 2,5-bis(methoxycarbonyl)-substituted quinone 61 has a 1 e– reduction potential 74 mV lower than that of chloranil, but its 2 e–/2 H+ potential is nearly 400 mV higher.
Figure 4.
Plot of the 1 e– reduction potentials versus the 2 e–/2 H+ reduction potentials for the quinones in Chart 2, with colors identifying the physical basis for deviations from the global linear trend. The line was generated by a linear fit to only the gray data points.
Analysis of deviations from linear correlations.
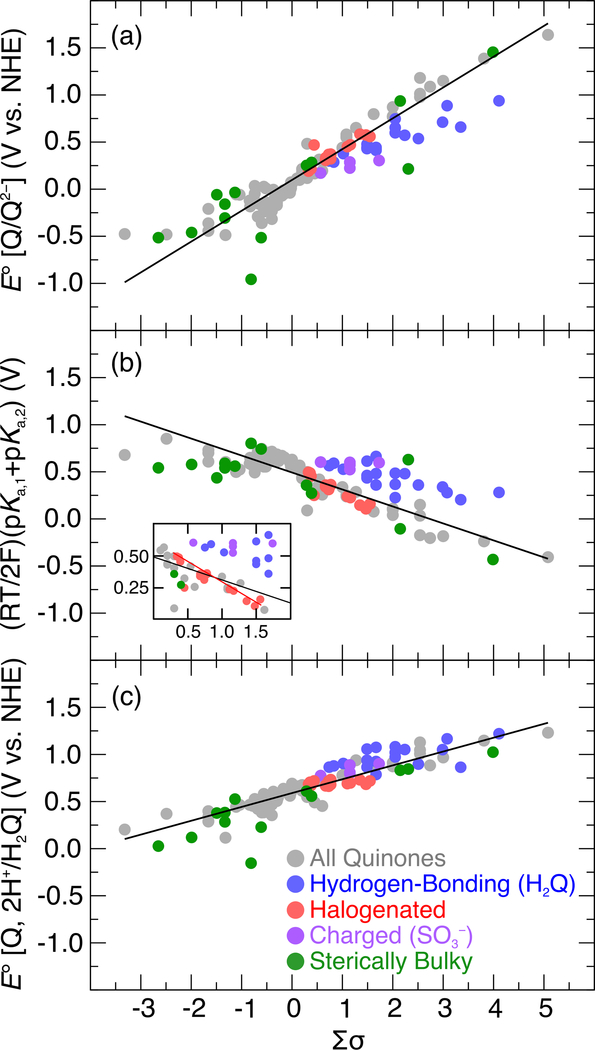
Insights into the origin of deviations from the linear global trendline in Figure 4 may be gained by reassessment of the Hammett correlations shown in Figure 3. Four different classes of substituents were found to contribute significantly to the deviations: (1) hydrogen-bonding and conjugating substituents, (2) halogen substituents, (3) charged substituents, and (4) sterically bulky substituents (see Table S10 of the Supporting Information for a listing of the specific identities of quinones within each class). A variation of Figure 3, in which the quinones in each of these classes are color-coded as in Figure 4 and the 2 e–/2 H+ reduction potentials are separated from the contributing 1 e– reduction potentials and pKa values, is provided in Figure 5. The influence of the different classes of substituents on the 1 e– reduction potential, the pKa value, and the 2 e–/2 H+ reduction potential is summarized in Table 1 and elaborated below.
Figure 5.
Correlations between the average 1 e– reduction potentials (a), the sum of the two pKa values (b), and the 2 e–/2 H+ reduction potentials (c) of quinones 1–134 and their effective Hammett constants (∑σ). The gray data points are used to generate the linear fits, and the colored data points were found to exhibit deviations from these linear fits and are defined in the legend, with the specific substituents in each group given in the SI (Table S10). For each substituent, its Hammett constant can be used to determine the expected value of a given property on the line, and the shift from the linear Hammett correlation is the difference between the calculated value for this substituent and the expected value. These shifts are summarized in Table 1. As discussed in the text, intramolecular PT may occur in the Q•– and Q2− states for the SH, OH, or CO2H substituents, but this contribution is not included in the calculated values shown in this figure. This intramolecular PT does not impact the 2 e-/2 H+ reduction potentials but does impact the individual contributions from reductions and external protonations. Because this intramolecular PT occurs spontaneously for the dianion in the hydrogen-bonded conformation for the CO2H substituents (Figure S36), these species are not included in this figure to avoid inconsistencies in the analysis. The analogous figure for the 1 e- reduction potentials, including the CO2H substituents, is given in Figure S37.
Table 1.
Analysis of Substituent Effects on 1 e– Reduction Potentials, pKa Values, and 2 e–/2 H+ Reduction Potentials Relative to the Linear Hammett Trendsa
| 1 e– Reduction Potential | pKa Values | 2 e–/2 H+ Reduction Potential | |
|---|---|---|---|
| Hydrogen bond accepting (H2Q) and conjugating | Less positive | Increase | More positive |
| Hydrogen bond donating (Q) and conjugatingb | More positive | Increase | More positive |
| Halogen | No shift | Decrease | Less positive |
| Charged and hydrogen bonding | Less positive | Increase | More positive |
| Sterically bulky | More positive | Decrease | Less positive |
The effect of each type of substituent is compared to the expected reduction potential or pKa determined from the linear Hammett correlations (Figure 5 and Figure S37). For each substituent, its Hammett constant is used to determine the expected value of a given property on the line given in Figure 5 or Figure S37 for the 1 e- reduction potential, and the shift is the difference between the calculated value for this substituent and the expected value.
Note that these substituents are also hydrogen bond accepting (H2Q).
(1). Hydrogen-bonding and conjugating substituents (blue and orange points in Figure 4 and blue points in Figure 5).
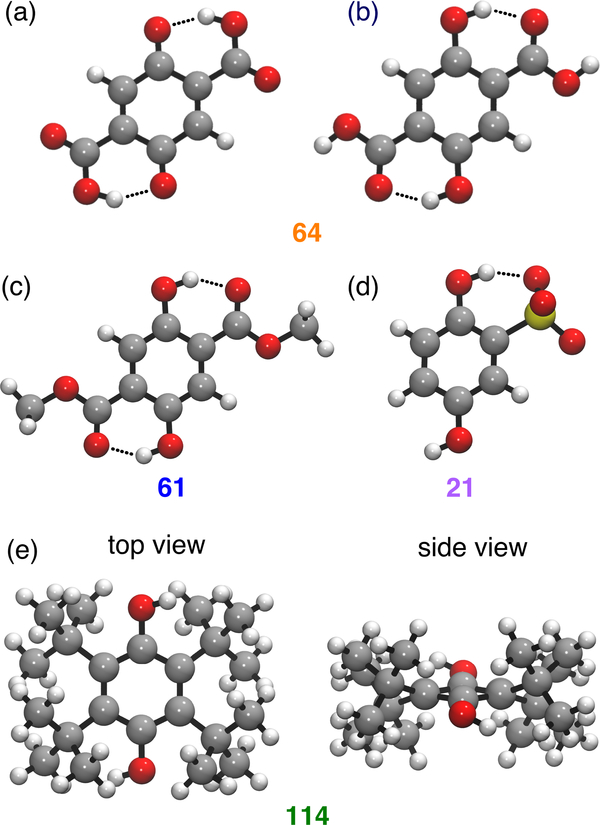
These substituents can act as either hydrogen bond donors (orange points) or acceptors (blue and orange points). Due to complications with intramolecular proton transfer (PT), which is discussed further below, the substituents that can act as hydrogen bond donors are not analyzed in the context of Figure 5. Quinones with substituents that can act as hydrogen bond acceptors (e.g., R = CHO, COCH3, CO2CH3, CO2H) stabilize the –OH groups of hydroquinones (Figure 6b and 6c), leading to the higher-than-expected pKa values associated with this class of quinones in Figure 5b (blue points). In addition, many of the hydrogen-bonding substituents are carbonyl groups that conjugate with the quinone π system, thereby shifting the 1 e– reduction potentials to less positive values than expected from the Hammett correlation in Figure 5a (blue points). The effect on pKa values is more pronounced than the effect on 1 e– reduction potentials, resulting in a net shift of the 2 e–/2 H+ reduction potentials to more positive values, relative to the Hammett correlation in Figure 5c. A manifestation of this effect is the unusually high 2 e–/2 H+ potential for quinone 61 highlighted above and depicted in Figure 4. Quinones with substituents that can act as hydrogen bond donors (e.g., R = CO2H) stabilize the quinone state (Figure 6a), leading to more positive than expected 1 e- reduction potentials (orange points in Figure S37). In general, the substituents that can act only as hydrogen bond acceptors will lead to quinones that appear to the right of the trendline in Figure 4 (blue points) because the stronger substituent effect on the pKa values increases their relative 2 e–/2 H+ reduction potentials. The substituents that can act as both hydrogen bond donors and acceptors will lead to quinones that appear to the left of the trendline in Figure 4 (orange points) because of the dominant effect from the more positive 1 e- reduction potentials.
Figure 6.
DFT-optimized structures of substituted benzoquinones: (a) 64, showing the hydrogen bonds between the substituent -OH and the C=O in the neutral quinone state (Q); (b) 64, showing the hydrogen bonds between the substituent C=O and the –OH in the hydroquinone state (H2Q); (c) 61, showing the hydrogen bonds between the substituent C=O and the –OH in the hydroquinone state; (d) 21, showing the hydrogen bond between the SO3– substituent and the –OH in the hydroquinone state; and (e) 114, showing the nonplanar six-membered ring and the out-of-plane proton positions to illustrate steric effects.
(2). Halogen substituents (red points in Figures 4 and 5).
Halogen substituents exhibit relatively little effect on the 2 e–/2 H+ reduction potentials of quinones, as is evident from the nearly vertical trendline for halogenated quinones in Figures1 and 4. The strong electronwithdrawing inductive effect of the halogens24d,e,26 has a significant influence on both 1 e– reduction potentials and pKa values; however, the influence is nearly equal and opposite, resulting in a net “redox leveling” effect for the 2 e–/2 H+ potentials.27 The 1 e– reduction potentials of halogenated quinones fall directly on the Hammett correlation in Figure 5a, while the pKa values show a more negative slope than the other quinones (inset of Figure 5b). The net impact of these effects is evident in a comparison of the properties of halogenated quinones and the parent benzoquinone (1): whereas halogenated quinones have 1 e– reduction potentials that extend nearly 500 mV beyond that of 1, their 2 e–/2 H+ reduction potentials differ from 1 by only ~100 mV. These observations suggest that the term “high-potential quinone” for chloranil and related halogenated quinones is only appropriate in the context of their 1 e– reduction potentials.
(3). Charged substituents (purple points in Figures 4 and 5).
Anionic substituents, such as sulfonate, can act as hydrogen bond acceptors and thereby increase the pKa values, similar to the other hydrogen-bonding substituents discussed above (Figure 6d). Electrostatic effects will also increase the pKa values because protonation is more favorable for negatively charged molecules (Figure 5b). On the other hand, electrostatic effects will destabilize reduced quinones and thereby shift the 1 e– reduction potentials to more negative values (Figure 5a). The substituent effect on the pKa values is more pronounced than the effect on the 1 e– reduction potentials, accounting for the net shift of the 2 e–/2 H+ reduction potentials to more positive values, relative to the Hammett correlation in Figure 5c. As a corollary, charged substituents shift the 2 e–/2 H+ reduction potentials to the right of the global trendline in Figure 4, similar to other hydrogenbonding substituents (cf. blue and purple circles in Figure 4). Electrostatic effects account for the more negative 1 e– reduction potentials associated with quinones bearing negatively charged substituents, relative to those with other hydrogen-bonding substituents (cf. Figures 4 and 5a).
(4). Sterically bulky substituents (green points in Figures 4 and 5).
Quinones with sterically bulky substituents, particularly those with large groups in adjacent 2,3- and/or 5,6-positions, can deviate significantly from the Hammett correlations. In most cases, they cause an increase in the 1e– reduction potentials to more positive values and a decrease in the pKa values relative to the linear Hammett correlations (Figures 5a and 5b). The 1 e– reduction potentials could be affected by sterically induced distortion of the (hydro)quinone six-membered ring (Figure 6e). The decrease in pKa values could arise from steric clashing between the bulky substituents and the hydroquinone –OH. Because the pKa effects tend to be more significant, the 2 e–/2 H+ reduction potentials mostly fall below the linear Hammett correlation in Figure 5c. This behavior is also demonstrated by a shift of the 2 e–/2 H+ reduction potentials to lower values, namely to the left of the trendline in Figure 4.
In addition to these four effects, some substituents (e.g., R = SH, OH, CO2H) can undergo intramolecular PT to the quinone oxygen in the quinone radical anion or dianion. An analysis of this intramolecular PT is provided in Figure S36. These calculations indicate that intramolecular PT is not thermodynamically favorable in the quinone radical anions for most of these substituents, and, if it is favorable, the free energy difference is only ~1 kcal/mol. However, intramolecular PT is more thermodynamically favorable in the quinone dianions for quinones substituted with SH, OH, and CO2H. Thus, the 2 e- reduction potentials for these systems may not be experimentally relevant and should be viewed only as analysis tools to examine the individual contributions to the 2 e-/2 H+ reduction potentials, which are not affected by intramolecular PT (Scheme 1).
Collectively, these results have important implications for the active and growing field of quinone redox chemistry. Whereas quinone-mediated reactions in organic chemistry often proceed via single electron transfer or hydride transfer (i.e., 2 e–/1 H+),(2e,28 applications of quinones in energy storage and conversion processes often involve electrochemical 2 e–/2 H+ PCET processes, which will be more strongly influenced by the proton affinity of the (reduced) quinone species. The term “high potential quinone” is commonly used in organic chemistry to describe DDQ, chloranil, and related halogenated quinones, but the results described herein reveal that this term could be misleading in the context of redox transformations that involve PCET processes.
The results summarized in Table 1 will be especially valuable in the design of quinones with tailored redox properties. Substituent effects on pKa values and 1 e– reduction potentials typically have offsetting influences on the 2 e–/2 H+ reduction potentials, as shown in Figure 3. Nevertheless, the deviations of the 2 e–/2 H+ reduction potentials from systematic scaling relationships (i.e., Figures 4 and 5c) tend to follow the direction of the substituent effects on pKa values. For example, the use of hydrogen-bonding and/or negatively charged substituents appears to be particularly well-suited to shift the 2 e–/2 H+ potentials of quinones to more positive values, owing to their increased hydroquinone pKa values. On the other hand, halogen substituents are especially effective in modulating 1 e– reduction potentials, while having minimal impact on the 2 e–/2 H+ potentials. The influence of sterically bulky substituents is more complicated, but the results suggest that these groups may be used to shift the 2 e–/2 H+ potential to less positive values.
The differential substituent effects on 1 e– and 2 e–/2 H+ reduction potentials could find utility in quinone-catalyzed aerobic oxidation reactions (Scheme 2). For example, chloranil is a versatile oxidant in organic chemistry (see the right half-reaction in Scheme 2, i.e., SubH2 → Subox), and this synthetic utility probably reflects its high 1 e– reduction potential (cf. Figure 1). However, chloranil is typically used as a stoichiometric oxidant. Meanwhile, benzoquinone has been implemented successfully as a co-catalyst in a number of aerobic oxidation reactions.29 The studies described herein suggest that chloranil or other “high potential quinones” could be regenerated by O2 (cf. Scheme 2) at least as readily as benzoquinone if the reaction proceeds via a PCET pathway, on the basis of their similar 2 e–/2 H+ potentials (cf. Figure 1). Recent empirical studies support this prospect,30 and mechanistic studies of catalytic aerobic oxidation of hydroquinones implicated a PCET pathway.(4a,31
Scheme 2.
Simplified Catalytic Cycle for Quinone-Catalyzed Aerobic Oxidation of an Organic Substrate (SubH2)
IV. Conclusion
In this work, experimental measurements identified non-linear correlations between the 1 e– and 2 e–/2 H+ reduction potentials for a set of 15 1,4-benzoquinone derivatives. Subsequent DFT calculations of the 1 e– reduction potentials, pKa values, and 2 e–/2 H+ reduction potentials for a set of 134 substituted quinones revealed approximately linear correlations between these properties and an effective Hammett constant associated with the substituents. More importantly, the calculations identified deviations from these linear scaling relationships for specific classes of substituents, thereby providing an explanation for the experimentally observed non-linear correlations between the 1 e– and 2 e–/2 H+ reduction potentials. The substituent effects on the pKa values tend to be the primary factor governing deviations from the linear Hammett correlations. Such effects may be used to shift the 2 e–/2 H+ reduction potential to more positive values (i.e., using hydrogen-bonding and negatively charged substituents) or to less positive values (i.e., using sterically bulky substituents). Halogenation of quinones may be used to alter the 1 e– reduction potential with minimal impact on the 2 e–/2 H+ reduction potential.
The results of this study, together with recent reports by others,(3c,d clearly demonstrate the utility of DFT calculations in reproducing and predicting reduction potentials and pKa values of quinones. One can anticipate that future computational screening studies will play a valuable role in the discovery of new quinones for targeted applications. Meanwhile, the four intuitive parameters identified in this study, namely hydrogen bonding, halogenation, charges, and sterics, may be used to tailor the redox properties of quinones in ways that deviate from standard electronic linear scaling relationships. These parameters especially highlight the importance of considering the effects of quinone substituents on the pKa values of the reduced quinones. Ongoing studies are now being directed toward implementing these concepts in the development of new catalytic and energy storage and conversion applications.
Supplementary Material
Acknowledgements
We thank Dr. James Gerken and Yu-Heng (Larry) Wang for assistance with experimental determination of quinone potentials. This work was supported as part of the Center for Molecular Electrocatalysis, an Energy Frontier Research Center funded by the U.S. Department of Energy, Office of Science, Office of Basic Energy Sciences, and a National Science Foundation Graduate Research Fellowship Grant (DGE-1144245, MTH). Portion of this work were also supported by the National Institute of Health (R01-GM100143, CWA and SSS).
Footnotes
Supporting Information
This material is available free of charge via the Internet at http://pubs.acs.org.
Experimental reduction potentials; Hammett constants used; calculated reduction potentials and pKa values; analysis of tautomers; Cartesian coordinates and energies of all optimized systems.
References
- (1).(a) Mitchell P J. Theor. Biol 1976, 62, 327. [DOI] [PubMed] [Google Scholar]; (b) Søballe B; Poole RK Microbiology 1999, 145, 1817. [DOI] [PubMed] [Google Scholar]; (c) Paddock ML; McPherson PH; Feher G; Okamura MY Proc. Natl. Acad. Sci. U. S. A 1990, 87, 6803. [DOI] [PMC free article] [PubMed] [Google Scholar]
- (2).(a) Becker H-D; Turner AB in The Quinonoid Compounds, Vol. 2, Eds.: Patai S and Rappoport Z; John Wiley & Sons, Inc.: Chichester, UK, 1988. [Google Scholar]; (b) Goor G; Glenneberg J; Jacobi S in Ullmann’s Encyclopedia of Industrial Chemistry; Wiley-VCH: Weinheim, 2012. [Google Scholar]; (c) Buckle DR Chloranil in Encyclopedia of Reagents for Organic Synthesis; John Wiley & Sons, Inc.: New York, 2001. [Google Scholar]; (d) Buckle DR; Collier SJ; McLaws MD 2,3-Dichloro-5,6-dicyano-1,4-benzo-quinone in Encyclopedia of Reagents for Organic Synthesis; John Wiley & Sons, Inc.: New York, 2005. [Google Scholar]; (e) Wendlandt AE; Stahl SS Angew. Chem. Int. Ed. 2015, 54, 14638. [DOI] [PMC free article] [PubMed] [Google Scholar]
- (3).For leading refernces, see: (a) Cheng M; Yang X; Zhang F; Zhao J; Sun L Angew. Chem. Int. Ed 2012, 51, 9896. [DOI] [PubMed] [Google Scholar]; (b) Rausch B; Symes MD; Cronin L J. Am. Chem. Soc 2013, 135, 13656. [DOI] [PubMed] [Google Scholar]; (c) Huskinson B; Marshak MP; Suh C; Er S; Gerhardt MR; Galvin CJ; Chen X; Aspuru-Guzik A; Gordon RG; Aziz MJ Nature 2014, 505, 195. [DOI] [PubMed] [Google Scholar]; (d) Er S; Suh C; Marshak MP; Aspuru-Guzik A Chem. Sci 2015, 6, 885.. [DOI] [PMC free article] [PubMed] [Google Scholar]
- (4).(a) Anson CW; Ghosh S; Hammes-Schiffer S; Stahl SS J. Am. Chem. Soc 2016, 138, 4186 For a related study, see: [DOI] [PubMed] [Google Scholar]; (b) Gerken JB; Stahl SS ACS Cent. Sci 2015, 1, 234. [DOI] [PMC free article] [PubMed] [Google Scholar]
- (5).(a) Wendlandt AE; Stahl SS Org. Lett 2012, 14, 2850. [DOI] [PubMed] [Google Scholar]; (b) Wendlandt AE; Stahl SS J. Am. Chem. Soc 2014, 136, 506. [DOI] [PMC free article] [PubMed] [Google Scholar]; (c) Wendlandt AE; Stahl SS J. Am. Chem. Soc 2014, 136, 11910. [DOI] [PMC free article] [PubMed] [Google Scholar]
- (6).For leading references to related work by others, see: (a) Largeron M; Neudorffer A; Fleury M-B Angew. Chem. Int. Ed 2003, 42, 1026. [DOI] [PubMed] [Google Scholar]; (b) Largeron M; Fleury M-B Angew. Chem. Int. Ed 2012, 51, 5409. [DOI] [PubMed] [Google Scholar]; (c) Yuan H; Yoo W-J; Miyamura H; Kobayashi SJ Am. Chem. Soc 2012, 134, 13970. [DOI] [PubMed] [Google Scholar]; (d) Yuan H; Yoo W-J; Miyamura H; Kobayashi S Adv. Synth. Catal 2012, 354, 2899. [Google Scholar]; (e) Qin Y; Zhang L; Lv J; Luo S; Cheng J-P Org. Lett 2015, 17, 1469. [DOI] [PubMed] [Google Scholar]; (f) Largeron M; Fleury M-B Chem. Eur. J 2015, 21, 3815. [DOI] [PubMed] [Google Scholar]
- (7).(a) Clark WM Oxidation-Reduction Potentials of Organic Systems; The Williams & Wilkins Company: Baltimore, 1960. [Google Scholar]; (b) Evans DH Chapter XII-1. Carbonyl Compounds in Encyclopedia of Electrochemistry; Eds.: Bard AJ; Marcel Dekker, Inc.: New York, 1978; pp. 198–204. [Google Scholar]; (c) Wardman P J. Phys. Chem. Ref. Data 1989, 18, 1637. [Google Scholar]; (d) Frontana C; Vázquez-Mayagoitia Á; Garza J; Vargas R; González I J. Phys. Chem. A 2006, 110, 9411. [DOI] [PubMed] [Google Scholar]; (e) Warren JJ; Tronic TA; Mayer JM Chem. Rev 2010, 110, 6961. [DOI] [PMC free article] [PubMed] [Google Scholar]; (f) Song Y; Buettner GR Free Radic. Biol. Med 2010, 49, 919. [DOI] [PMC free article] [PubMed] [Google Scholar]
- (8).Bosch E; Rathore R; Kochi JK J. Org. Chem. 1994, 59, 2529.. [Google Scholar]
- (9).(a) Becke AD J. Chem. Phys. 1993, 98, 5648. [Google Scholar]; (b) Lee C; Yang W; Parr RG Phys. Rev. B 1988, 37, 785. [DOI] [PubMed] [Google Scholar]
- (10).(a) Clark T; Chandrasekhar J; Spitznagel GW; Schleyer PVR J. Comput. Chem 1983, 4, 294. [Google Scholar]; (b) Ditchfield R; Hehre WJ; Pople JA J. Chem. Phys 1971, 54, 724. [Google Scholar]; (c) Hehre WJ; Ditchfield R; Pople JA J. Chem. Phys 1972, 56, 2257. [Google Scholar]; (d) Hariharan PC; Pople JA Theor. Chim. Acta 1973, 28, 213. [Google Scholar]; (e) Francl MM; Pietro WJ; Hehre WJ; Binkley JS; Gordon MS; DeFrees DJ; Pople JA J. Chem. Phys 1982, 77, 3654. [Google Scholar]; (f) Frisch MJ; Pople JA; Binkley JS J. Chem. Phys 1984, 80, 3265. [Google Scholar]
- (11).(a) Barone V; Cossi M J. Phys. Chem. A 1998, 102, 1995. [Google Scholar]; (b) Cossi M; Rega N; Scalmani G; Barone V J. Comput. Chem. 2003, 24, 669. [DOI] [PubMed] [Google Scholar]
- (12).Bondi A J. Phys. Chem. 1964, 68, 441. [Google Scholar]
- (13).(a) Floris F; Tomasi J J. Comput. Chem. 1989, 10, 616. [Google Scholar]; (b) Floris FM; Tomasi J; Ahuir JLP J. Comput. Chem 1991, 12, 784. [Google Scholar]
- (14).Pierotti RA Chem. Rev. 1976, 76, 717. [Google Scholar]
- (15).(a) Qi X-J; Fu Y; Liu L; Guo Q-X Organometallics 2007, 26, 4197. [Google Scholar]; (b) Solis BH; Hammes-Schiffer S Inorg. Chem 2011, 50, 11252. [DOI] [PubMed] [Google Scholar]; (c) Fernandez LE; Horvath S; Hammes-Schiffer SJ Phys. Chem. C 2012, 116, 3171. [Google Scholar]; (d) Chen S; Ho M-H; Bullock RM; DuBois DL; Dupuis M; Rousseau R; Raugei S ACS Catal. 2014, 4, 229. [Google Scholar]
- (16).Perdew JP Phys. Rev. B 1986, 33, 8822. [DOI] [PubMed] [Google Scholar]
- (17).Becke AD Phys. Rev. A 1988, 38, 3098. [DOI] [PubMed] [Google Scholar]
- (18).Zhao Y; Truhlar DG Theor. Chem. Acc. 2007, 120, 215. [Google Scholar]
- (19).(a) Grimme S J. Comput. Chem 2006, 27, 1787. [DOI] [PubMed] [Google Scholar]; (b) Becke AD J. Chem. Phys 1997, 107, 8554. [Google Scholar]; (c) Kamiya M; Tsuneda T; Hirao K J. Chem. Phys. 2002, 117, 6010. [Google Scholar]; (d) Chai J-D; Head-Gordon M Phys. Chem. Chem. Phys 2008, 10, 6615. [DOI] [PubMed] [Google Scholar]
- (20).Frisch MJ; Trucks GW; Schlegel HB; Scuseria GE; Robb MA; Cheeseman JR; Scalmani G; Barone V; Mennucci B; Petersson GA; Nakatsuji H; Caricato M; Li X; Hratchian HP; Izmaylov AF; Bloino J; Zheng G; Sonnenberg JL; Hada M; Ehara M; Toyota K; Fukuda R; Hasegawa J; Ishida M; Nakajima T; Honda Y; Kitao O; Nakai H; Vreven T; Montgomery JA; Peralta JE; Ogliaro F; Bearpark M; Heyd JJ; Brothers E; Kudin KN; Staroverov VN; Kobayashi R; Normand J; Raghavachari K; Rendell A; Burant JC; Iyengar SS; Tomasi J; Cossi M; Rega N; Millam JM; Klene M; Knox JE; Cross JB; Bakken V; Adamo C; Jaramillo J; Gomperts R; Stratmann RE; Yazyev O; Austin AJ; Cammi R; Pomelli C; Ochterski JW; Martin RL; Morokuma K; Zakrzewski VG; Voth GA; Salvador P; Dannenberg JJ; Dapprich S; Daniels AD; Farkas; Foresman JB; Ortiz JV; Cioslowski J; Fox DJ Gaussian 09, Revision D.01; Gaussian, Inc.: Wallingford CT, 2010. [Google Scholar]
- (21).As observed previously by others, the second 1 e– reduction of benzoquinone derivatives under non-aqueous conditions has slower electrode kinetics than the first 1 e– reduction, resulting in quasi-reversible behavior. For discussion, see the following: (a) Peover ME; Davies JD J. Electroanal. Chem. 1963, 6, 46. [Google Scholar]; (b) Rüssel C; Janicke WJ Electroanal. Chem. 1986, 199, 139. [Google Scholar]
- (22). Some benzoquinone derivatives exhibit quasi-reversible CVs under aqueous conditions, with more reversible behavior observed at slower scan rates. Nevertheless, the mid-point potential shows minimal variation with scan rate (≤ 10–15 mV). See Supporting Information for CVs (Figures S1-S30).
- (23).(a) Solis BH; Hammes-Schiffer S J. Am. Chem. Soc 2011, 133, 19036. [DOI] [PubMed] [Google Scholar]; (b) Driscoll EW; Hunt JR; Dawlaty JM J. Phys. Chem. Lett 2016, 7, 2093. [DOI] [PubMed] [Google Scholar]
- (24).(a) Prince RC; Dutton PL; Bruce JM, FEBS Lett. 1983, 160, 273. [Google Scholar]; (b) Bordwell FG; Cheng JJ Am. Chem. Soc 1991, 113, 1736. [Google Scholar]; (c) Driebergen RJ; Moret EE; Janssen LHM; Blauw JS; Holthuis JJM; Postma Kelder SJ; Verboom W; Reinhoudt DN; van der Linden WE Anal. Chim. Acta 1992, 257, 257. [Google Scholar]; (d) Heffner JE; Raber JC; Moe OA; Wigal CT J. Chem. Ed 1998, 75, 365. [Google Scholar]; (e) Lemmer C; Bouvet M; Meunier-Prest R Phys. Chem. Chem. Phys 2011, 13, 13327. [DOI] [PubMed] [Google Scholar]
- (25).Hansch C; Leo A; Taft RW Chem. Rev 1991, 91, 165. [Google Scholar]
- (26).Heffner JE; Wigal CT; Moe OA Electroanalysis 1997, 9, 629. [Google Scholar]
- (27).Huynh MHV; Meyer TJ Chem. Rev 2007, 107, 5004. [DOI] [PMC free article] [PubMed] [Google Scholar]
- (28).(a) Carlson BW; Miller LL J. Am. Chem. Soc 1985, 107, 479. [Google Scholar]; (b) Guo X; Mayr H J. Am. Chem. Soc 2014, 136, 11499. [DOI] [PubMed] [Google Scholar]; (c) Guo X; Zipse H; Mayr HJ Am. Chem. Soc 2014, 136, 13863. [DOI] [PubMed] [Google Scholar]
- (29).Piera J; Bäckvall J-E Angew. Chem. Int. Ed 2008, 47, 3506. [DOI] [PubMed] [Google Scholar]
- (30).(a) Miyamura H; Shiramizu M; Matsubara R; Kobayashi S Angew. Chem. Int. Ed 2008, 47, 8093. [DOI] [PubMed] [Google Scholar]; (b) Miyamura H; Maehata K; Kobayashi S Chem. Commun 2010, 46, 8052. [DOI] [PubMed] [Google Scholar]
- (31).(a) Simandi TM; May Z; Szigyarto IC; Simandi LI Dalton Trans. 2005, 365. [DOI] [PubMed] [Google Scholar]; (b) Horak KT; Agapie T J. Am. Chem. Soc 2016, 138, 3443. [DOI] [PubMed] [Google Scholar]
Associated Data
This section collects any data citations, data availability statements, or supplementary materials included in this article.


