

Abstract
Non‐alcoholic fatty liver disease (NAFLD) is an increasingly common and potentially serious condition, which has emerged with the obesity epidemic. This disease can progress to cirrhosis and hepatocellular cancer. Associated comorbidities, such as cardiovascular disease and type 2 diabetes, are common. Obesity is the key risk factor and diet appears to be a critical factor in the pathogenesis of NAFLD. We reviewed studies undertaken on human subjects investigating which dietary components initiate excess hepatic triglyceride deposition. Most experimental diets used high‐calorie excesses, or extreme proportions of fat or carbohydrate, not typical of current dietary patterns. Hypercaloric diets, where the additional calories were predominantly either fat or carbohydrates, increased intrahepatocellular lipids. The type of fat appeared important, with diets high in saturated fatty acids favoring hepatic fat accumulation which was substantially lower with polyunsaturated fatty acids. The effect of dietary fructose on markers of NAFLD did not appear to be worse than that of glucose. The initiation of excess hepatic triglycerides is likely to be a complex interaction of energy and nutrients with more than one dietary factor involved. It was not possible to disentangle the hepatic effects of excess energy from that of different macronutrient distributions in current literature. Further investigation is needed to determine the type of diet that is likely to lead to the development of NAFLD. A better understanding of the contribution of diet to pathogenesis of NAFLD would better inform prevention strategies.
Keywords: diet, etiology, metabolism, non‐alcoholic fatty liver disease, obesity
Introduction
Non‐alcoholic fatty liver disease (NAFLD), defined as excessive lipid accumulation in hepatocytes (>5% wet weight) in the absence of excess alcohol intake or other pathological causes, has emerged in parallel with the obesity epidemic,1 with reported prevalence rates as high as 30%.2, 3 The disease encompasses a spectrum of conditions ranging from simple fatty liver (steatosis) through to fat deposition with inflammation and fibrosis (non‐alcoholic steatohepatitis or NASH) as shown in Figure 1.4 NAFLD can progress to cirrhosis and hepatocellular cancer,5 and is becoming one of the leading causes of terminal liver failure and reasons for liver transplant.6, 7 While most individuals have simple fatty liver disease and do not develop the more serious forms of the disease, all those with NAFLD have an increased risk of associated extrahepatic conditions, particularly cardiovascular disease8, 9 and type 2 diabetes.10
Figure 1.
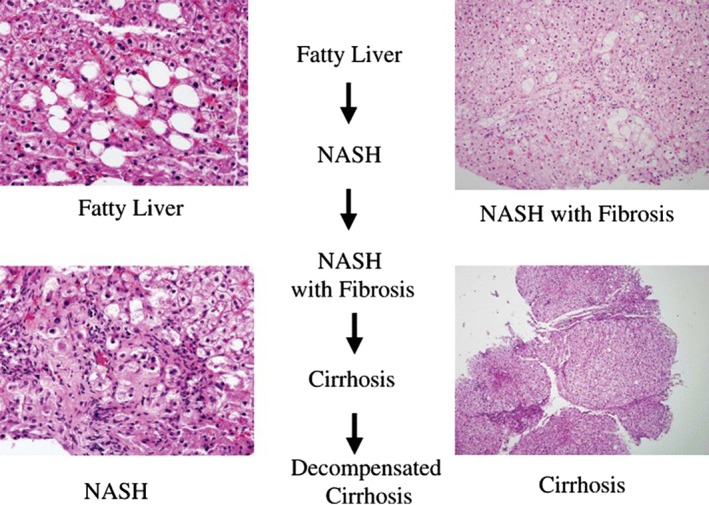
Progression of NAFLD to cryptogenic cirrhosis; steatosis disappears and histology becomes unhelpful as disease progresses to cirrhosis [Reprinted by permission from Macmillan Publishers Ltd: The American Journal of Gastroenterology (4), copyright (2006), (doi:10.1111/j.1572‐0241.2006.00478.x)]. NAFLD, non‐alcoholic fatty liver disease; NASH, non‐alcoholic steatohepatitis.
The risk of NAFLD increases with age,11, 12, 13 but obesity is the key risk factor. Diet is most likely a contributing factor. However, it is unclear if a particular dietary composition or simply excess calories, irrespective of the macronutrient composition of the diet, contributes to the pathogenesis of NAFLD.5 This article provides an overview of NAFLD and insulin resistance (IR), and reviews the literature on dietary components and dietary patterns that may initiate excess hepatic fat deposition in human subjects.
Methods
Databases were systematically searched in January 2017. Databases searched included: MEDLINE (PubMed), Scopus, Web of Science, Cochrane CENTRAL Register of Controlled Trials; Cochrane Database of Systematic Reviews, http://clinicaltrials.gov, EMBASE, and SIGLE (System for Information on Grey Literature). Keywords searched included: “excess fat” OR “fat accumulation” OR lipid* OR “De novo lipogenesis” OR DNL OR Triacyglycer*AND diet OR “dietary pattern*” OR “dietary habit*” OR “dietary component*” OR “dietary make*up” OR “dietary composition” OR “composition of diet” OR overfeed* OR “hypercaloric diet*” OR “isogenic diet*” AND liver OR hepatic AND Human AND Initiat* OR trigger OR factor AND NAFLD OR “Non*alcoholic fatty liver disease”. Articles and reviews were limited to those published in English and studies investigating humans. Animal studies were excluded by NOT rat* or mice.
The title and abstract were reviewed first by KPHS for relevance. If the article or review was relevant, it was read in full and assessed for inclusion criteria. Studies or reviews that had a measure of liver function or steatosis (either by radiological imaging or liver enzymes), investigated an adult population, and some dietary aspect either by observation or by intervention (using a validated measure of dietary assessment) were reviewed in full by KPHS and KJC.
Overview of NAFLD and IR
Hepatic steatosis is the net result of a positive balance of fatty acids (FAs) with excess FAs stored as triglycerides in the liver. Implicit in this dysregulation of FA metabolism is IR, a diminished cellular response to insulin.14 Normally, insulin is released in response to food consumption and increased blood glucose levels, thereby mediating the cellular uptake of glucose in skeletal muscle, adipose tissue, and liver, and suppressing endogenous production of glucose through lipolysis, glycolysis, and gluconeogenesis. In IR, the cellular insulin signaling pathway is defective and cells cannot readily absorb glucose from the bloodstream, thereby leading to hyperglycemia. This stimulates further insulin production resulting in hyperinsulinemia. High insulin levels do not suppress lipolysis, gluconeogenesis, or glycolysis.14, 15
An overview of the metabolism of glucose and FAs in NAFLD is shown in Figure 2. The current understanding is that the pathological process of IR begins in the periphery in both musculoskeletal cells and adipose tissue. Unsuppressed lipolysis in adipose tissue increases levels of circulating free FAs (FFAs), which are either metabolized through β‐oxidation or stored in the liver. Accumulation of excess FAs in the liver promotes hepatic IR. The cycle propagates itself as hepatic IR leads to increased glucose output through gluconeogenesis and glycolysis, as well as de novo lipogenesis (DNL), further promoting peripheral IR.16, 17 Glycerol is also released during lipolysis, and this provides a further substrate for gluconeogenesis.
Figure 2.
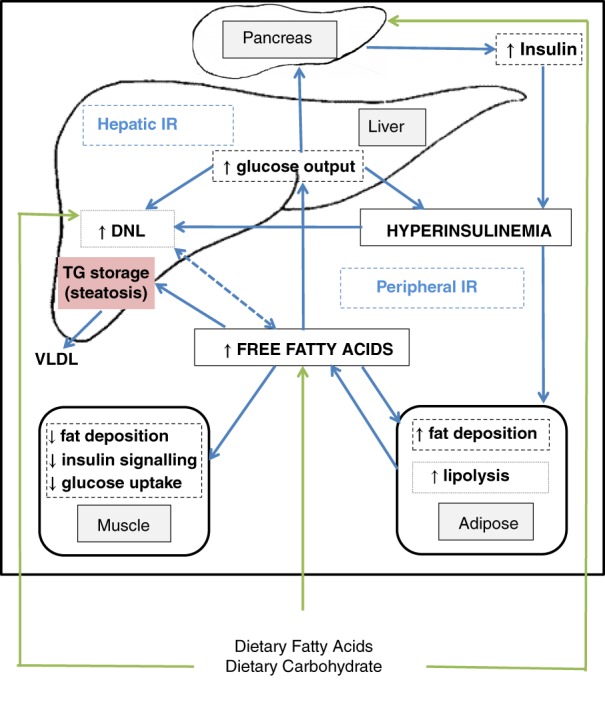
Simplified overview of non‐alcoholic fatty liver disease metabolism. DNL, de novo lipogenesis; IR, insulin resistance; TG, triglyceride; VLDL, very low density lipoprotein.
In IR, the combination of increased gluconeogenesis and impaired cellular uptake of glucose exacerbates both hyperglycemia and hyperinsulinemia, further stimulating DNL and increased production of FFAs, which also promote DNL.16, 17 Glucose also stimulates DNL directly in the liver and indirectly via hyperinsulinemia, which also further exacerbates the already dysregulated FA metabolism.15, 18, 19
DNL is also indirectly promoted via the transcription factors, sterol regulatory element‐binding proteins, and carbohydrate‐responsive element‐binding protein. Sterol regulatory element‐binding proteins, stimulated by insulin, regulate the genes involved in DNL in the liver, and carbohydrate‐responsive element‐binding proteins released in response to glucose activate enzymes involved in glycolysis and lipogenesis. These actions also increase circulating FFAs.20
Diet
Descriptions of dietary patterns among patients with NAFLD from observational studies do not contribute much to our understanding of possible dietary triggers of hepatic fat accumulation. These descriptive studies in patients with NAFLD21, 22, 23, 24, 25, 26, 27, 28 provide a snapshot of dietary intakes at a single point in time, which does not necessarily reflect the dietary pattern(s) that may have contributed to the development of NAFLD. Furthermore, accurate assessments and measurements of dietary intakes are difficult as most records use self‐reported estimated portions rather than weighed food records. Commonly used dietary measures are 3‐ or 7‐day food records which at the most provide a 1‐week description of food intakes. Food frequency questionnaires, which give some indication of dietary patterns over time, are also used. Recognized problems with these methods include recall bias and inaccurate estimates of volumes and weights of consumed foods.29 Because of these methodological problems, experimental studies have sought to determine the effect of different diets and dietary patterns on hepatic fat accumulation and liver function. We found few such published studies conducted on human subjects (n = 19), but they provide some insights. These experimental studies are summarized in Table 1.
Table 1.
Experimental studies examining the effect of different diets on measures of liver fat in healthy normal weight or overweight populations
| Study | Participants baseline characteristics | Method of liver fat assessment | Dietary intervention | Duration diet | Key findings |
|---|---|---|---|---|---|
| Bortolotti et al. (2009)30
Randomized Crossover |
10 Healthy, but sedentary men Mean age: 24 ± 1 years Mean BMI: 22.4 ± 0.6 kg/m2 Non‐smokers No family history of diabetes |
H‐MRS | In randomized order, a balanced isocaloric control diet or high‐fat (HF) or high‐fat high‐protein (HFHP) diet. All three diets designed to provide same total carbohydrate intake, and the HF and HFHP diets designed to provide same fat intake | 4 days | HF diet nearly doubled intrahepatocellular lipids (IHCL) by 90 ± 26% (P < 0.02) HFHP diet increased the IHCLs to a lesser extent. The increase in IHCL was 22 ± 32% (P < 0.02) less in the HFHP diet compared with the HF diet AST and ALT were not altered by either diet, except for a 28 ± 15% increase in ALT with the HFHP diet (P < 0.02) No change in insulin sensitivity |
| van der Meer et al. (2008)31 | 15 Healthy men who undertook regular moderate intensity exercise Mean ± SD age: 25 ± 6.6 years Mean ± SD BMI: 23.4 ± 2.5 kg/m2 |
H‐MRS | Reference diet (mean TE intake approximately 2100 kcal/day with 40% carbohydrates, 35% fat, and 25% protein. Experimental high‐fat, high‐energy (HFHE) diet consisting of the reference diet, plus 800 mL cream daily (an extra 2632 kcal/day). TE intake approximately 4732 kcal/day with 20% carbohydrates, 69% fat, and 11% protein | 3 days | After HFHE, hepatic triglyceride content increased more than twofold compared with baseline from 2.01 ± 1.79 to 4.26 ± 2.78% (P = 0.001)No change in mean BMI |
| Lammert et al. (2000)32 | 10 Pairs of healthy men High‐carbohydrate diet group Mean ± SE age: 22.3 ± 1.7 years Mean ± SE weight: 76.4 ± 8.8 kg HF diet group Mean ± SE age: 22.4 ± 1.9 years Mean ± SE weight: 73.4 ± 6.7 kg |
Fractional hepatic DNL using mass isotopomer distribution analysis | Energy intake increased by 5 MJ/day with either a carbohydrate‐rich (HC) or fat‐rich diet (HF) over and above each individual's usual habitual diet Each individual in a pair was randomly assigned to the HC diet or the HF diet |
21 days | Overall, both groups gained 1.5 kg body weight HC group gained 1.35 ± 0.42 kg (P = 0.01) and HF group gained 1.58 ± 0.41 kg (P = 0.006). There was no difference between the groups |
| Heilbronn et al. (2013)33 | 40 Sedentary non‐smoking non‐diabetic men (n = 20) and women (n = 20) Mean ± SE age: 37 ± 2 years Mean ± SE BMI: 25.6 ± 0.6 kg/m2 Mean (SE) weight 75.3 ± 1.9 kg |
CT | For 3 days prior to experimental diet, all foods were provided at baseline energy requirements with a nutrient composition of 30% fat, 15% protein, and 55% carbohydrates Then, overfed 1250 kcal/day with nutrient composition 45% fat, 15% protein, and 40% carbohydrates |
28 days | Liver density increased from 55 ± 2 to 53 ± 2 HU (P < 0.001) Weight increased by 2.8 to 78.1 ± 1.9 kg (P < 0.001) BMI increased by 1.0 to 26.6 ± 0.6 kg/m2 (P < 0.001) Fasting serum glucose, insulin, and HOMA‐IR increased independent of gender |
| Kechagias et al. (2008)34 | 18 Healthy men (n = 12) and women (n = 6) and 18 matched controls Cases (intervention group): Mean ± SD age: 27 ± 6.6 years Mean ± SD BMI: 21.9 ± 1.9 kg/m2 Controls: Mean ± SD age: 25 ± 3.5 years Mean ± SD BMI: 22.2 ± 2.1 kg/m2 |
H‐MRS | Hyperalimentation diet: an extra two fast food‐based meals per day with the goal to double their regular caloric intake to achieve a body weight increase of 5–15% in combination with the adoption of a sedentary lifestyle | 4 weeks, or earlier if reached 15% weight gain goal | Controls maintained their body weight with BMI remaining the same 17 of the 18 intervention groups met the goal of a 5–15% body weight increase. They gained 6.4 kg and BMI significantly increased to 23.9 ± 2.2 kg/m2 (P < 0.001) Liver fat content increased from 1.1 ± 1.9 to 2.8 ± 4.8% over the diet period in cases (P = 0.003) |
| Sevastianova et al. (2012)35 | 16 Non‐diabetic men (n = 5) and women (n = 11) Median age: 54 years (25th–75th percentile: 40–59 years) Mean ± SE BMI: 30.6 ± 1.2 kg/m2 |
H‐MRS | High‐carbohydrate hypercaloric (HCHC) diet: participant's normal diet plus extra 1000 kcal/day with 98% of energy from carbohydrates | 3 weeks | Weight increased by 2% from 88.7 ± 4.1 to 90.5 ± 4.1 kg (P < 0.0001), BMI by 3% from 30.6 ± 1.2 to 31.2 ± 1.3 kg/m2 (P < 0.0005) and liver fat by 27% from 9.2 ± 1.9 to 11.7 ± 1.9% (P = 0.005) with the HCHC diet With the weight loss diet, weight decreased by 4% from 90.5 ± 4.1 to 87.3 ± 4.1 kg (P < 0.0001), BMI from 31.2 ± 1.3 to 30.0 ± 1.3 kg/m2 (P < 0.0005) and liver fat by 25% from 11.7 ± 1.9 to 8.8 ± 1.8% (P < 0.05) |
| Dietitian‐guided weight loss diet | 6 months | ||||
| Koopman et al. (2014)37
RCT |
36 Healthy men randomized to a control group or one of the four experimental diets Mean ± SD age for five groups ranged from 21.5 ± 1.9 to 23.0 ± 3.1 years Mean ± SD BMI for five groups ranged from 21.7 ± 1.1 to 22 ± 2.3 kg/m2 |
H‐MRS | All four diets 40% caloric surplus in addition to normal diet: high‐fat high‐sugar diet with extra calories eaten either with meals (HFHS‐S) or as a snack 2–3 h after meals (HFHS‐F) High sugar only diet with extra calories eaten either with meals (HS‐S) or 2–3 h after meals (HS‐F) |
6 weeks | No change in weight or IHTG in control group Overall, diet groups gained 2.5 ± 1.7 kg with no differences between the four diet groups IHTG significantly increased in the HFHS‐F (0.98 ± 0.91% vs 1.38 ± 1.26%; P = 0.018) and the HS‐F (1.49 ± 0.95% vs 3.10 ± 2.16%; P = 0.043) groups, and was higher in the HS‐F group (P = 0.043) No change in IHTG in the two groups with increased meal size (HFHS‐S and HS‐S) Overall, effect of increased meal size versus increased frequency eating (P = 0.03, F = 5.435) but not of HFHS versus HS (P = 0.13, F = 2.418) |
| Westerbacka et al. (2005)38
Randomized crossover |
10 Women Mean ± SD age: 43 ± 5 years Mean ± SD BMI: 33 ± 4 kg/m2 (range: 27–38 kg/m2) |
H‐MRS | Two isocaloric diets consumed successively: a low fat (LF) 16% TE, and an HF 56% TE | 2 weeks | Body weight was unchanged during LF and HF diets Mean ± SD liver fat at baseline 10 ± 7%. Liver fat decreased by 20 ± 9% during the LF diet and increased by 35 ± 21% during the HF diet (P < 0.014 for liver fat after LF vs HF diets; P < 0.042 for change in liver fat by the LF vs HF diet) |
| Van Herpen et al. (2011)39
RCT |
20 Overweight sedentary healthy men randomized to two groups LF group (n = 10) Mean ± SE age: 54.0 ± 2.3 years Mean ± SE BMI: 29.3 ± 0.6 kg/m2 HF group (n = 10) Mean (SE) age: 56.4 ± 2.5 years Mean (SE) BMI: 28.3 ± 0.5 kg/m2 |
H‐MRS | LF run‐in diet consisting of 15% protein, 65% carbohydrates, and 20% fat | 3 weeks | IHLs decreased by 13% in the LF group and increased by 17% in the HF group (P = 0.047) Insulin sensitivity was unaffected Liver enzymes and body weight were unchanged |
| Randomized to continue LF diet or change to isocaloric HF diet consisting of 15% protein, 55% carbohydrates, and 30% fat | 6 weeks | ||||
| Rosqvist et al. (2014)40
RCT |
37 Healthy normal weight men randomized to two groups Saturated fat group (13 men, 5 women) Mean ± SD age: 26.7 ± 4.6 years Mean (IQR) BMI: 20.8 (19.5–23.1) Polyunsaturated fat group (13 men, 6 women) Mean ± SD age: 27.1 ± 3.6 years Mean (IQR) BMI: 19.9 (18.9–20.7) |
MRI | Addition of one of the two types of muffins to habitual diet to achieve 3% weight gain Muffins high in palm oil saturated fat (SFA diet), or Muffins high in sunflower oil polyunsaturated fat (PUFA diet) Composition of muffins: 5% protein, 44% carbohydrates, and 55% fat Number of muffins eaten per day was adjusted to achieve 3% weight gain. Average 3.1 muffins (or 750 kcal) eaten per person/day |
7 weeks | Both groups gained 1.6 kg in weight. Liver fat increased more in the SFA group compared with the PUFA group. The increase in the PUFA group was 0.04 ± 0.24% from 0.75% (IQR: 0.65–1.0%) compared with 0.56 ± 1.0% from 0.96% (IQR 0.79–1.1%) in the SFA group. Mean (95% CI) difference in change was −0.52 (−1.0 to −0.01; P = 0.033) |
| Bjermo et al. (2012)41
RCT |
61 Men (n = 21) and women (n = 40); 15% type 2 diabetes PUFA group (n = 32) Median (IQR) age: 57 (51–63) years Mean ± SD BMI: 30.3 ± 3.7 kg/m2 SFA group (n = 29) Median (IQR) age: 56 (50–64) years Mean ± SD BMI: 31.3 ± 3.9 kg/m2 |
H‐MRS (and MRI) | Quality of fat in diet changed without altering intakes of total fat, and type and amount of carbohydrates and protein. Randomly assigned to one of the two different diets PUFA diet: isocaloric diet high in vegetable n‐6 PUFA diet (14% of TE (increase of 10%) SFA diet: isocaloric diet high in SFA mainly from butter (20% of TE (increase of 5%) |
10 weeks | Nonsignificant weight increase in both groups. Mean ± SD weight gain was 0.4 ± 1.4 kg in PUFA group and 0.8 ± 1.6 kg in SFA group (P = 0.41) Liver fat decreased by 0.9% (95% CI: −1.7 to 0.0; MRS) from 3.2% (95% CI: 1.0 to 6.6) with the PUFA diet, and increased by 0.3% (95% CI: −0.6 to 1.8) from 3.2% (95% CI: 1.3 to 7.7) with the SFA diet. The between‐group difference in relative change from baseline was 34% (P = 0.02) |
| Lecoultre et al. (2013)43
Non‐randomized |
55 Healthy men Mean ± SD age: 22.5 ± 1.6 years Mean ± SD BMI: 22.4 ± 1.6 kg/m2 |
H‐MRS | All consumed a balanced isocaloric control diet first, then this diet was supplemented with one of the following five overfeeding diets: 1.5 g fructose/kg/day (F1.5) (n = 7), or 3 g fructose/kg/day (F3) (n = 17), or 4 g fructose/kg/day (F4) (n = 10), or 3 g glucose/kg/day (G3) (n = 11), or 30% excess energy as saturated fat (fat30%) (n = 10) |
All diets 6–7 days | F3, F4, G3, and fat30% diets all significantly increased intrahepatic lipid content by 113 ± 86% (P < 0.05), 102 ± 115% (P < 0.05), 59 ± 92% (P < 0.05), and 90 ± 74% (P < 0.05) as compared to control, respectively F4 and G3 diets also increased hepatic glucose production by 16 ± 10% (P < 0.05) and 8 ± 11% (P < 0.05) |
| Sobrecases et al. (2010)44 | 30 Healthy men Mean ± SE age: 23.9 ± 0.4 years Mean ± SE BMI: 22.6 ± 0.2 kg/m2 |
H‐MRS | Isocaloric control (C) diet with 55% carbohydrates (10% simple sugars), 30% fat (10% saturated fat), and 15% protein Followed by one of the following diets: (1) High‐fructose (HFr) diet (3.5 g fructose per kg fat‐free mass per day, +35% energy, n = 12) (2) HF diet (fat: +30% energy, +18% as saturated fat, n = 10) 3) High‐fructose high‐fat (HFrHF) diet (HFr diet combined with HF diet, n = 8) |
Control diet: 7 days HFr diet: 7 days HF diet: 4 days HFrHF diet: 4 days |
Body weight increased on average by 0.3 ± 0.1 kg and was not different across the three experimental hypercaloric diets Intrahepatocellular lipids increased after each of the experimental hypercaloric diets; HFr diet by 16%, HF diet by 86%, and HFrHF by 133%. The increase after the combined HFrHF diet was significantly higher than with the HFr or HF diets (P < 0.05) |
| Johnston et al. (2013)45
Randomized parallel arm |
32 Healthy but centrally overweight men randomized to one of two groups Fructose group (n = 15) Mean ± SD age: 35 ± 11 years Mean ± SD BMI: 30.0 ± 1.4 kg/m2 Glucose group (n = 17) Mean ± SD age: 33 ± 9 years Mean ± SD BMI: 28.9 ± 1.7 kg/m2 |
H‐MRS | Pre‐intervention energy balanced (isocaloric) diet, then randomized to HFr, or high glucose (HG) for two separate intervention periods. The first period was an isocaloric diet and the other a hypercaloric diet. For the isocaloric diet, fructose or glucose provided 25% of the predicted total daily energy requirements and were consumed four times a day in divided amounts mixed with 500 mL of water. Remainder of diet provided 75% of energy requirements, and the food was provided to ensure isocaloric status, and overall diet with 55% carbohydrates, 15% protein, and 30% fat. For the hypercaloric diet, ad libitum habitual food consumption plus the same amount of fructose or glucose consumed in isocaloric period. Extra sweetened drinks were forbidden |
2 weeks each with a 6‐week washout between diets | Body weight was maintained during isocaloric diets, but significantly increased during the hypercaloric diets by 1.0 ± 1.4 kg in HFr group and 0.6 ± 1.0 kg in HG group with no significant difference between these groups (P = 0.29) Similarly, no change in absolute concentrations of triacylglycerides in liver during isocaloric diets, but significantly increased during the hypercaloric diets by 1.70 ± 2.6% in HFr group and 2.05 ± 2.9% in HG group with no significant difference between these groups (P = 0.73) |
| Stanhope et al. (2009)46
Double‐blinded parallel arm |
32 Healthy men (n = 16) and premenopausal women (n = 16) randomized to one the of two groups. Glucose group (n = 15) Men (n = 7) Mean ± SE age: 54 ± 3 years Mean ± SE BMI 29.3 ± 1.1 kg/m2 Females n = 8 Mean ± SE age: 56 ± 2 years Mean ± SE BMI: 29.4 ± 1.3 kg/m2 Fructose group (n = 17) Men (n = 9) Mean ± SE age: 52 ± 4 years Mean ± SE BMI 28.4 ± 0.7 kg/m2 Females n = 8 Mean ± SE age: 53 ± 2 years Mean ± SE BMI 30.3 ± 1.0 kg/m2 |
Hepatic fractional DNL via infusion of isotopic acetate | Three phases: (1) Inpatient baseline energy balanced diet with 55% carbohydrates, 15% protein, and 30% fat. Carbohydrate was mostly complex (2) Hypercaloric diet: ad libitum diet plus 25% of daily energy consumed as fructose or glucose (3) Isocaloric diet: inpatient energy balanced diet with 25% of daily energy from fructose or glucose Fructose and glucose were consumed as fructose‐ or glucose‐sweetened beverages with meals |
Baseline: 2 weeks Hypercaloric: 8 weeks Isocaloric: 2 weeks Total intervention period: 10 weeks |
Both groups significantly gained weight between baseline and 10 weeks. The percentage change at 10 weeks was 1.8 ± 0.5% (P < 0.01) for the glucose group and 1.4 ± 0.3% (P < 0.001) for the fructose group Fractional DNL unchanged during glucose consumption both in fasting (8.8% ± 1.8% vs 9.5% ± 1.8%; P = 0.47) and postprandial 13.4% ± 2.8% vs 14.2% ± 1.7%; P = 0.31) states Fasting DNL was unaffected during fructose consumption but postprandial DNL significantly increased from 11.4 ± 1.3 to 16.9% ± 1.4% (P = 0.02) |
| Maersk et al. (2012)47
Randomized parallel arm |
47 Healthy men (n = 17) and women (n = 30) allocated to one of the four groups Regular cola (6 men, 4 women) Mean ± SE age: 39 ± 6 years Mean ± SE BMI: 31.3 ± 2.9 kg/m2 Milk (3 men, 9 women) Mean ± SE age: 38 ± 9 years Mean ± SE BMI: 31.9 ± 2.8 kg/m2 Diet cola (3 men, 9 women) Mean ± SE age: 39 ± 8 years Mean ± SE BMI: 32.8 ± 3.8 kg/m2 Water (5 men, 8 women) Mean ± SE age: 39 ± 8 years Mean ± SE BMI: 32.2 ± 4.6 kg/m2 |
H‐MRS | Participants consumed 1 L per day of one of the four different test drinks: (1) Regular sucrose‐sweetened cola (50% glucose and 50% fructose) (2) Semi‐skim milk, the amount equivalent in energy to the regular cola (3) Aspartame‐sweetened diet cola (4) Still mineral water In addition, they were allowed to drink water, tea, coffee, and usual amount of alcohol |
6 months | Body weight increased in a small amount in all groups but difference between groups was not significant (P = 0.8). The percentage increase was 1.28 ± 1.1% in sugar‐sweetened cola group, 1.36 ± 1.1% in milk group, 0.114 ± 1.1% in diet cola group, and 0.576 ± 1.0% in water group Liver fat accumulation was much higher after regular cola (overall P = 0.01) compared with milk (143%; 95% CI: 50, 236; P < 0.05), diet cola (139%; 95% CI: 50, 227; P < 0.05), and water (132%; 95% CI: 43, 222; P < 0.05) |
| Utzschneider et al. (2013)48
RCT |
35 Non‐diabetic men (n = 7) and women (n = 13) from an Alzheimer's disease project randomized to one of the two diets Low fat/low saturated fat with a low GI (LSAT) diet group (7 men, 13 women) Mean ± SE age: 69.3 ± 1.6 years Mean ± SE BMI: 26.9 ± 0.8 kg/m2 High fat/high saturated fat with a high GI (HSAT) diet group (6 men, 9 women) Mean ± SE age: 68.6 ± 1.8 years Mean ± SE BMI: 28.1 ± 0.9 kg/m2 |
H‐MRS | Two commercially prepared weight maintenance diets with the following composition (1) LSAT: 23% fat (of which 7% saturated fat), 15–20% protein, 55–60% carbohydrates, and a daily average GI <55 2) HSAT: 45% fat (of which 25% saturated fat), 15–20% protein, 35–40% carbohydrates, and a daily average GI >70 |
4 weeks | Body weight did not change significantly in either group Liver fat absolute % decreased significantly in the LSAT group compared with baseline from median 2.2 to 1.7% (P = 0.002, unadjusted; P < 0.05 adjusted). Mean ± SE percentage decrease in liver fat was 19.8 ± 6.0% Neither absolute percentage liver fat nor percentage change in liver fat changed significantly on the HSAT diet (median liver fat % 1.2 at baseline and 1.6 at 4 weeks) |
| Bozzetto et al. (2012)49
Randomized parallel group |
45 Men (n = 37) and women (n = 8) with type 2 diabetes with satisfactory glycemic control on diet or diet and metformin assigned to one of the four diets (1) High CHO/fiber Mean ± SE age: 58 ± 5 years Mean ± SE BMI: 30 ± 2 kg/m2 (2) High MUFA Mean ± SE age: 57 ± 8 years Mean ± SE BMI: 28 ± 3 kg/m2 3) High CHO/fiber + physical activity Mean ± SE age: 63 ± 5 years Mean ± SE BMI: 31 ± 3 kg/m2 (4) High MUFA + physical activity Mean ± SE age: 57 ± 9 years Mean ± SE BMI: 30 ± 4 kg/m2 |
H‐MRS | All diets were isoenergetic in order to keep body weight constant, but differed in macronutrient composition Randomized to either: (1) High carbohydrate high fiber low GI (high CHO/fiber): 52% carbohydrates, 28 g/1000 kcal fiber, GI 60%, 30% fat, and 16% MUFA (2) High monounsaturated fat (high MUFA): 40% carbohydrates, 10 g/1000 kcal fiber, GI 95%, 42% fat, 28% MUFA, 18% protein, 7% saturated fat, and 4% polyunsaturated fat (3) High CHO/fiber+Ex: high CHO/fiber diet plus physical activity program (4) High MUFA + Ex: high MUFA diet plus physical activity program Other dietary components were similar in the two diets including saturated fat (7%), protein (18%), and PUFA (4%) |
8 weeks | Body weight did not change significantly in any group Liver fat content significantly decreased in MUFA group from 7.4 ± 2.8 to 5.2 ± 2.7% (P = 0.01) and MUFA + Ex group from 11.6 ± 8.0 to 9.1 ± 7.4% (P = 0.02) Liver fat content did not change in the CHO/fiber group (17.7 ± 9.7% vs 16 ± 6.8%; P = 0.295) or CHO/fiber + Ex group (8.8 ± 4.9% vs 8.9 ± 5.7%; P = 0.794) There was a significant effect on liver fat content for diet (P = 0.006), with no effects for exercise training (P = 0.789) |
| Faeh et al. (2005)50
Randomized crossover |
7 Healthy males Age range: 22–31 years BMI range: 20.2–25.4 kg/m2 |
Hepatic fractional DNL via infusion of isotopic acetate. Fractional DNL calculated by isotopomer distribution analysis technique. | Preceding each experimental diet, each subject consumed a provided control diet: isoenergetic with 15% protein, 35% fat, and 50% carbohydrates (40% starch and 10% from monosaccharide and disaccharide) Experimental diets: (1) Fish oil supplementation: control diet plus 7.2 g of fish oil (1.2 g eicosapentaenoic acid and 0.8 g docasahexaenoic acid) per day (2) Hyperenergetic high fructose (HHFr): control diet plus 3 g of fructose per kg body weight per day (additional 800–1000 kcal/day) taken with three main meals. Overall 11% protein, 26% fat, and 63% carbohydrates (30% starch and 8% from monosaccharide and disaccharide, and 25% fructose) (3) Combination: control diet plus fish oil supplementation and HHFr |
Control only diet: 3 days Fish oil: 28 days HHFr: 6 days Washout of 12 weeks following each of fish oil supplement diets |
Body weight was stable in all groups DNL was very low among fish oil only group and control group (1.9 ± 0.44 and 1.6 ± 0.34%, respectively). DNL significantly increased after both high‐fructose diets but was higher after HHFr diet (9.4 ± 2.8%, P < 0.05) compared with combination diet (7.5 ± 1.8%, P < 0.05). The difference between these two high‐fructose diets was not significant |
| Theytaz et al. (2012)51
Randomized crossover |
9 Healthy, but sedentary men Mean ± SE age: 23.3 ± 0.9 years Mean ± SE BMI: 22.6 ± 0.5 kg/m2 |
H‐MRS | Three dietary interventions: (1) Control diet: weight maintenance diet with 55% carbohydrates, 30% fat, and 15% protein. (2) Hypercaloric high‐fructose + essential amino acid diet (HFrAA): control diet plus 3 g fructose per kg per day and 6.77 g of five essential amino acids three times per day (3) Hypercaloric high‐fructose + placebo (HFr): control diet plus 3 g fructose per kg per day and a placebo three times per day |
6 days with 4–10 weeks washout period between each diet | Both HFr and HFrAA diets increased IHCL content compared with the control diet (P < 0.05) but the increase was 16.1% lower with HFrAA than with HFr (P < 0.05) IHCL (vol %) was 1.27 ± 0.31% with the control diet, 2.74 ± 0.55% with the HFrAA diet, and 2.30 ± 0.43% with the HFr diet No difference in body weight between the three diets |
ALT, alanine aminotransferase; AST, aspartate aminotransferase; BMI, body mass index; CT, computed tomography; DNL, de novo lipogenesis; FA, fatty acid; GI, glycemic index; H‐MRS, 1H‐magnetic resonance spectroscopy; HOMA‐IR, homeostatic model assessment of insulin resistance; IHCL, intrahepatocellular lipid concentration; IHTG, intrahepatic triglyceride; IQR, interquartile range; MRI, magnetic resonance imaging; MUFA, monounsaturated FA; PUFA, polyunsaturated FA; RCT, randomised controlled trial; SFA, saturated FA; TE, total energy.
Excess calories
Consumption of excess calories, either as fat or carbohydrates, can increase hepatic fat content within a few days. Overfeeding 10 healthy lean men, all with a normal liver, for 4 days with a high‐fat diet that increased energy intake by 30% almost doubled intrahepatocellular lipids from 12 to 22 mmol/kg wet weight (P < 0.02) as measured by 1H‐magnetic resonance spectroscopy (H‐MRS). Most of the additional energy was derived from saturated fat (mainly dairy products), with total dietary fat comprising 46% of total energy (TE) consumed.30 Similarly, when 15 healthy normal weight men increased their dietary energy intake by adding 800 mL of cream (11 000 kJ) daily for 3 days, mean levels of hepatic triglycerides, plasma triglycerides, and non‐esterified FAs significantly increased by 2.25% (P = 0.001), 1.6 mmol/L (P = <0.001), and 0.38 mmol/L (P = 0.002), respectively.31
When 10 pairs of healthy men aged 20–25 years consumed excess energy (5000 kJ) as either fat (58% TE) or carbohydrates (78% TE) for 21 days, their body weight and fat mass increased by a similar amount irrespective of whether the additional calories were consumed as fat or carbohydrates.32 In the men who consumed the hypercaloric high‐carbohydrate diet, fractional hepatic DNL (as measured by mass isotopomer distribution analysis) increased (up to 10‐fold), suggesting carbohydrates are converted to fat by lipogenesis (hepatic and extrahepatic). Overfeeding healthy men (n = 20) and women (n = 20) with an additional 1250 kcal per day (and an overall diet macronutrient distribution of 45% fat, 15% protein, and 40% carbohydrates) for 1 month significantly increased body weight and liver fat as measured by computed tomography (CT) scan, independent of gender (P ≤ 0.001).33 When healthy lean individuals consumed additional calories as fast food with the goal of gaining 5–15% of their body weight over 4 weeks, there was a significant increase in hepatic triglyceride content as measured with H‐MRS from 1.1 ± 1.9 to 2.8 ± 4.8% (P = 0.003).34 Energy intake more than doubled during the study (2273 ± 558 to 5753 ± 1495 kcal/day), whereas the macronutrient distribution stayed similar with a slight increase in TE from fats.
Carbohydrate overfeeding of an additional 1000 kcal per day from sugary drinks in 16 overweight participants (5 men and 11 women) rapidly increased liver fat content by 27% (as measured by magnetic resonance imaging [MRI]) over 3 weeks with a concurrent 2% increase in body weight.35 DNL (as measured by the lipogenic index36) and very low‐density lipoprotein (VLDL) triglycerides were also increased in proportion to liver fat (ratios: 2.1 ± 0.3 compared with 3.2 ± 0.5; P < 0.05 and 2.1 [1.9–2.3] compared with 2.6 [2.4–4.1], P < 0.005, respectively) but only in those participants with a certain genotype (wild‐type genotype [PNPLA3‐148II]) of the patatin‐like phospholipase domain‐containing protein 3 (PNPLA3) gene. A 6‐month hypocaloric diet reversed the weight and liver fat gain.35
The timing of when excess energy is consumed may also be important in the pathogenesis of NAFLD. The effect of excess calories (high carbohydrate or high carbohydrate high fat) consumed either between meals or as part of the three main daily meals for 6 weeks in healthy men with a normal body mass index (BMI) was studied.37 The source of carbohydrates was sugar in the form of sucrose‐sweetened soft drinks (50% glucose/50% fructose), and the high carbohydrate high fat excess calories were consumed as a commercial liquid meal containing 49% TE as carbohydrate (maltose and polysaccharides) and 35% TE as mainly unsaturated fat. All four intervention groups gained weight, but a significant increase in intrahepatocellular lipids was observed only in the men who consumed the excess calories between meals (P = 0.03). Intrahepatocellular lipids increased only in the groups with increased meal frequency and not in those who simply increased meal size. The percentage increase was greatest among men consuming the between‐meal snacks in the form of sugar‐sweetened beverage (from 1.49 ± 0.95 to 3.10 ± 2.16%, P = 0.043) compared with both carbohydrate and fat (from 0.98 ± 0.91 to 1.38 ± 1.26%, P = 0.018). No other similar studies were identified.
Dietary fat
The proportion of fat in the diet, as well as the type of fat, appears to influence hepatic fat deposition in both overweight and normal weight individuals. A crossover study of 10 metabolically healthy obese women found that a 2‐week high total fat (56% TE) isocaloric diet, of which half was consumed as saturated FAs (SFAs), significantly increased liver fat by 35%, whereas a 2‐week low total fat (16% TE) isocaloric diet significantly decreased liver fat by 20% (P = 0.042).38 A similar 3‐week study of 20 overweight men with healthy livers found that intrahepatic lipids significantly decreased by 13% with an isocaloric low‐fat (20% TE) diet, but increased by 17% with an isocaloric high‐fat (55% TE) diet (P = 0.047).39 The type of fat in these two diets was not specified, and body weight was not affected by either of these two short‐term isocaloric diets. In a randomized control trial, 39 normal weight men consumed an extra 750 kcal per day, either as SFAs or polyunsaturated FAs (PUFAs), in addition to their habitual diet for 7 weeks.40 Body weight increased by 1.6 kg in both groups, but the absolute increase in the percentage of liver fat was significantly higher in the SFA group compared with the PUFA group (0.56% vs 0.04%, P = 0.033).
Diets rich in vegetable n‐6 PUFAs have been shown to significantly decrease liver fat compared with diets rich in saturated fat. When 61 abdominally obese, free‐living men and women were randomized to consume a diet rich in vegetable n‐6 PUFAs or a diet rich in saturated fat (mainly from butter) for 10 weeks, a significant decrease in liver fat, as measured by MRI and H‐MRS, was observed in the PUFA‐rich diet group.41 At baseline ,mean liver fat content was the same for the two groups: PUFA diet (3.2%, 1.0–6.6 [H‐MRS]) and SFA diet (3.2%, 1.3–7.7 [H‐MRS]). During the experimental diets, liver fat decreased in the PUFA diet group and increased in the SFA diet group. The between‐group difference in the relative change in liver fat from baseline was 16% as measured by MRI (P < 0.001) and 34% as measured by H‐MRS (P = 0.02). Unlike other studies, participants in this study were instructed to change the type of fat in their diet without altering their total fat or the type and amount of carbohydrates and protein. While there was no change in dietary macronutrient proportions (as measured by 3‐day diet records), the TE consumed by both groups increased slightly, and nonsignificant increases in body weight were observed (0.4 ± 1.4 kg in the PUFA group and 0.8 ± 1.6 kg in SFA group).
Carbohydrate
Most experimental studies investigating the effect of carbohydrate on liver fat have focused on the monosaccharide, fructose, which is primarily metabolized in the liver, whereas glucose is mostly metabolized in extrahepatic tissues. This difference in metabolic pathways has advanced the hypothesis that fructose is more likely to increase hepatic fat content. However, studies to date suggest that the hepatic effect of fructose seems to be a function of high dietary intakes contributing excess energy rather than an effect of the fructose itself.42, 43, 44 Isocaloric exchange of fructose for other types of carbohydrates has not been shown to increase hepatic fat or liver enzymes in healthy individuals.42 A controlled feeding study compared the effect of 2‐week isocaloric and 2‐week hypercaloric diets containing either high fructose (25% TE) or high glucose (25% TE) consumed as drinks in 32 centrally obese but otherwise healthy men.45 Consumption of the hypercaloric diets, irrespective of the sugar type, increased body weight, liver and serum triacylglycerides, and liver enzymes. No significant hepatic changes were observed among the men who consumed either the high‐fructose or the high‐glucose isocaloric diets. However, in another similar but longer study, 32 overweight or obese adults (BMI: 25–35 kg/m2) with stable weights also consumed 25% of their energy requirements as either glucose‐sweetened (n = 15) or fructose‐sweetened (n = 17) drinks for 10 weeks.46 While both dietary groups had similar weight gains (+1.8% with glucose and +1.4% with fructose), hepatic DNL, markers of altered lipid metabolism, visceral adiposity, and IR were significantly increased only in the group that consumed the fructose‐rich diet. This latter study suggests that fructose may contribute differently to the pathogenesis of NAFLD than other monosaccharides, at least in those who are overweight or obese, but this difference does not appear to be apparent if fructose or other monosaccharides are consumed as excess energy.
As described above,36 the disaccharide, sucrose, which is a combination of fructose (50%) and glucose (50%), has been shown to significantly increase liver fat (as measured by MRI), at least when it is the main source of excess calories. When 47 overweight individuals were randomly assigned to consume one of the four different test drinks (1 L of sucrose‐sweetened regular cola and an equivalent amount of calories consumed as milk, aspartame‐sweetened diet cola, or water) daily for 6 months, the change in liver fat between baseline and 6 months was substantially higher in the sugar‐sweetened cola group compared with all other groups.47 The relative increase in the accumulation of liver fat in this group was 143% compared with the milk group (95% CI: 50, 236; P < 0.05), 139% compared with the diet cola group (95% CI: 50, 227; P < 0.05), and 132% compared with the water group (95% CI: 43, 222; P < 0.05). This was observed despite no significant changes in participants’ fat mass.
Nutrient interactions
Dietary intake, of course, is not limited to a single nutrient, but a number of different nutrients of varying amounts and proportions, and they can interact with each other. The different potential nutrient interactions can have an impact on nutrient bioavailability, and may influence hepatic fat accumulation. However, the number of studies specifically examining the effect of different diet compositions or nutrient interactions on hepatic fat accumulation is small. These studies have examined glycemic index (GI), dietary fiber, fish oil, and amino acid supplementation.
The effect of two different 4‐week isoenergetic diets on hepatic fat accumulation was examined in 35 older aged non‐diabetic but overweight adults with normal liver enzymes.48 They were randomized to either a low‐fat (25% TE), low‐saturated fat (7% TE), and low‐GI (GI < 55) isoenergetic diet (n = 20, men n = 7, mean BMI: 28.1) or a high‐fat (45% TE), high‐saturated fat (25% TE), and high‐GI (GI > 70) isoenergetic diet (n = 15, men n = 6, mean BMI: 28.1). Body weight did not change between baseline and 4 weeks in either group, but liver fat as measured by H‐MRS decreased significantly in the group that consumed the low‐fat/saturated fat/GI diet (P = 0.002 unadjusted; P < 0.05 adjusted for age and sex), and there was no change in the group that consumed the high‐fat/saturated fat/GI diet. Another study also examined the effect of two different isoenergetic diets (high monounsaturated FA [MUFA] and moderately high carbohydrate/high fiber/low GI) with or without exercise on hepatic fat. Participants were overweight or obese and had type 2 diabetes with satisfactory glycemic control.49 In this factorial 2 × 2 randomized parallel group study, the percentage reduction in liver fat (as measured by H‐MRS) was significantly greater in the group that consumed an isoenergetic high‐MUFA (28% TE) diet with (−25%) or without exercise (−29%) compared with the group who consumed an isoenergetic higher fiber (28 vs 10 g/100 kcal), higher carbohydrate (52% vs 40% TE), lower GI (60% vs 95%) diet with (−4%) or without exercise (−6%) (P = 0.006). Body weight and waist circumference did not change in any of the groups in this study.
Two further studies suggest that dietary supplementation may moderate the effect of high‐fructose diets. In a small study, fasting plasma triglyceride levels increased when seven healthy men with a normal BMI consumed fructose (3 g per kg of body weight per day as a 20% fructose solution with the three main meals) in addition to an isoenergetic diet (15% protein, 35% fat, and 50% carbohydrates) for 6 days. The increase in plasma triglycerides was significantly less if fish oil was also consumed.50 The mean triglyceride level was 37% lower when the high‐fructose diet was supplemented with fish oil (P < 0.05), but levels were both significantly higher compared with the control diet and fish oil supplemented only diet (P < 0.05). A similar pattern was observed for DNL, except the difference between the high‐fructose diet and high‐fructose plus fish oil diet was not statistically significant. Other metabolic derangements induced by the high‐fructose diet were not however diminished by the fish oil supplementation.
Amino acids may also moderate the effects of high fructose overfeeding (3 g fructose per kg per day drunk at five different times during the day). In a ‘proof‐of‐concept’ 6‐day crossover trial of fructose overconsumption with or without 20 g essential amino acid supplementation daily in nine healthy men, IHCL (intrahepatocellular lipid concentrations) increased in both groups.51 However, when compared with the control diet, the increase in liver fat during the high‐fructose amino acid‐supplemented diet was 16.1% lower than with the high‐fructose no supplementation diet (control diet, 1.27 ± 0.31; high‐fructose diet, 2.74 ± 0.55; high‐fructose and amino acid diet, 2.30 ± 0.43 vol %; P < 0.05). Unlike the fish oil supplementation study,50 essential amino acid supplementation did not significantly influence the increase in plasma triglycerides.
Discussion
Diet is an important factor in the pathogenesis of NAFLD. The limited number of human studies investigating which dietary components initiate excess hepatic triglyceride deposition suggest that more than one dietary factor may be involved. Excess energy intake can increase hepatic fat accumulation, and the effect is relatively rapid occurring within days to weeks. Whether the additional energy is from fat or carbohydrates does not appear to matter, as both high‐fat and high‐carbohydrate hypercaloric diets can increase intrahepatocellular lipids.30, 32, 33, 35 While the type of fat appears to be influential, with diets high in SFAs (up to 20% TE) increasing hepatic fat compared with diets high in PUFAs (up to 12.9% TE)40, 41 or MUFAs,49 evidence relating to the potentially different effects of different carbohydrates is limited, because very few studies have examined this specific issue.
The experimental studies examining the effect of excess energy on liver fat tested diets with disproportionately high levels of excess calories and extreme proportions of macronutrients. These experimental diets are not typical of usual daily diets consumed by most individuals, and patients with NAFLD generally consume diets of moderate macronutrient content,25, 26, 27 Furthermore, the experimental diets were of a short duration, with some lasting only 3–4 days.30, 31 Consumption of such extreme diets for longer durations would have been unethical as weight gain and metabolic derangements were commonly observed, even after 3 days. It is likely that NAFLD probably develops over time and without extreme dietary intakes.
Experimental hypercaloric or isocaloric diets with a higher than recommended proportion of total fat (55–56% TE) or a high proportion of saturated fat (16% TE) both increased hepatic fat deposition.38, 39, 40 This is biologically plausible as a high intake of total dietary fat directly increases circulatory FFAs, which leads to increased hepatic fat uptake and DNL. Furthermore, mechanistic studies in mice have observed that high‐fat diets also upregulate adipogenic genes involved in DNL and FFA uptake, further increasing DNL and the development of hepatic steatosis.52
In contrast, increasing evidence suggests that PUFAs, specifically omega‐3 FAs, have beneficial metabolic effects and positively influence cardiovascular and NAFLD risk factors including hypertriglyceridemia.53, 54 Observational dietary studies among those with NAFLD and non‐alcoholic steatohepatitis suggest that the consumption of dietary omega‐3 FAs is often lower than recommended,23, 55 and when a diet with sufficient PUFAs (14% TE) is consumed as part of a balanced isocaloric diet, this appears to be protective against the development of NAFLD.41 Further animal studies have shown that proportionally higher intakes of PUFA, particularly omega‐3 FAs, decrease hepatic steatosis by promoting lipid oxidation and suppressing lipid synthesis and uptake of FAs.56 Long‐chain FAs, such as omega‐3, influence the transcription of regulatory genes by interacting with some ligand‐activated nuclear receptor proteins, including peroxisome proliferator‐activated receptors (PPARs).56, 57 Oxidized omega‐3 FAs have a high affinity for peroxisome proliferator‐activated receptors, which modulate the metabolism and storage of dietary lipids by sensing FAs and regulating genes involved in β‐oxidation, FA transport, and hepatic glucose transport.57 PUFAs also inhibit sterol regulatory element‐binding protein‐1, and thus the expression of genes involved in hepatic DNL is reduced.58, 59
Excess hepatic fat deposition following high‐carbohydrate diets appears to be a function of energy, although fructose metabolism differs from that of glucose.42 Glucose is primarily metabolized in extrahepatic tissues, whereas fructose is primarily metabolized in the liver, bypassing glycolytic pathway rate limiting steps and providing unregulated substrate for DNL.60 Although fructose is thought to have a more detrimental effect on the liver than glucose because of the different metabolic pathways, this has not been demonstrated experimentally. In the few small published studies comparing the hepatic effects of high fructose‐ and high glucose‐containing diets in both overfeeding and isocaloric diets, no demonstrable differences on hepatic fat accumulation and liver enzymes were observed.43, 45 Stanhope et al.46 reported that hepatic DNL, markers of altered metabolism, visceral adiposity, and IR all increased when a high fructose‐containing diet (25% TE) was consumed compared with a similarly high glucose‐containing diet (25% TE), but the amounts of fructose and glucose were especially excessive. In contrast, when individuals consume fructose in amounts typical of many Western dietary patterns (defined as consuming up to the 95th percentile of the highest population intake), there does not appear to be any biologically relevant changes in triglycerides or body weight. This has been observed in healthy normal weight individuals, and overweight or obese individuals.61, 62, 63
In conclusion, NAFLD has emerged within the context of the current obesogenic environment. The limited evidence suggests that excess energy intake induces excess hepatic fat accumulation, and that the source of excess energy may affect this pathogenic process. However, studies have used experimental diets with high calorie excesses and large proportions of fat or carbohydrates (most often in the form of simple sugars), which are not typical of current dietary intakes and dietary patterns. This is an important confounding factor, and thus, to date, it is not possible to disentangle the effect of excess energy from the different macronutrients (fat and carbohydrates). The development of NAFLD is likely to be a result of the complex interaction of energy and nutrients. Further investigation is needed to determine the effects of diets more representative of current dietary patterns and the type of diet that leads to the development of NAFLD. A better understanding of the contribution of diet to the pathogenesis of NAFLD would better inform prevention strategies.
Acknowledgment
This review was financially supported by a Department of Medicine, University of Otago PhD scholarship.
Declaration of conflict of interest: None.
References
- 1. Chalasani N, Younossi Z, Lavine JE et al The diagnosis and management of non‐alcoholic fatty liver disease: practice Guideline by the American Association for the Study of Liver Diseases, American College of Gastroenterology, and the American Gastroenterological Association. Hepatology. 2012; 55: 2005–23. [DOI] [PubMed] [Google Scholar]
- 2. Lazo M, Hernaez R, Eberhardt MS et al Prevalence of nonalcoholic fatty liver disease in the United States: the Third National Health and Nutrition Examination Survey, 1988‐1994. Am. J. Epidemiol. 2013; 178: 38–45. [DOI] [PMC free article] [PubMed] [Google Scholar]
- 3. Bellentani S, Scaglioni F, Marino M, Bedogni G. Epidemiology of non‐alcoholic fatty liver disease. Dig. Dis. 2010; 28: 155–61. [DOI] [PubMed] [Google Scholar]
- 4. Maheshwari A, Thuluvath PJ. Cryptogenic cirrhosis and NAFLD: are they related? Am. J. Gastroenterol. 2006; 101: 664–8. [DOI] [PubMed] [Google Scholar]
- 5. Byrne CD, Targher G. NAFLD: a multisystem disease. J. Hepatol. 2015; 62 (1 Suppl.): S47–64. [DOI] [PubMed] [Google Scholar]
- 6. Wong RJ, Aguilar M, Cheung R et al Nonalcoholic steatohepatitis is the second leading etiology of liver disease among adults awaiting liver transplantation in the United States. Gastroenterology. 2015; 148: 547–55. [DOI] [PubMed] [Google Scholar]
- 7. McCall J, Johnston M, Harrison B et al Live donor liver transplantation in New Zealand: a report on the first 20 cases. N. Z. Med. J. 2009; 122: 24–31. [PubMed] [Google Scholar]
- 8. Mantovani A, Mingolla L, Rigolon R et al Nonalcoholic fatty liver disease is independently associated with an increased incidence of cardiovascular disease in adult patients with type 1 diabetes. Int. J. Cardiol. 2016; 225: 387–91. [DOI] [PubMed] [Google Scholar]
- 9. Mahfood Haddad T, Hamdeh S, Kanmanthareddy A, Alla VM. Nonalcoholic fatty liver disease and the risk of clinical cardiovascular events: a systematic review and meta‐analysis. Diabetes Metab. Syndr. 2017; 11 (Suppl. 1): S209–16. [DOI] [PubMed] [Google Scholar]
- 10. Fraser A, Harris R, Sattar N, Ebrahim S, Davey Smith G, Lawlor DA. Alanine aminotransferase, gamma‐glutamyltransferase, and incident diabetes: the British Women's Heart and Health Study and meta‐analysis. Diabetes Care. 2009; 32: 741–50. [DOI] [PMC free article] [PubMed] [Google Scholar]
- 11. Hamabe A, Uto H, Imamura Y et al Impact of cigarette smoking on onset of nonalcoholic fatty liver disease over a 10‐year period. J. Gastroenterol. 2011; 46: 769–78. [DOI] [PubMed] [Google Scholar]
- 12. Sung KC, Kim BS, Cho YK et al Predicting incident fatty liver using simple cardio‐metabolic risk factors at baseline. BMC Gastroenterol. 2012; 12: 84. [DOI] [PMC free article] [PubMed] [Google Scholar]
- 13. Xu C, Yu C, Ma H, Xu L, Miao M, Li Y. Prevalence and risk factors for the development of nonalcoholic fatty liver disease in a nonobese Chinese population: the Zhejiang Zhenhai Study. Am. J. Gastroenterol. 2013; 108: 1299–304. [DOI] [PubMed] [Google Scholar]
- 14. Bugianesi E, McCullough AJ, Marchesini G. Insulin resistance: a metabolic pathway to chronic liver disease. Hepatology. 2005; 42: 987–1000. [DOI] [PubMed] [Google Scholar]
- 15. Choi SH, Ginsberg HN. Increased very low density lipoprotein (VLDL) secretion, hepatic steatosis, and insulin resistance. Trends Endocrinol. Metab. 2011; 22: 353–63. [DOI] [PMC free article] [PubMed] [Google Scholar]
- 16. Liu Q, Bengmark S, Qu S. The role of hepatic fat accumulation in pathogenesis of non‐alcoholic fatty liver disease (NAFLD). Lipids Health Dis. 2010; 9: 42. [DOI] [PMC free article] [PubMed] [Google Scholar]
- 17. Bugianesi E, Zannoni C, Vanni E, Marzocchi R, Marchesini G. Non‐alcoholic fatty liver and insulin resistance: a cause‐effect relationship? Dig. Liver Dis. 2004; 36: 165–73. [DOI] [PubMed] [Google Scholar]
- 18. Sanyal AJ. Mechanisms of disease: pathogenesis of nonalcoholic fatty liver disease. Nat. Clin. Pract. Gastroenterol. Hepatol. 2005; 2: 46–53. [DOI] [PubMed] [Google Scholar]
- 19. Postic C, Girard J. The role of the lipogenic pathway in the development of hepatic steatosis. Diabetes Metab. 2008; 34 (6 Pt 2): 643–8. [DOI] [PubMed] [Google Scholar]
- 20. Dentin R, Girard J, Postic C. Carbohydrate responsive element binding protein (ChREBP) and sterol regulatory element binding protein‐1c (SREBP‐1c): two key regulators of glucose metabolism and lipid synthesis in liver. Biochimie. 2005; 87: 81–6. [DOI] [PubMed] [Google Scholar]
- 21. Musso G, Gambino R, De Michieli F et al Dietary habits and their relations to insulin resistance and postprandial lipemia in nonalcoholic steatohepatitis. Hepatology. 2003; 37: 909–16. [DOI] [PubMed] [Google Scholar]
- 22. Toshimitsu K, Matsuura B, Ohkubo I et al Dietary habits and nutrient intake in non‐alcoholic steatohepatitis. Nutrition. 2007; 23: 46–52. [DOI] [PubMed] [Google Scholar]
- 23. Cortez‐Pinto H, Jesus L, Barros H, Lopes C, Moura MC, Camilo ME. How different is the dietary pattern in non‐alcoholic steatohepatitis patients? Clin. Nutr. 2006; 25: 816–23. [DOI] [PubMed] [Google Scholar]
- 24. Oddy WH, Herbison CE, Jacoby P et al The Western dietary pattern is prospectively associated with nonalcoholic fatty liver disease in adolescence. Am. J. Gastroenterol. 2013; 108: 778–85. [DOI] [PubMed] [Google Scholar]
- 25. Ferolla SM, Abreu Ferrari TC, Pereira Lima ML et al Dietary patterns in Brazilian patients with non‐alcoholic fatty liver disease: a cross‐sectional study. Clinics. 2013; 68: 11–7. [DOI] [PMC free article] [PubMed] [Google Scholar]
- 26. Zelber‐Sagi S, Nitzan‐Kaluski D, Goldsmith R et al Long term nutritional intake and the risk for non‐alcoholic fatty liver disease (NAFLD): a population based study. J. Hepatol. 2007; 47: 711–7. [DOI] [PubMed] [Google Scholar]
- 27. Allard JP, Aghdassi E, Mohammed S et al Nutritional assessment and hepatic fatty acid composition in non‐alcoholic fatty liver disease (NAFLD): a cross‐sectional study. J. Hepatol. 2008; 48: 300–7. [DOI] [PubMed] [Google Scholar]
- 28. Ouyang X, Cirillo P, Sautin Y et al Fructose consumption as a risk factor for non‐alcoholic fatty liver disease. J. Hepatol. 2008; 48: 993–9. [DOI] [PMC free article] [PubMed] [Google Scholar]
- 29. Johnson RK. Dietary intake—how do we measure what people are really eating? Obes. Res. 2002; 10 (Suppl. 1): 63S–8S. [DOI] [PubMed] [Google Scholar]
- 30. Bortolotti M, Kreis R, Debard C et al High protein intake reduces intrahepatocellular lipid deposition in humans. Am. J. Clin. Nutr. 2009; 90: 1002–10. [DOI] [PubMed] [Google Scholar]
- 31. van der Meer RW, Hammer S, Lamb HJ et al Effects of short‐term high‐fat, high‐energy diet on hepatic and myocardial triglyceride content in healthy men. J. Clin. Endocrinol. Metab. 2008; 93: 2702–8. [DOI] [PubMed] [Google Scholar]
- 32. Lammert O, Grunnet N, Faber P et al Effects of isoenergetic overfeeding of either carbohydrate or fat in young men. Br. J. Nutr. 2000; 84: 233–45. [PubMed] [Google Scholar]
- 33. Heilbronn LK, Coster AC, Campbell LV et al The effect of short‐term overfeeding on serum lipids in healthy humans. Obesity. 2013; 21: 649–59. [DOI] [PubMed] [Google Scholar]
- 34. Kechagias S, Ernersson A, Dahlqvist O et al Fast‐food‐based hyper‐alimentation can induce rapid and profound elevation of serum alanine aminotransferase in healthy subjects. Gut. 2008; 57: 649–54. [DOI] [PMC free article] [PubMed] [Google Scholar]
- 35. Sevastianova K, Santos A, Kotronen A et al Effect of short‐term carbohydrate overfeeding and long‐term weight loss on liver fat in overweight humans. Am. J. Clin. Nutr. 2012; 96: 727–34. [DOI] [PubMed] [Google Scholar]
- 36. Paglialunga S, Dehn CA. Clinical assessment of hepatic de novo lipogenesis in non‐alcoholic fatty liver disease. Lipids Health Dis. 2016; 15: 159. [DOI] [PMC free article] [PubMed] [Google Scholar]
- 37. Koopman KE, Caan MWA, Nederveen AJ et al Hypercaloric diets with increased meal frequency, but not meal size, increase intrahepatic triglycerides: a randomized controlled trial. Hepatology. 2014; 60: 545–53. [DOI] [PMC free article] [PubMed] [Google Scholar]
- 38. Westerbacka J, Lammi K, Hakkinen AM et al Dietary fat content modifies liver fat in overweight nondiabetic subjects. J. Clin. Endocrinol. Metab. 2005; 90: 2804–9. [DOI] [PubMed] [Google Scholar]
- 39. Van Herpen NA, Schrauwen‐Hinderling VB, Schaart G, Mensink RP, Schrauwen P. Three weeks on a high‐fat diet increases intrahepatic lipid accumulation and decreases metabolic flexibility in healthy overweight men. J. Clin. Endocrinol. Metab. 2011; 96: E691–5. [DOI] [PubMed] [Google Scholar]
- 40. Rosqvist F, Iggman D, Kullberg J et al Overfeeding polyunsaturated and saturated fat causes distinct effects on liver and visceral fat accumulation in humans. Diabetes. 2014; 63: 2356–68. [DOI] [PubMed] [Google Scholar]
- 41. Bjermo H, Iggman D, Kullberg J et al Effects of n‐6 PUFAs compared with SFAs on liver fat, lipoproteins, and inflammation in abdominal obesity: a randomized controlled trial. Am. J. Clin. Nutr. 2012; 95: 1003–12. [DOI] [PubMed] [Google Scholar]
- 42. Chiu S, Sievenpiper JL, de Souza RJ et al Effect of fructose on markers of non‐alcoholic fatty liver disease (NAFLD): a systematic review and meta‐analysis of controlled feeding trials. Eur. J. Clin. Nutr. 2014; 68: 416–23. [DOI] [PMC free article] [PubMed] [Google Scholar]
- 43. Lecoultre V, Egli L, Carrel G et al Effects of fructose and glucose overfeeding on hepatic insulin sensitivity and intrahepatic lipids in healthy humans. Obesity. 2013; 21: 782–5. [DOI] [PubMed] [Google Scholar]
- 44. Sobrecases H, Le KA, Bortolotti M et al Effects of short‐term overfeeding with fructose, fat and fructose plus fat on plasma and hepatic lipids in healthy men. Diabetes Metab. 2010; 36: 244–6. [DOI] [PubMed] [Google Scholar]
- 45. Johnston RD, Stephenson MC, Crossland H et al No difference between high‐fructose and high‐glucose diets on liver triacylglycerol or biochemistry in healthy overweight men. Gastroenterology. 2013; 145: 1016–25. [DOI] [PubMed] [Google Scholar]
- 46. Stanhope KL, Schwarz JM, Keim NL et al Consuming fructose‐sweetened, not glucose‐sweetened, beverages increases visceral adiposity and lipids and decreases insulin sensitivity in overweight/obese humans. J. Clin. Invest. 2009; 119: 1322–34. [DOI] [PMC free article] [PubMed] [Google Scholar]
- 47. Maersk M, Belza A, Stødkilde‐Jørgensen H et al Sucrose‐sweetened beverages increase fat storage in the liver, muscle, and visceral fat depot: a 6‐mo randomized intervention study. Am. J. Clin. Nutr. 2012; 95: 283–9. [DOI] [PubMed] [Google Scholar]
- 48. Utzschneider KM, Bayer‐Carter JL, Arbuckle MD, Tidwell JM, Richards TL, Craft S. Beneficial effect of a weight‐stable, low‐fat/low‐saturated fat/low‐glycaemic index diet to reduce liver fat in older subjects. Br. J. Nutr. 2013; 109: 1096–104. [DOI] [PMC free article] [PubMed] [Google Scholar]
- 49. Bozzetto L, Prinster A, Annuzzi G et al Liver fat is reduced by an isoenergetic MUFA diet in a controlled randomized study in type 2 diabetic patients. Diabetes Care. 2012; 35: 1429–35. [DOI] [PMC free article] [PubMed] [Google Scholar]
- 50. Faeh D, Minehira K, Schwarz JM, Periasamy R, Park S, Tappy L. Effect of fructose overfeeding and fish oil administration on hepatic de novo lipogenesis and insulin sensitivity in healthy men. Diabetes. 2005; 54: 1907–13. [DOI] [PubMed] [Google Scholar]
- 51. Theytaz F, Noguchi Y, Egli L et al Effects of supplementation with essential amino acids on intrahepatic lipid concentrations during fructose overfeeding in humans. Am. J. Clin. Nutr. 2012; 96: 1008–16. [DOI] [PubMed] [Google Scholar]
- 52. de Meijer VE, Le HD, Meisel JA et al Dietary fat intake promotes the development of hepatic steatosis independently from excess caloric consumption in a murine model. Metabolism. 2010; 59: 1092–105. [DOI] [PMC free article] [PubMed] [Google Scholar]
- 53. Zuliani G, Galvani M, Leitersdorf E, Volpato S, Cavalieri M, Fellin R. The role of polyunsaturated fatty acids (PUFA) in the treatment of dyslipidemias. Curr. Pharm. Des. 2009; 15: 4087–93. [DOI] [PubMed] [Google Scholar]
- 54. Ebrahimi M, Ghayour‐Mobarhan M, Rezaiean S et al Omega‐3 fatty acid supplements improve the cardiovascular risk profile of subjects with metabolic syndrome, including markers of inflammation and auto‐immunity. Acta Cardiol. 2009; 64: 321–7. [DOI] [PubMed] [Google Scholar]
- 55. Ricci G, Canducci E, Pasini V et al Nutrient intake in Italian obese patients: relationships with insulin resistance and markers of non‐alcoholic fatty liver disease. Nutrition. 2011; 27: 672–6. [DOI] [PubMed] [Google Scholar]
- 56. Mouzaki M, Allard JP. The role of nutrients in the development, progression, and treatment of nonalcoholic fatty liver disease. J. Clin. Gastroenterol. 2012; 46: 457–67. [DOI] [PubMed] [Google Scholar]
- 57. Yu S, Reddy JK. Transcription coactivators for peroxisome proliferator‐activated receptors. Biochim. Biophys. Acta. 2007; 1771: 936–51. [DOI] [PubMed] [Google Scholar]
- 58. de Wit NJ, Afman LA, Mensink M, Müller M. Phenotyping the effect of diet on non‐alcoholic fatty liver disease. J. Hepatol. 2012; 57: 1370–3. [DOI] [PubMed] [Google Scholar]
- 59. McCarthy EM, Rinella ME. The role of diet and nutrient composition in nonalcoholic fatty liver disease. J. Acad. Nutr. Diet. 2012; 112: 401–9. [DOI] [PubMed] [Google Scholar]
- 60. Stanhope KL, Havel PJ. Fructose consumption: potential mechanisms for its effects to increase visceral adiposity and induce dyslipidemia and insulin resistance. Curr. Opin. Lipidol. 2008; 19: 16–24. [DOI] [PMC free article] [PubMed] [Google Scholar]
- 61. Rippe JM, Angelopoulos TJ. Sucrose, high‐fructose corn syrup, and fructose, their metabolism and potential health effects: what do we really know? Adv. Nutr. 2013; 4: 236–45. [DOI] [PMC free article] [PubMed] [Google Scholar]
- 62. Dolan LC, Potter SM, Burdock GA. Evidence‐based review on the effect of normal dietary consumption of fructose on development of hyperlipidemia and obesity in healthy, normal weight individuals. Crit. Rev. Food Sci. Nutr. 2010; 50: 53–84. [DOI] [PubMed] [Google Scholar]
- 63. Dolan LC, Potter SM, Burdock GA. Evidence‐based review on the effect of normal dietary consumption of fructose on blood lipids and body weight of overweight and obese individuals. Crit. Rev. Food Sci. Nutr. 2010; 50: 889–91. [DOI] [PubMed] [Google Scholar]