Abstract
In this manuscript, we employ the technique intermittent pulse amperometry (IPA) to interrogate equilibrium and kinetic target binding to the surface of electrochemical, aptamer-based (E-AB) sensors, achieving as fast as 2 ms time resolution. EAB sensors comprise an electrode surface modified with a flexible nucleic acid aptamer tethered at the 3’-terminus with a redox-active molecule. The introduction of a target changes the conformation and flexibility of the nucleic acid which alters the charge transfer rate of the appended redox molecule. Typically, changes in charge transfer rate within this class of sensor are monitored via voltammetric methods. Here, we demonstrate that the use of IPA enables the detection of changes in charge transfer rates (i.e. current) at times <100 μs after the application of a potential pulse. Changes in sensor current are quantitatively related to target analyte concentration and can be used to create binding isotherms. Furthermore, the application of IPA enables rapid probing of the electro-chemical surface with a time resolution equivalent to as low as twice the applied potential pulse width, not previously demonstrated with traditional voltammetric techniques employed with E-AB sensors (alternating current, square wave, cyclic). To visualize binding, we developed false-color plots analogous to those used in the field of fast-scan cyclic voltammetry. The use of IPA is universal as demonstrated with two representative small molecule E-AB sensors directed against the aminoglycoside antibiotic tobramycin and adenosine triphosphate (ATP). Intermittent pulse amperometry exhibits an unprecedented sub-ms temporal response and is a general method for measuring rapid sensor performance.
Keywords: aptamers, sensors, binding kinetics, electrochemistry, intermittent pulse amperometry
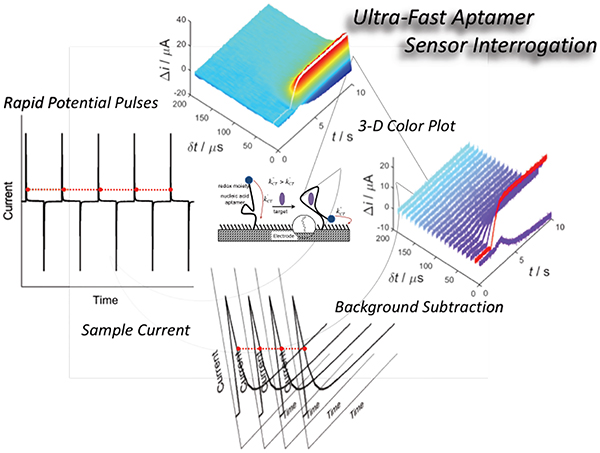
Graphical Abstract
There is a high demand for analytical tools able to quantitate molecules of interest with high specificity, sensitivity, and temporal resolution. Electrochemical, aptamer-based (E-AB) sensors offer an avenue for this type of analytical detection of an extended range of targets, from small molecules to proteins.1 EAB sensors employ target-induced conformational changes of a redox-active species-labeled aptamer sequence (modified at the distal end of the oligonucleotide sequence) to report on the presence of a specific molecular analyte in a quantitative manner (Scheme 1).2 This type of sensor demonstrates specific detection in relatively complex media with nanomolar (nM) to micromolar (μM) binding affinities.3
Scheme 1.
Electrochemical, aptamer-based sensors employ target-induced conformational changes of a redox active-labeled aptamer sequence to quantitatively report on the presence of a specific molecular analyte. Changes in charge transfer rates (ket) between the redox moiety with (k’et) and without (ket) target lead to changes in measured current.
Traditionally, E-AB sensor signal transduction relies on the use of voltammetric methods. These methods include square wave voltammetry (SWV), alternating current voltammetry (ACV),4 or cyclic voltammetry (CV),3,5 all of which offer sensitive detection of target analytes. Differential techniques like SWV offer additional advantages such as control over signaling polarity and sensitivity of the aptamer-based sensor by selecting optimal interrogation frequencies.6 In short, this class of sensor can operate in two modes. First, when interrogated at the appropriate square wave frequency, the measured voltammetric peak current increases in the presence of target. This type of response is termed “signal on.” Alternatively, a decrease in voltammetric peak current upon the addition of target is termed “signal-off” behavior.
Although the aforementioned voltammetric techniques offer distinct advantages, the time resolution of these techniques is typically limited to, at best, a few seconds (limited by the time scale of the voltammetric sweep). In all cases, a linear potential sweep is applied to the electrode surface (as is the case for CV) or is superimposed with a square wave or sinusoidal waveform in SWV or ACV respectively. Consequently, the experimental time scale, and thus time resolution of the sensor measurement, is limited by the sweep rate. For example, a SWV scan between 0.0 and −0.5 V usually takes ~2–3 s for frequencies of ~200 Hz. The same potential window can be scanned in 10 seconds using CV with a scan rate of 100 mV s−1. While the time resolution can be dramatically improved using fast-scan cyclic voltammetry (FSCV),7 to the best of the authors’ knowledge this technique has not been applied to interrogate E-AB sensors.
Chronoamperometry offers enhanced temporal resolution compared to voltammetric techniques because it only relies on the application of a static potential pulse.8 As such, chronoamperometry has long been a powerful technique in electroanalytical chemistry in measuring fast processes. For example, chronoamperometry allows temporally-resolved measurements of biological processes such as vesicular exocytosis (e.g., catecholamine release) using carbon fiber microelectrodes.9,10
With only one notable example discussed below, chronoamperometry has seem limited application in interrogation of EAB sensors. The limited application is because of the nature or the E-AB sensors surface. More specifically, E-AB sensors have a finite number of redox molecules on the electrode surface. In chronoamperometry, when a potential pulse is applied to a surface with a limited supply of bound redox molecules, current decays to zero after all molecules are reduced/oxidized.11 This contrasts to an experiment where the redox molecules are in solution. In this case, the redox molecules are continuously replenished at the surface from surrounding solution leading to a steady-state current related to bulk redox molecule concentration. The current can thus change as bulk concentration changes. With a finite number or redox molecules, once the current reaches zero, the measurement is complete. One way around this limitation was reported by Arroyo-Currás et al. In their report, Arroyo-Currás et al, use the current decay rate after the application of a potential pulse as opposed to absolute current. Specifically, the authors demonstrate that exponential fits of the current decay profile are quantitatively related to the concentration of target analyte. Using this methodology, Plaxco and coworkers achieve sub-second time resolution (300 ms) and quantitative measure of target analyte.12
In this manuscript, we report the use of intermittent pulse amperometry (IPA) to achieve rapid (<ms) E-AB sensor interrogation. IPA uses repetitive alternating potential pulses to reduce and oxidize a reversible redox-active species. In our system, a methylene blue (MB)-labeled aptamer, we alternate between a sufficient negative overpotential to reduce MB (−0.4 V vs. Ag/AgCl; defined as a forward pulse) and 0.0 V, or potential at which the methylene blue is reoxidized (defined as a reverse pulse), thus restoring the sensor surface. We demonstrate that absolute current values at a defined time after the application of a potential pulse (δt) are quantitatively related to the concentration of target analyte in solution. Using this method, we demonstrate that equilibrium binding isotherms can be obtained at times as low as 50 – 200 μs after a potential pulse. Furthermore, we show that IPA allows kinetic measurements of E-AB sensor response in sub 100 ms time scales. To visualize kinetic binding data, we generate 3-dimensional (3D), false-color plots that are analogous to those used in FSCV developed by Wightman and coworkers to visualize exocytosis events.13 Using the square wave potential pulse waveform, time resolution is ultimately limited by the potential pulse width or the binding kinetics of the aptamer-target interaction. We believe that the application of IPA to E-AB sensors marks a new method of rapid quantification of the E-AB sensor binding to new, yet unrealized time regimes.
EXPERIMENTAL SECTION
Chemicals and Solutions
Tris-2-carboxyethyl-phosphine (TCEP), 6-mercapto-1-hexanol (99%), Trizma (tris) base (2-amino-2-(hydroxymethyl)-1,3-propanediol, magnesium chloride (MgCl2), gold (III) chloride (HAuCl4) trihydrate, potassium bromide (KBr), sulfuric acid (H2SO4), hydrogen peroxide (H2O2), hydrochloric acid (HCl) sodium chloride (NaCl), tobramycin, adenosine triphosphate (ATP), and 10× Tris-EDTA were used as received from Sigma Aldrich. All solutions were prepared using autoclaved, ultrapure water (18.0 MΩ cm at 25 °C) using a Biopak Polisher Millipore ultra-purification system (Millipore, Billerica, MA). The DNA tobramycin aptamer sequence (5’-GGGACTTGGTTTAGGTAATGAGTCCC-MB-3’)14 and DNA destabilized ATP aptamer (5’-CTGGGGGAGTATTGCGGAGGAAA-3’)15 oligonucleotide sequences were purified using dual HPLC (Biosearch Technologies, CA) and used as received.
Electrochemical Aptamer-Based (E-AB) Sensor Fabrication for Equilibrium Measurements
Before sensor fabrication, each macro (2 mm diameter poly-crystalline gold) electrode (CH Instruments, Austin, TX) was hand polished on a microcloth in a 1 μm diamond suspension, followed by polishing in 0.05 μm aluminum oxide slurry (microcloth, diamond suspension and alumina from Buehler). All electrodes were rinsed and electrochemically cleansed using sodium hydroxide and sulfuric acid as previously described.16 After cleaning, electrodes were incubated in a 200 nM parent tobramycin or 200 nM destabilized ATP aptamer solution in autoclaved 20 mM tris buffer (pH ~ 7.4) with 100 mM NaCl and 5 mM MgCl2 for 1 h. Prior to incubation, all oligonucleotide sequences were reacted with 2 μL 100 mM TCEP for 1 hour to reduce the 5’-disulfide bond. Following aptamer self-assembled monolayer formation, electrodes were passivated in a 30 mM 6-mercapto-1-hexanol solution for 1 h. Sensors were equilibrated in autoclaved 20 mM tris buffer (pH = 7.4) with 100 mM NaCl and 5 mM MgCl2 for 1 h prior to use.
Electrochemical Aptamer-Based (E-AB) Sensor Fabrication for Kinetic Measurements
E-AB sensors to perform kinetic measurements were prepared on a thin film electrode (ED-SE1-AuPt) containing one-1 mm diameter gold working electrode, one platinum counter electrode, and one platinum quasi-reference electrode purchased from MicruX Fluidic (Oviedo, Spain). All electrodes were hand polished in an alumina slurry for 2 minutes using a disposable cotton swab, followed by electrochemical reductive desorption using sodium hydroxide as previously described.16 Gold nanoparticles were electrodeposited following a previously described method by Ivanova and Zamborini,17 to in crease the surface area of the working electrode and therefore improve electrochemical signaling.18 Briefly, bulk electrolysis was performed for 10 seconds at −0.15 V in a solution containing 20 mM HAuCl4, 0.1 M KBr and 0.5 M HCl. E-AB sensors on nanostructured thin film electrodes were fabricated in the same way as 2 mm diameter polycrystalline gold electrodes.
Electrochemical Measurements
Electrochemical measurements were performed using a CH Instruments 620D Electrochemical Workstation (CH Instruments, Austin, TX) in a three-electrode cell system using Ag/AgCl (3 M NaCl) and a platinum wire as a reference and counter electrode, respectively. Square wave voltammograms were obtained using a pulse amplitude of 25 mV with a constant frequency (100 Hz) and a step width of 1 mV. IPA measurements were done by applying a −0.4 V potential with a 1 sec pulse width with a sample interval equivalent to 70 μs.
Kinetics measurements were obtained by applying alternating potential steps between 0.0 and −0.4 V (vs. Ag/AgCl) with a 1 ms pulse width (1000 Hz) and 10 μs sample interval, using a CH instruments 660D Electrochemical Workstation controlled via in-house written LabVIEW code (LabVIEW 2014). Electrochemical measurements were performed on the thin film electrode assembly housed on a commercial aluminum base (AIO Drop Cell-Base) with a poly(methylmethacrylate) (PMMA) cover (AIO Cell Add-On Batch Cell PMMA-2.0), both from MicruX Technologies (Oviedo, Spain). The target was added by manual injection of 0.8 μL into the solution to reach the desired concentration.
RESULTS AND DISCUSSION
Intermittent Pulse Amperometry (IPA) and E-AB Sensors
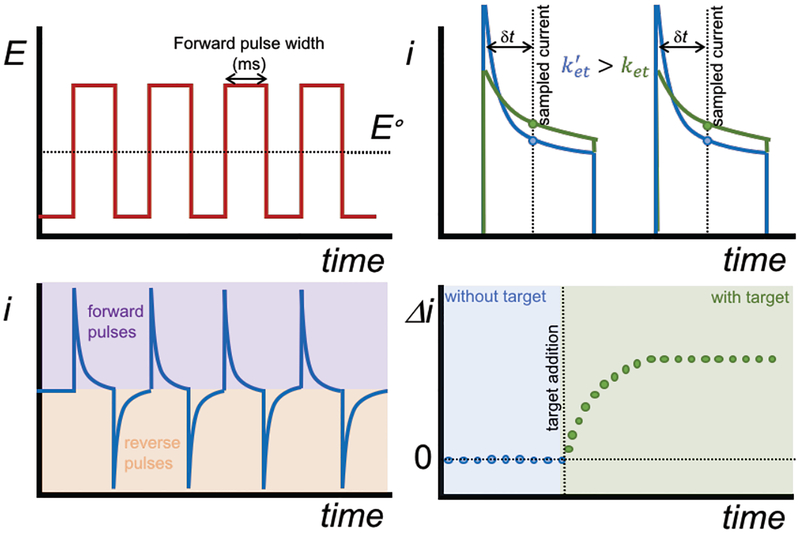
IPA is an electroanalytical technique that involves a series of repetitive potential pulses between a potential at which no fara daic electrochemistry occurs to a sufficient overpotential to oxidize/reduce a redox couple at a diffusion-limited rate (Figure 1). For E-AB sensors modified with MB, the potential is pulsed at a sufficient overpotential (−0.4 V vs. Ag/AgCl) to reduce MB to leucomethylene blue, followed by time intervals where the working electrode is held at 0.0 V to oxidize leucomethylene blue, thus resetting the sensor baseline. The continuous, current-time profile shows a series of sharp pulses in the forward and reverse direction (schematically shown in Figure 1 and representative data in supporting information (SI) Figure S1).
Figure 1.
Intermittent pulse amperometry (IPA) involves (top left) the application of repetitive potential pulses to the working electrode, alternating between a potential sufficient to reduce/oxide a redox-active molecule and a potential to reversibly oxidize/reduce the molecule (i.e. either side of the standard electrode potential E°). (Bottom left) The resulting continuous amperometric time trace is represented as a series of forward and reverse current pulses. In sampling E-AB sensors, we sample current at a given time after the pulse (dt). (Top right) If the rates of charge transfer (ket) differ (e.g., free aptamer without or with the target), the current sampled (Di) will be different, thus provides the basis for signal transduction of a target binding. (Bottom right) A plot of sampled-current vs. time yields a “sampled” current-time, or amperometric trace.
To better understand the IPA current-time response at the surface of E-AB sensors, we approximate the surface of E-AB sensors as a redox polymer film in which there is a finite number of discrete localized redox sites (methylene blue). The thickness of the film (d) at a maximum is defined by the fully extended length of the nucleic acid tether (~15 nm).19,20 When the motion of the redox sites are appreciable, the amperometric response of redox polymer films behaves similarly to a thin layer electro-chemical cell.21 The current response depends on the relationship of the diffusion layer thickness (d = Dte) and the thickness of the film (d). This relationship can be described by comparing the diffusion coefficient of the redox probe (D), the experimental time scale (te), and the film thickness through the relationship Dte/d2. When Dt/d2 e >> 1, or the film thickness is much smaller than the diffuse layer, the current response to a potential perturbation will follow thin layer behavior – essentially the redox molecule is reduced/oxidized rapidly, and current will decay exponentially. However, if Dte/d2 << 1, then the current behavior will exhibit semi-infinite diffusion behavior.
When a thin layer cell or redox polymer exhibits a current response in the semi-infinite diffusion regime (Dte/d2 << 1), the current-time decay will follow that of a freely diffusing species described in equation 1 (the Cottrell equation):
| (eq. 1) |
where A is the electrode area and C (mol/cm3) is the concentration of redox species (G/d – where G is the surface concentration in mol/cm2). Finally, n is the number of electrons transferred per equivalent, and F is Faraday’s constant.
When considering a potential pulse applied to thin a layer cell, another term must be added to account for a longer time regime in which a finite diffusion boundary is observed, and the concentration of active redox molecule depletes to zero. Equation 2 describes the current-time response to a sufficient over-potential pulse:21
| (eq. 2) |
At longer time scales, the current decay rate deviates from the t−1/2 behavior described by the Cottrell expression, described by the latter portion of the expression to account for the depletion of the redox centers.
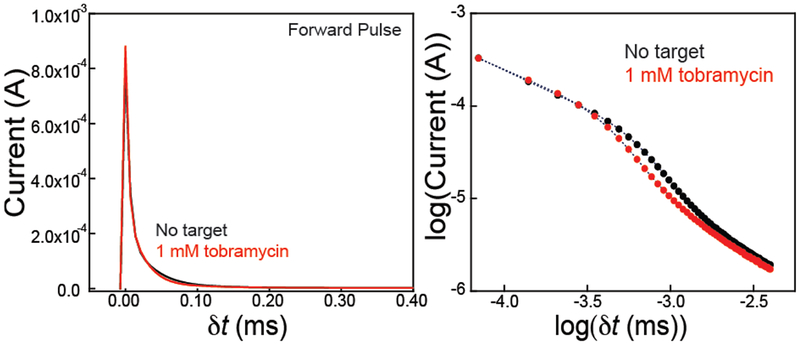
Finally, at short time scales, or when the film thickness is thin, and Dte/d2 >> 1, the current response is likely a convoluted mixture of double layer capacitive charging and faradaic pseudocapacitance.22–24 In our case, the application of a potential pulse to the surface of E-AB sensors results in a current-time response exhibiting a double exponential decay (Figure 2). Since the thickness of the layer is thin (~15 nm, assuming 6.3 Å per nucleotide length), we do not observe a region of Cottrell-like behavior, rather the current response is dictated by the latter term of equation 2. Additionally, after ~ 0.30 ms, the current decays to zero as is expected for a surface-confined reaction. Interestingly, and what serves as the basis for this manuscript, we observe quantitative changes in both portions of the current-time trace upon target (here tobramycin) addition (Figure 2), which we explore in more detail below.
Figure 2.
Comparison of the amperometric current-time trace with and without target (tobramycin) reveals a difference in absolute current measured. (Left) The current-time response using a representative forward pulse of a tobramycin E-AB sensor with and without 1 mM tobramycin present exhibits notable changes in current. These data represent the current-time response with the application of a potential pulse from 0.0 V to −0.4 V (vs. Ag/AgCl) at dt = 0. (Right) Current plotted on a log-log scale better illustrates the difference in current with and without target analyte. The current-time response in both cases appears to follow a double exponential decay.
IPA Enables Rapid and Quantitative Measure of E-AB Sensor Performance
To demonstrate the applicability of IPA for a quantitative measure of target analyte concentration, we fabricated sensors using two representative small molecule aptamers: an amino-glycoside (tobramycin) binding aptamer and adenosine triphosphate (ATP) binding aptamer, reported by Rowe et al.14 and White et al.,15 respectively. Traditionally, the aminoglycoside-based sensor functions as a signal-on sensor when interrogated with SWV at high frequencies (> 400 Hz, SI Figure S2).
Sensors fabricated to detect aminoglycoside antibiotics (e.g. tobramycin) exhibit an apparent binding affinity (KD) ~ 5.0 ± 0.6 μM and maximum signal change of ~40% when interrogated voltammetrically (SI Figure S2). Similarly, sensors fabricated with the aptamer specific to ATP detection yield a KD of 0.4 ± 0.2 mM and signal changes of ~120% when at saturation, when interrogated at high SWV frequencies (≥ 400 Hz) (SI Figure S2).
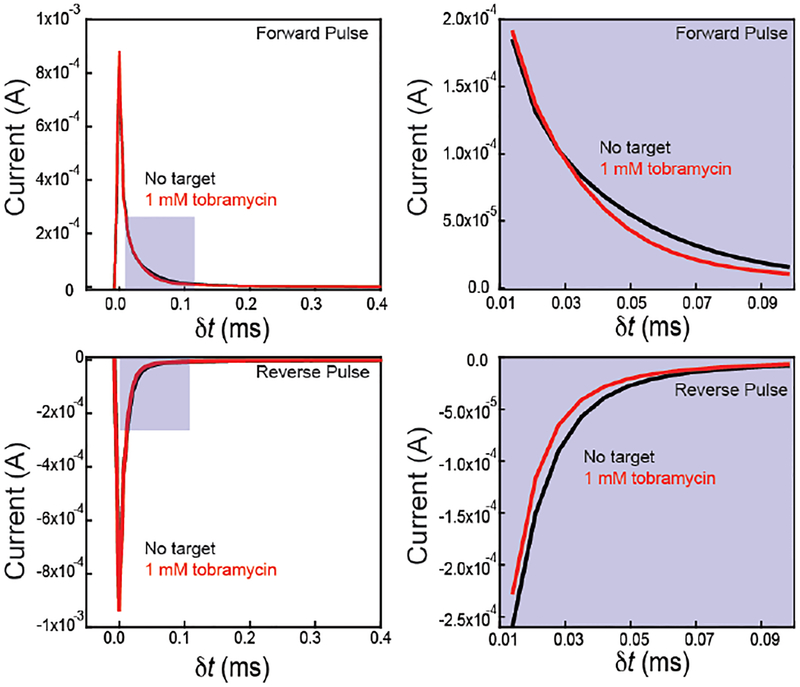
Monitoring current after the application of a potential pulse provides quantitative information about tobramycin concentrations (Figures 3 and 4). To perform IPA, we monitor current after a forward or reverse pulse with 7 μs resolution (Figure 3). Qualitatively, we observe a difference in the instantaneous current and the rate of current decay when comparing a current time trace with 1 mM tobramycin and without target (Figure 3) after the application of a forward pulse. Similarly, we observe differences in the current-time trace after the application of a reverse pulse (Figure 3).
Figure 3.
Differences in current are observed at both the forward and reverse potential pulse. Current response after both a (top) forward and (bottom) reverse pulse show a different response to the presence and absence of target analyte. E-AB sensors for the detection of tobramycin show marked differences in absolute current and decay rates for both (top) forward (−0.4V vs. Ag/AgCl) and (bottom) reverse (0.0 V vs. Ag/AgCl) pulses. Plots on the right show the zoomed-in regions of interest from the pulses on the left, where this difference in current is most apparent.
Figure 4.
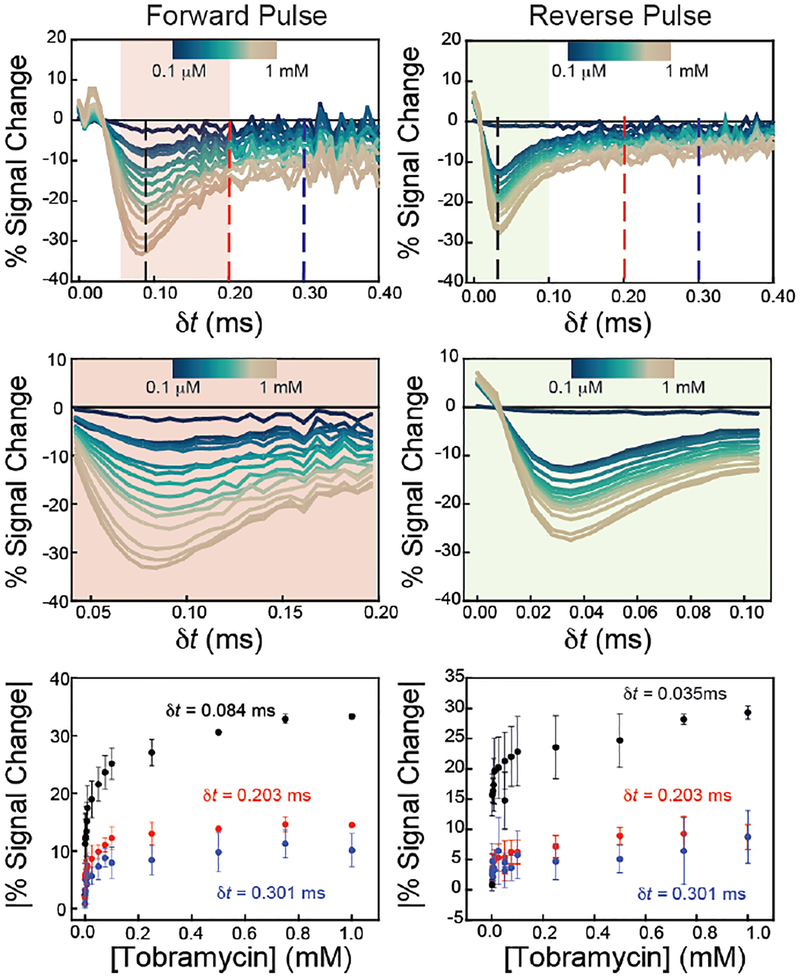
Amperometric current response is quantitatively related to the concentration of tobramycin present, and the magnitude and polarity of that response is a function of when the current is measured after the application of a pulse (dt) for both forward (left) and reverse (right) pulses. (Top) Evaluation of current after a potential pulse shows a significant signal change in times as fast as 50 μs upon target addition, with the most significant changes occurring at 84 μs after the potential pulse. (Middle) Zoom-ins of the shaded regions show the sampling times that give greatest percent signal change. (Bottom) Plotting percent signal change at different dt values creates quantitative binding curves that can be fitted to Langmuir-like isotherms for quantitation of target concentrations. The current was sampled at three dt values, marked as dashed lines in the top plots.
With careful evaluation, we find that the magnitude and polarity of the change in current with and without a target is a function of when current is sampled after the application of a potential pulse, or dt (Figure 4). To quantify E-AB sensor response, we use the traditionally used “percent signal change” defined as: (iTarget-iNo target / iNo target) × 100, where iTarget and iNo target represent the current response of the sensor with and without target in solution, respectively. The polarity of percent signal change is a function of dt and changes from positive (signal-on) to negative (signal-off). At dt values < ~0.05 ms, the signal change is positive in the presence of target whereas, at longer sampling times, >0.05 ms, the signal change is negative. We also observe that the magnitude of the signal change is quantitatively related to tobramycin concentration (Figure 4). For example, when current is sampled at three different dt values (0.084, 0.203, and 0.301 ms), the percent signal changes follows Langmuir-like binding isotherms related to tobramycin concentration. This trend holds for both forward and reverse pulses (Figure 4), albeit with slightly different sensitivities. We find the highest sensitivity for tobramycin at a dt value of 0.084 ms. (Figure 4). The binding curve begins to approach a saturating level with a maximum signal change value of ~30 – 35%, typical to what has been observed previously. Fitting the data to a Langmuir-like binding isotherm,1 we obtained an apparent binding affinity, KD = 5.0 ± 0.6 μM, which is comparable to that achieved using voltammetric methods (SI Figure S2). Sampling at dt values of 0.203 and 0.301 ms yields reproducible maximum signal changes of ~12% and ~8%, respectively (Figure 4).
Current recorded after the application of a reverse pulse also yields quantitative binding isotherms. Similar to the forward pulse, the magnitude of the current difference is a function of tobramycin concentration (Figure 4). We see the highest sensitivity (~30% maximum signal change) at dt = 0.035 ms (Figure 4). Fitting the sensor response at dt values of 0.035, 0.203 and 0.301 ms gives Langmuir-like isotherms with observed KD values of 2.2 ± 0.4 μM, similar to that achieved with voltammetric detection (SI Figure S2).
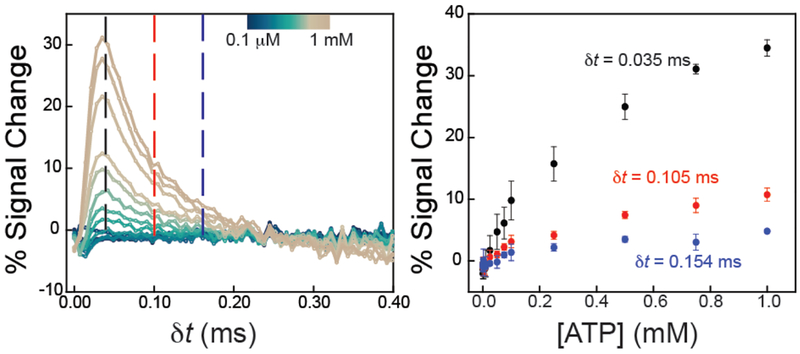
The use of IPA for quantitative determination of target analyte concentration with E-AB sensors is a general strategy. To demonstrate this, we interrogated E-AB sensors specific for ATP detection. We found that the polarity of the current change is always positive, as opposed to the tobramycin sensor (Figure 5). Similar to what we observed with the tobramycin sensor, we find the magnitude of signal change is quantitatively related to ATP concentration. Specifically, we plot the average percent signal change (of three sensors) at three different dt values, 0.035, 0.105 and 0.154 ms (Figure 5). The sensor response yielded the highest sensitivity at a dt value of 0.035 ms with a K D ~ 0.7 ± 0.3 mM, comparable to the value obtained using SWV (SI Figure S2). Similar to results obtained with the tobramycin sensor, we see no signal change after 0.30 ms, when the current approaches zero. Of note, unlike the response of the tobramycin aptamer sensor, we do not observe as robust of signal changes in current for the reverse pulse compared to tobramycin data (SI Figure S3). Nonetheless, IPA appears to be a general electrochemical method for probing E-AB sensor response.
Figure 5.
The use of IPA interrogation is a general means of probing E-ABs. (Left) ATP-specific E-AB sensor interrogated using IPA exhibited sensitive target-induced responses within tens of μs timeframe. Changes in current are dependent on ATP concentration as well as dt with an optimal sensor response at dt values between 10 – 140 μs. (Right) Data obtained at multiple dt values (dashed lines on the left plot) fit Langmuir-like isotherms for quantitative analysis of ATP concentration.
IPA Enables Monitoring of Rapid Binding Kinetics at E-AB Sensor Surfaces
The nature of the repetitive forward and reverse pulses employed in IPA allows rapid and continuous interrogation of the signaling of E-AB sensors, and thus grants the ability to monitor binding kinetics electrochemically with a time resolution not yet demonstrated. With this in mind, we set out to demonstrate the ability to achieve as low as 2 ms time-resolved measurements of E-AB sensor response to explore aptamer (A)-target (T) binding kinetics which have been typically been limited to surface plasmon resonance-based measurements.25 For ap-tamer-target interaction, the rate of aptamer-target complex (AT) formation is given by the bimolecular association constant (kon) and the monomolecular dissociation constant (koff) to obtain KD = koff/kon (equation 3), describing a 1:1 interaction between aptamer and target.
| (eq. 3) |
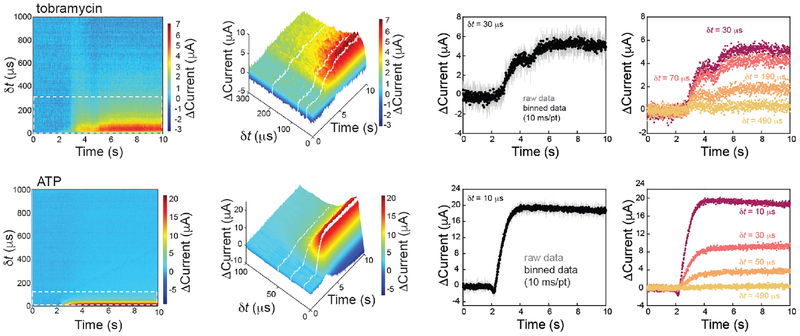
IPA enables a rapid measure of the binding rate of tobramycin and ATP (both small molecules) to the aptamer sensor surface (Figures 6 and 7). To perform binding kinetic experiments, we utilized a square wave potential pulse profile between 0.0 and −0.4 V, with a 1 ms pulse width. This ultimately establishes the temporal resolution of continuous measurements. The current was recorded without filtering at 10 μs resolution. To better visualize the IPA data, we have developed false-color plots similar to those used in FSCV (Figure 6).13 The color plots are created by stacking individual forward-pulse current responses along the x-axis with dt plotted on the y-axis.
Figure 6.
False color plots allow visualization of IPA current response with the addition of target analyte (tobramycin and ATP). 2D and 3D color plots (zoom-in region from false color plots) align each forward pulse along the x-axis, dt along the y-axis, and the change in current (D Current) in the out of plane, or z-axis. Δ Current is plotted as positive (signal-on) for both ATP and Tobramycin (where the sign of the Tobramycin change has been inverted), so that the two sensors can more be more easily compared. Line scans, indicated by the white dashed lines, provide sampled-current time traces with 2 ms time resolution or box-car averaged to yield 10 ms time resolution. Consistent with equilibrium binding data, the sensitivity of the measurement is a function of which dt value is used.
Figure 7.
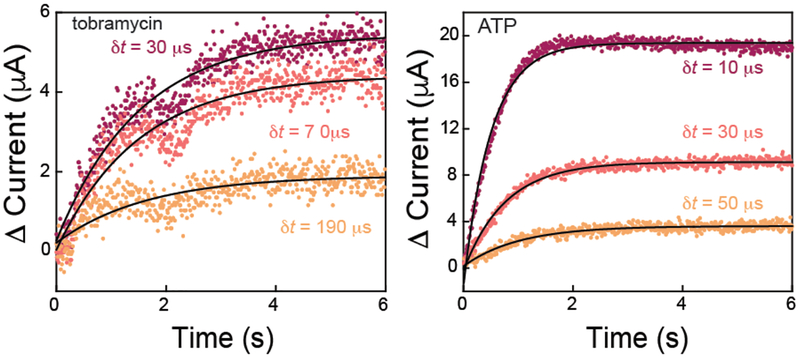
E-AB sensor response follows a single exponential rise as illustrated by sampled-current time traces after the addition of 200 μM tobramycin (left) and ATP (right). Tobramycin sensors respond with a kobs = 0.72 ± 0.04 s−1 whereas the ATP sensor responds in about half the time with a kobs = 1.4 ± 0.4 s−1. Data shown are boxcar averaged and thus represent 10 ms/point time resolution.
Color, in the z-axis, represents the change in absolute current (Δ Current) with respect to the current recorded at the same δt. The baseline for this change was set to the current value before target addition. Note that for the Tobramycin sensor response, Δ Current has been inverted so that the maximum change is a positive value. This allows for a more direct comparison with the ATP sensor.
The addition of 200 μM target can be clearly visualized for both tobramycin and ATP sensors (Figure 6). All data are plotted as a positive Dcurrent value for ease of visualization, however, the polarity of the signal changes match what was observed in the equilibrium measurements. In the case of the tobramycin sensor, reverse pulse color plots also illustrate changes in sensor signal with the addition of target (SI Figure S4). Individual line scans at various dt values (30, 70, 190, and 490 μs for the tobramycin sensor and 10, 30, 50, and 490 μs for the ATP sensor) allow visualization of sampled-current-time traces or trajectories of sensor response with respect to time (Figure 6). Since only the forward pulses are plotted, each data point in the sampled-current-time trace represents the current sampled at the respective dt every 2 ms. This time resolution is ultimately limited by the duration of one complete forward and reverse applied potential pulse. Boxcar averaging of the current smooths the data, at the cost of temporal resolution (10 ms/pt in Figure 6, right).
IPA enables measurement of observed binding rates to E-AB sensor surfaces (Figure 7). The sampled-current-time trace should follow the following exponential rise in current (equation 4)
| (eq. 4) |
where ieq,[T] is the equilibrated current change at equilibrium for a specific T, and the observed binding rate is kobs = kon[T] + koff where kon (M−1 s−1) and koff (s−1), are the on and off binding rates, respectively. The tobramycin sensor equilibrates to a maximum signal change rapidly after the addition of 200 μM tobramycin, as shown when Dcurrent is sampled at δt = 30, 70, and 190 μs (Figure 7, left). More specifically, the sampled-current-time response reaches a rapid increase to an equilibrium current. Fitting the sampled-current-time trace following equation 4, we find kobs = 0.72 ± 0.04 s−1. Similarly, when the ATP sensor is challenged with 200 μM target, the sensor equilibrates faster than the tobramycin counterpart with kobs = 1.4 ± 0.4 s−1. These data mark the fastest electrochemical interrogation to the authors’ best knowledge. Traditional voltammetric interrogation methodologies would typically not be able to capture the observed kobs responses due their potential sweep limitation that at best reaches temporal resolution of seconds. Also, IPA showed good rapid binding kinetics analysis for both small molecule targets when compared with other techniques.25
CONCLUSION
In this manuscript, we demonstrate the use of IPA to monitor E-AB sensor response with 2 ms time resolution. Using IPA represents a potential new electroanalytical technique to push electrochemical aptamer-based sensors into new time regimes, on a par with what is achievable using FSCV. While the data shown in this manuscript reach a time resolution as fast as 2 ms, the time resolution of the technique is ultimately limited to two times the potential pulse width used in the IPA waveform. Presumably, because our current decays to zero after ~200 μs, it is conceivable that we could achieve 400 μs time resolution. Nonetheless, the data provided here are the first demonstration of <5 ms time-resolved measurements of E-AB sensor response. The change in current is quantitatively related to the concentration of the target analyte in solution. Finally, we developed false-color plots as a means to visualize the change in sensor response.
IPA is a potential general strategy to probe both the equilibrium binding and kinetic regimes of E-AB sensor response with unprecedented time resolution. This powerful combination of the IPA technique with E-AB sensors could be applied to a range of analytical applications including real-time measurement of biological processes.
Supplementary Material
Acknowledgments
Funding Sources
Research reported in this publication was supported by the National Institute of General Medical Sciences of the National Institutes of Health under Award Number R01GM117159. The content is solely the responsibility of the authors and does not necessarily represent the official views of the National Institutes of Health.
ABBREVIATIONS
- IPA
intermittent pulse amperometry
- ATP
adenosine triphosphate
- E-AB sensor
electrochemical, aptamer-based sensor
- MB
methylene blue
- SWV
square wave voltammetry
- ACV
alternating current voltammetry
- CV
cyclic voltammetry
- FSCV
fast-scan cyclic voltammetry
- SPR
surface plasmon resonance
Footnotes
ASSOCIATED CONTENT
Supporting Information
This material is available free of charge via the Internet at http://pubs.acs.org. Example raw current time trajectories, equilibrium binding curves obtained using traditional square wave volt-ammetry, and reverse pulse color plots (PDF). The Supporting Information is available free of charge on the ACS Publications web-site.
REFERENCES
- (1).Schoukroun-Barnes LR; Macazo FC; Gutierrez B; Lottermoser J; Liu J; White RJ Reagentless, Structure-Switching, Electrochemical Aptamer-Based Sensors. Annu. Rev. Anal. Chem 2016, 9, 163–181. [DOI] [PMC free article] [PubMed] [Google Scholar]
- (2).Xiao Y; Lubin AA; Heeger AJ; Plaxco KW Label-Free Electronic Detection of Thrombin in Blood Serum by Using an Aptamer-Based Sensor. Angew. Chem. Int. Ed 2005, 44, 5456–5459. [DOI] [PubMed] [Google Scholar]
- (3).Ferapontova EE; Olsen EM; Gothelf KV An RNA Aptamer-Based Electrochemical Biosensor for Detection of Theophylline in Serum An RNA Aptamer-Based Electrochemical Biosensor for Detection of Theophylline in Serum. J. Am. Chem. Soc 2008, 130, 1–4. [DOI] [PubMed] [Google Scholar]
- (4).Baker BR; Lai RY; Wood MS; Doctor EH; Heeger AJ; Plaxco KW An Electronic, Aptamer-Based Small-Molecule Sensor for the Rapid, Label-Free Detection of Cocaine in Adulterated Samples and Biological Fluids. J. Am. Chem. Soc 2006, 128, 3138–3139. [DOI] [PubMed] [Google Scholar]
- (5).Jarczewska M; Kekedy-Nagy L; Nielsen JS; Campos R; Kjems J; Malinowska E; Ferapontova EE Electroanalysis of PM-Levels of Urokinase Plasminogen Activator in Serum by Phosphorothioated RNA Aptamer. Analyst 2015, 140, 3794–3802. [DOI] [PubMed] [Google Scholar]
- (6).White RJ; Plaxco KW Exploiting Binding-Induced Changes in Probe Flexibility for the Optimization of Electrochemical Biosensors. Anal. Chem 2010, 82, 73–76. [DOI] [PMC free article] [PubMed] [Google Scholar]
- (7).Amatore C; Arbault S; Guille M; Lemaître F Electrochemical Monitoring of Single Cell Secretion: Vesicular Exocytosis and Oxidative Stress. Chem. Rev 2008, 108, 2585–2621. [DOI] [PubMed] [Google Scholar]
- (8).Bard Allen J. and Faulkner LR Electrochemical Methods, Fundamentals and Applications, 2nd Ed.; Wiley: New York, 2001. [Google Scholar]
- (9).Mosharov Eugene V. and Sulzer D Analysis of Exocytotic Events Recorded by Amperometry. Nat. Methods 2005, 2 (9), 351–358. [DOI] [PubMed] [Google Scholar]
- (10).Amatore C; Delacotte J; Guille-Collignon M; Lemaître F Vesicular Exocytosis and Microdevices - Microelectrode Arrays. Analyst 2015, 140, 3687–3695. [DOI] [PubMed] [Google Scholar]
- (11).Immunosensors F; Sitdikov R; Ivnitski D; Atanassov P; Lopez GP Intermittent Pulse Amperometry as a Transduction Technique for the Multichannel/Multianalyte Flow-Through Immunosensors. In ECS Meeting; 2007; p 332315. [Google Scholar]
- (12).Arroyo-Currás N; Dauphin-Ducharme P; Ortega G; Ploense KL; Kippin TE; Plaxco KW Sub-Second-Resolved Molecular Measurements in the Living Body Using Chronoamperometrically Interrogated Aptamer-Based Sensors. ACS Sensors 2018, 3, 360–366. [DOI] [PubMed] [Google Scholar]
- (13).Heien MLAV; Johnson MA; Wightman RM Resolving Neurotransmitters Detected by Fast-Scan Cyclic Voltammetry. Anal. Chem 2004, 76, 5697–5704. [DOI] [PubMed] [Google Scholar]
- (14).Rowe AA; Miller EA; Plaxco KW Reagentless Measurement of Aminoglycoside Antibiotics in Blood Serum via an Electrochemical, Ribonucleic Acid Aptamer-Based Biosensor. Anal. Chem 2010, 82, 7090–7095. [DOI] [PMC free article] [PubMed] [Google Scholar]
- (15).White RJ; Rowe AA; Plaxco KW Re-Engineering Aptamers to Support Reagentless, Self-Reporting Electrochemical Sensors. Analyst 2010, 135, 589–594. [DOI] [PMC free article] [PubMed] [Google Scholar]
- (16).Schoukroun-Barnes LR; Wagan S; White RJ Enhancing the Analytical Performance of Electrochemical RNA Aptamer-Based Sensors for Sensitive Detection of Aminoglycoside Antibiotics. Anal. Chem 2014, 86, 1131–1137. [DOI] [PubMed] [Google Scholar]
- (17).Ivanova OS; Zamborini FP Electrochemical Size Discrimination of Gold Nanoparticles Attached to Glass/Indium-Tin-Oxide Electrodes by Oxidation in Bromide-Containing Electrolyte. Anal. Chem 2008, 37, 1783–1791. [DOI] [PubMed] [Google Scholar]
- (18).Liu J, Wagan S Davila M, Taylor J, and White RJ Achieving Reproducible Performance of Electrochemical, Folding Aptamer-Based Sensors on Microelectrodes: Challenges and Prospects. Anal. Chem 2014, 86, 11417–11424. [DOI] [PMC free article] [PubMed] [Google Scholar]
- (19).Huang KC; White RJ Random Walk on a Leash: A Simple Single-Molecule Diffusion Model for Surface-Tethered Redox Molecules with Flexible Linkers. J. Am. Chem. Soc 2013, 135, 12808–12817. [DOI] [PubMed] [Google Scholar]
- (20).Moiroux J; Diderot DPD; Cedex P 3 ′ -Ferrocene-Labeled Oligonucleotide Chains End-Tethered to Gold Electrode Surfaces : Novel Model Systems for Exploring Flexibility of Short DNA Using Cyclic Voltammetry. J. Am. Chem. Soc 2003, 200, 1112–1113. [DOI] [PubMed] [Google Scholar]
- (21).Daum P; Lenhard JR; Rolison D; Murray RW Diffusional Charge Transport through Ultrathin Films of Radiofrequency Plasma Polymerized Vinylferrocene at Low Temperature. J. Am. Chem. Soc 1980, 102, 4649–4653. [Google Scholar]
- (22).Zhao X; Sánchez BM; Dobson PJ; Grant PS The Role of Nanomaterials in Redox-Based Supercapacitors for next Generation Energy Storage Devices. Nanoscale 2011, 3, 839–855. [DOI] [PubMed] [Google Scholar]
- (23).Creager SE; Wooster TT A New Way of Using Ac Voltammetry to Study Redox Kinetics in Electroactive Monolayers. Anal. Chem 1998, 70, 4257–4263. [Google Scholar]
- (24).Eckermann AL; Feld DJ; Shaw JA; Meade TJ Electrochemistry of Redox-Active Self-Assembled Monolayers. Coord. Chem. Rev 2010, 254, 1769–1802. [DOI] [PMC free article] [PubMed] [Google Scholar]
- (25).Chang AL; McKeague M; Liang JC; Smolke CD Kinetic and Equilibrium Binding Characterization of Aptamers to Small Molecules Using a Label-Free, Sensitive, and Scalable Platform. Anal. Chem 2014, 86, 3273–3278. [DOI] [PMC free article] [PubMed] [Google Scholar]
Associated Data
This section collects any data citations, data availability statements, or supplementary materials included in this article.


