Abstract
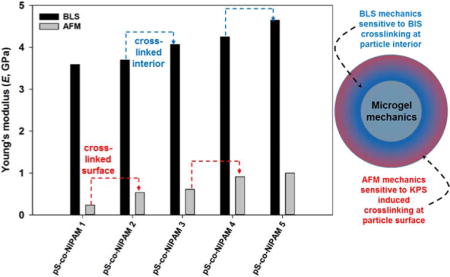
Microgel mechanics are central to the swelling of stimuli-responsive materials and furthermore have recently emerged as a novel design space for tuning the uptake of nanotherapeutics. Despite this importance, the techniques available to assess mechanics, at the sub-micron scale, remain limited. In this report, all mechanical moduli for a series of air-dried, polystyrene-co-poly(N-isopropylacrylamide) (pS-co-NIPAM) microgels of varying composition in monomer and crosslinker (N,N′-methylene-bisacrylamide (BIS)) mol% have been determined using Brillouin light scattering (BLS) and AFM nanoindentation. These techniques sample the material through distinct means and provide complementary nanomechanical data. An initial demonstration of this combined approach is used to evaluate size-dependent nanomechanics in pS particles of varying diameter. For the pS-co-NIPAM series, our BLS results demonstrate an increase in Young’s (E) and shear moduli with increasing NIPAM and/or BIS mol%, while the Poisson’s ratio decreased. The same rank order in E was observed from AFM and the two techniques correlate well. However, at low BIS crosslinking, an inverted particle structure persists and small increases in BIS yield a higher increase in E from AFM relative to BLS, consistent with a higher density at the particle surface. At higher BIS incorporation, the microgel reverts to a typical, dense-core structure and further increasing BIS yields changes to core-particle mechanics reflected in BLS. Lastly, at 75 mol% NIPAM, the microgels displayed a broad volume phase transition and increased crosslinking resulted in a minor, yet unexpected, increase in swelling ratio. This complementary approach offers new insight into nanomechanics critical for microgel design and application.
Graphical Abstract
1. INTRODUCITON
The rapidly expanding design space available to nanoengineering has permitted the development of a broad spectrum of functional materials impactful to multiple research communities in biology, chemistry, physics and medicine. For applications to drug delivery, traditional vector optimization tunes nanoparticle size, shape, charge and surface chemistry to support tissue-specific targeting and increased circulation residency. [1] This approach has recently expanded to further include particle mechanics as a unique design space for modifying endocytic efficiency and biodistribution. [2, 3, 4, 5] Demonstration of cell-specific, mechanosensitive endocytosis further offers a unique targeting strategy by tuning particle stiffness for preferential entry into e.g. cancer cells while simultaneously frustrating macrophage phagocytosis for improving circulation half-life. [5] Routine particle characteristics – e.g. size, shape and charge – have well-established analytical methods for characterization; however, realizing the full potential of particle mechanics requires the development of analytical technologies for comprehensive characterization of mechanics at the sub-micron scale.
Microgels, the colloidal analog to hydrogels, offer a versatile platform to explore the mechanical potential of drug-delivery vectors. Microgels are suspensions of small gel particles composed of a physically and/or chemically crosslinked hydrophilic polymer network that swells with water. Microgel mechanics may be tuned over a broad range by increasing the crosslinking density. Moreover, depending upon the composition of the microgel, equilibrium water content may range from 10 – 90 wt%, with higher water uptake indicative of a larger swelling capacity. Further expanding microgel utility is the realization of “smart”, or “intelligent” microgels, which display a rapid, discontinuous phase volume phase transition (VPT) initiated in response to variation in a specific stimulus, e.g. pH, light, solvent composition, salinity, mechanical stress or temperature. [6, 7]
AFM nanoindentation remains the primary choice for nanomechanical characterization. Young’s moduli (E) have been reported using AFM for single pNIPAM microgel particles above and below the VPT, and in both the dried and hydrated states. [8] Order-of-magnitude increases in E were observed for collapsed pNIPAM microgel particles relative to their swollen state and a further increase in E was observed upon microgel dehydration. [9] Hashmi et al. further tracked the evolution of E with AFM through the VPT for pNIPAM. [10] Similar order-of-magnitude variation was observed in E; however, near the transition temperature a dramatic particle softening was observed which is distinctly lower than that found for the fully swollen particle. Neither the extent of E stiffening from the swollen to collapsed pNIPAM nor the non-monotonic variation in E (notably near the transition temperature) were sufficiently captured by the well-established Flory-Rehner theory, widely applied to macroscopic gel swelling. It was noted by these authors that independent measurement of other elastic moduli, for example the shear modulus (G), may provide valuable insight to microgel elasticity and their theoretical models. [10]
In this report, a series of poly(styrene-co-N-isopropylacrylamide) (pS-co-NIPAM) microgels are prepared using a one-step, surfactant-free synthesis with nominally 50 mol% and 75 mol% pNIPAM and increasing BIS from 0 – 3 mol%. The influence of co-polymer volume fraction and crosslinking density on the mechanical properties of this microgel series is assessed using both Brillouin light scattering (BLS) and AFM nanoindentation. Our complementary approach offers unique insight into nanomechanics, because the individual techniques sample the material through fundamentally distinct means. Furthermore, all mechanical moduli are available to BLS and expands our characterization of nanomechanics beyond Young’s modulus. AFM nanoindentation is inherently surface sensitive and probe penetration depths for our pS-co-NIPAM microgels were in the range of 2 – 7 nm. Moreover, force-displacement curves are measured under essentially static conditions. Alternatively, for BLS, the observed particle resonances arise from whole-particle vibrations with frequencies in the GHz regime. These whole-particle vibrations are expected to be sensitive to microgel core crosslinking, which would be inaccessible to nanoindentation. For viscoelastic materials, BLS can yield significantly higher mechanical moduli relative to low-frequency, or static stiffness determinations because dissipative processes are often too slow relative to the frequency of the hypersonic compressional wave probed in BLS. [11, 12] Recently, Scarcelli et al. reported a comparative evaluation of cellular mechanics using AFM micro-indentation and BLS. The individual sets of data were separated by orders of magnitude (GPa from BLS to kPa from AFM); however, the high-frequency longitudinal modulus (BLS) and Young’s modulus (AFM) displayed a significant correlation suggesting that the two techniques may be used in a complementary fashion. [13]
For pS-co-NIPAM microgels, the radial distribution of co-monomer and crosslinking density is not expected to be completely homogeneous, i.e. the core of the microgel is enriched with polystyrene leaving a shell of predominantly crosslinked pNIPAM. [14] Furthermore, at low BIS crosslinking density, KPS-initiated NIPAM polymerization results in an inverted particle structure with a density gradient highest at the particle surface and decaying toward the particle core. Both KPS and BIS act to crosslink NIPAM, however, the regions of crosslinking are distinct, with KPS introducing crosslinks at the particle periphery while BIS crosslinking is predominantly located near the particle core. [15] As demonstrated by Virtanen et al., the proportional balance between these two crosslinking agents yields pNIPAM microgels with distinct microgel interiors ranging from inverted (higher surface crosslinking) to fuzzy (higher core crosslinking). [15] These separate microgel architectures then permits the opportunity to contrast BLS (whole particle) and AFM (surface sensitive) for deeper insight into the composition dependence of microgel mechanics.
Of further interest in this report is a critical evaluation of size-dependent particle mechanics. [16, 17, 18] With decreasing particle size, the increasing surface-area-to-volume ratio leads to an increased surface energy (or surface stress) that has been proposed to introduce particle stiffening. [19] If decreasing particle size is accompanied by variation in mechanics, this could adversely affect performance in drug delivery applications because stiffer particles have demonstrated preferential endocytosis by macrophage. Should reduction in particle size optimize internalization into a targeted cell line, the concomitant increase in particle stiffness may facilitate a deleteriously rapid macrophage-mediated clearance. [2]
The magnitude of this stiffening is material dependent, and for polymeric materials, size-dependent stiffening can be significant, leading to a multiple-fold increase in Young’s modulus relative to larger, micron-sized particles. The Young’s moduli for polystyrene (pS) particles, with diameters ranging from 57.7 – 955 nm, were previously determined using AFM nanoindentation. [20] For pS particles below approximately 200 nm, a dramatic stiffening was observed. Alternatively for copper nanoparticles only a modest increase in E is observed when particle diameter was reduced below 2–3 nm. [19] A surface-stress induced increase in E would be sensitively reflected from AFM nanoindentation measurements, since probe penetration depths are only a few nanometers. To evaluate how core-particle mechanics potentially vary with size requires a different approach and in this report we directly contrast AFM and BLS, using pS as a model system, to better evaluate size-dependent mechanics.
2. EXPERIMENTAL
2.1 Materials and microgel synthesis
N-isopropylacrylamide (NIPAM, ≥ 99%), styrene (≥ 99%), N,N′-methylenebis(acrylamide) (BIS, ≥ 99.5%) and potassium persulfate (KPS, assay ≥99.9%) were all purchased from Sigma Aldrich. All polystyrene particles were purchased from Bang Laboratories. All chemicals were used as received with the exception of styrene, which was passed through an inhibitor-removing column for removal of the tert-butylcatechol polymerization inhibitor. All water used for the syntheses was ultrapure water from a Millipore water system.
pS-co-NIPAM particle synthesis was performed using a surfactant-free emulsion polymerization method, adapted from the procedure reported by Hellweg et al. and Lyon et al. [14, 21] For all syntheses, NIPAM and BIS were dissolved in 100mL of water, and the reaction was heated to 75 °C using a silicone oil bath and purged with N2 gas for one hour in a three-necked, round-bottom flask. This reaction vessel was equipped with a water-jacketed condenser and an inlet for nitrogen. Styrene was added just prior to initiation of the reaction, using 0.075 gm of KPS pre-dissolved in 1 ml of water. The reaction was allowed to run for 24 hrs. After synthesis, the solution was filtered through glass wool to remove any coagulum. Nanoparticles were purified by centrifugation, decantation and redispersion in deionized water to remove unreacted monomer and initiator. For all particles, the total monomer concentration, including styrene, NIPAM and BIS, was maintained constant at 300 mM.
2.2 Particle characterization: Size and swelling
Air-dried microgel morphology and size distribution were analyzed using scanning electron microscopy (SEM) and AFM imaging. For SEM, dilute microgel suspensions were drop-cast onto a freshly cleaned Si wafer held at 60 °C and air dried. These samples were sputter coated with gold-palladium by an argon beam K550 sputter coater (Emitech Ltd.). SEM images were captured using a Hitachi S-4800 SEM (Hitachi High-Technologies). The average particle size was obtained by manually measuring at least fifty imaged particles. For AFM, Si wafers (Ted Pella Inc.) were used as substrates to deposit pS-co-NIPAM particles after first cleaning the wafer by sonication in ethanol for 5 minutes and washing with deionized water followed by ethanol and drying in air. Dilute microgel suspensions were drop-cast and air dried on a freshly cleaned Si wafer. All the AFM measurements were performed using a Molecular Force Probe 3D AFM (Asylum Research, Santa Barbara, CA). Reported height and width values of nanoparticles were an average of ~100 individual particles which were obtained using a cross-sectional analysis from AFM images.
Further size characterization of the hydrated microgel was performed using dynamic light scattering (DLS). Dilute microgel suspensions were prepared in water and characterized using a Zetasizer Nano-ZS (Malvern Instruments) using a 173° backscattering geometry. Each pS-co-NIPAM composition was measured in triplicate from 10 °C to 60 °C. At the lowest temperature point, the sample was equilibrated for 20 min. prior to measurement. At each subsequent temperature point, the sample was equilibrated for five minutes.
2.3 Brillouin light scattering
Our custom-made Brillouin-scattering instrumentation offers flexibility in selection of scattering geometry. Briefly the excitation source (single-mode, λ = 532 nm) is taken from an efficient diode pumped, visible CW laser (Excelsior, Spectra Physics) through frequency doubling in a nonlinear crystal. For removal of spurious laser modes, a temperature controlled etalon (TCF-1 JRS Scientific Instruments) is inserted in the beam path immediately following the laser head. BLS measurements of microgels are performed with a modified Olympus BX51 microscope system optically interfaced to a six-pass tandem Fabry-Perot interferometer (JRS Scientific Instruments) and scattered light is detected by single photon counting module (COUNT® BLUE Series, Laser components) operating with a quantum efficiency slightly over 70 % at 532 nm.
The microscope objective lens served as both the focusing and collection lens. It has been observed that when the light is focused at normal incidence, the intense reflected light going back to the interferometer shows spurious peaks in the spectrum. To prevent this, a dark field objective (NA = 0.90) has been used to focus the light at a grazing angle on the sample surface. In this configuration direct reflection from the wafer is prevented from going to the interferometer and effectively suppressed the observation of spurious modes even at long acquisition times. The Brillouin spectrum of bulk films were recorded in 180° backscattering geometry by using a small mirror and a lens to focus the light on to the sample and the scattered light is collected by the same lens and directed into the interferometer.
2.4 AFM nanoindentation
All nanoindentation experiments were performed using a Molecular Force Probe 3D AFM (Asylum Research, Santa Barbara, CA) and 8 different Si3N4 tips (Mikromasch, Watsonville, CA, CSC37) having a spring constant range of 0.2 – 0.8 N/m. Actual spring constants were determined using a built-in thermal noise method. [22] Single particles were located from the AFM height images using AC mode in air with 1 Hz scan rate prior to the force measurements. Force-displacement curves were collected in air at 22 ± 2 °C at the approximate center of imaged single pS-co-NIPAM particles in contact mode with a maximum applied loading force of 30 nN and a 500 nm/s approach velocity.
For the Young’s modulus calculations, a tip radius of curvature of 10 nm and a Poisson’s ratio of 0.25 for the Si3N4 AFM tip was used. Poisson’s ratios, which were calculated using the BLS measurements, were used for all pS-co-NIPAM samples. Based on the statistical analysis, force plots which yielded extremely high or low stiffness values were a result of tip contacting the hard Si wafer surface and the edges of pS-co-NIPAM particles, therefore those results were excluded from force curve analysis. Typically, as a result of such analysis, ca 10% of the total force plots were excluded. To get an average stiffness value, five consecutive force measurements were taken on 60 individual particles for each pS-co-NIPAM sample. The approach data of the force curves were fit using the Johnson-Kendell-Roberts (JKR) model to calculate the stiffness values of pS-co-NIPAM particles. [23]
3. RESULTS AND DISCUSSION
3.1 Particle spectroscopy with BLS
Particle spectroscopy with BLS is q-independent, analogous to Raman scattering, and the obtained BLS particle frequencies are insensitive to scattering angle. [24, 25, 26] This is in contrast to bulk-sample BLS, whereby sampling multiple scattering geometries (multiple directions of q) is required for experimentally assessing mechanical anisotropy, particularly for low-symmetry systems. While particle spectroscopy with BLS does not inherently offer this advantage of multiple-q sampling, the number of resonances observed in a particle BLS spectrum can be significantly higher, depending upon particle size, relative to the three available modes in bulk-sample BLS of solids for any arbitrary q. However, for particle diameters of 150 – 200 nm, typically 3–4 resonances are observed, and while this is sufficient for isotropic materials, this would challenge application to low-symmetry materials.
To begin our discussion of particle spectroscopy using BLS, we provide a brief review of the theoretical treatment for an elastic sphere’s acoustic wave displacement field and the associated eigenfrequencies. [27, 28, 29, 30, 31] For an elastically isotropic material, there are two independent elastic parameters, and, per our discussion, we select VL and VT, which are respectively the longitudinal and transverse acoustic wave velocities. [32] From these two parameters, any mechanical modulus (bulk, shear, Young’s, etc.) may then be calculated. [33] Assuming a harmonic time dependence of e−iωt, the equation of motion for an isotropic elastic solid may be written as,
| (1) |
Following a Helmholtz decomposition, the general displacement field (u) maybe written as the combination of a curl-free vector field (∇× uL = 0) and a divergence-free vector field (∇· uT = 0), such that the general displacement field may be decomposed into separate contributions with uL and uT being the longitudinal and transverse vector fields, respectively.
To obtain specific solutions to Eq. 1 requires assignment of the boundary conditions, i.e. imposing an idealized, free-surface at the particle surface. Non-trivial solutions to the system of equations provide two distinct cases that satisfy this requirement and give rise to two separate vibrational branches: torsional and spheroidal.
Solutions belonging to the spheroidal branch are obtained when,
| (2) |
which is a special case within the spheroidal branch with only radial displacement, i.e. a particle breathing mode of pure compressional character. Eigenfrequencies for spheroidal vibrations of l ≠ 0 is shown in Eq. 3 immediately below,
| (3) |
where jl are the spherical Bessel functions of the first kind. In both Eqs. 2 and 3 the substitution has been made that,
| (4a.) |
| (4b.) |
The primary outcome of this treatment is the frequencies (νnl) of whole-particle vibrations were predicted by Lamb to scale linearly with inverse particle diameter (D) provided that VL and VT remain constant over the range of particle sizes. [28]
As particle size decreases to sub-micron dimension, the vibrational frequencies are expected in the GHz regime for typical sound velocities on the order of a few km/s. Considering the Brillouin shift equation, which for an isotropic system may be expressed as,
| (5) |
where the frequency shift (ν) is linearly related to the material sound velocity (V) and the acoustic wavevector (q). [32] With an incident light source of wavelength (λ) of 532 nm, and using typical values for refractive index (n) and acoustic velocity, one finds that the frequency window observable in BLS is coincident with that expected for sub-micron particles. The observation of multiple, discrete BLS resonances at GHz frequencies has been previously reported for sub-micron particles of varying composition: PMMA, silica, CaCO3 and polystyrene. [24, 25, 26, 34] Moreover, for each of these materials, the expected linear correspondence of particle frequency and 1/D has been observed and is theoretically modeled using a single VL and VT.
3.2 Model AFM and BLS comparison: pS size-dependent mechanics
Recently Guo et al. have reported the elastic moduli of pS particles, with varying diameters from 57.7 to 954.7 nm, using nanoindentation. [20] An error analysis was performed to determine the sensitivity of the stiffness result to tip material and geometry, data analysis model (Hertzian or JKR) and the influence of particle deformation under the compressive load. Overall, the absolute value of the Young’s modulus varied from approximately 2 – 8 GPa depending upon which specific combination of experimental considerations were employed. However, in all cases, a clear size-dependent increase in the Young’s modulus was observed as the pS particle diameter decreased below approximately 200 nm. [20]
To explore this potential size-dependent stiffening further, BLS spectra for pS particles of varying particle diameter from 96 – 483 nm were measured and shown in Figure 1. These spectra are plotted on a reduced frequency axis, i.e. particle diameter times BLS frequency, to clearly separate mechanical variation in frequency from the expected influence of particle size. Based on the selection rules reported by Montagna, the three lowest-energy particle resonances for the pS particle spectra have been assigned (n,l) quantum numbers of (1,2), (1,3), and (1,4), respectively. [26, 35, 36] For our pS particles, all BLS resonances, on a reduced frequency axis, are unchanged and agree well with those previously reported by Cheng et al. [26] This clearly suggests that size-dependent variation in pS particle mechanics, as assessed by the whole-particle vibrations probed in BLS, is minor over the studied particle size range.
Figure 1.
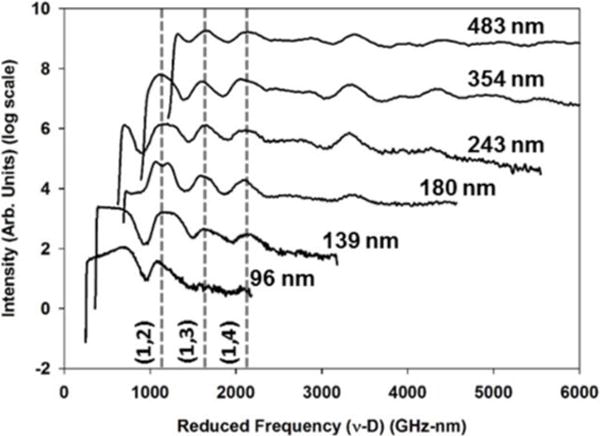
Overlay of BLS spectra for pS particles of different sized diameters. Dashed lines correspond to spherical modes with the (n,l) quantum numbers.
To determine the particle mechanics, a program written in Mathematica was used to obtain the numerical solutions to Eq. 3. The values of VL, VT and D are used as input parameters. Diameters for all particles in this report are taken from the SEM images. We observed that the roots to Eq. 3 are largely insensitive to VL and therefore to better constrain VL the Brillouin spectrum of a bulk film of pS particles was obtained. Further details regarding this insensitivity of VL are provided as supporting information. This approach follows that from previous studies that observed minor deviation of longitudinal frequencies calculated from particle BLS spectra and the corresponding bulk material. [26, 37]
Bulk films of pS were initially prepared by drop-casting a dilute particle suspension onto a freshly cleaned Si wafer. After drying, the sample was briefly heated using a heat gun until a transparent film was obtained. The longitudinal acoustic velocity (VL) of the bulk films were obtained from the Brillouin shift frequency for a backscattering geometry (θ = 180) using Eq. 5 and a refractive index of n = 1.598. With VL and D provided, the remaining adjustable parameter to match the experimental particle frequencies is then VT. The set of different roots with its (n,l) indices obtained theoretically are compared with the experimental frequencies and used to compute the residual . The evaluation of the residual is conducted for a fixed VL and D, and minimized using a floating VT, with the optimal value of VT being that which minimizes the residual. For the entire pS size range, the averaged difference between the experimental and theoretical frequencies was approximately 2.5 %. The VL and VT obtained through this analysis for pS are 2349 ± 47 m/s and 1152 ± 23 m/s, respectively.
To benchmark the quality of our VT determination, we attempted a forward scattering geometry for pS films to gain access to the transverse acoustic modes, which are not available to a backscattering geometry. For the prepared pS films, the transverse modes were not observed because the elastically scattered Rayleigh line for these films was broader and masked their expected location. However, for a thin plate sample (ca. 0.5 mm thickness) of pure pS, the transverse acoustic modes were weakly observed at 3.10 GHz in 90° forward scattering geometry and this is shown in Figure 2.
Figure 2.
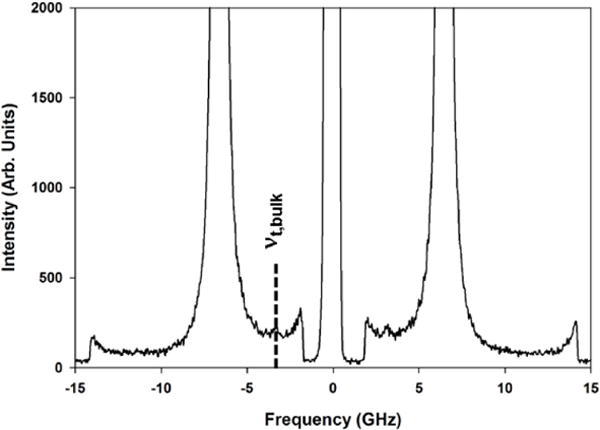
BLS spectrum of bulk pS in a 90° forward scattering geometry. The Stokes-shifted transverse acoustic mode at 3.10 GHz is highlighted by the dashed line.
Relative to the longitudinal acoustic modes, the BLS intensity of the transverse acoustic modes were found to be approximately 100-fold less intense and their weak intensity is consistent with the small strain-optical coefficient reported previously. [38] For a 90° forward scattering geometry of bulk pS and using our VT of 1152 m/s, the expected transverse frequency is near 3.06 GHz, which is within 2% of the measured VT for pS and supports the results obtained from the BLS particle spectra. As noted by Still et al., the advantage of BLS in application to particle spectroscopy is unique access to transverse modes that may be obscured through traditional methods. [39]
Shown in Figure 3, plotting the particle BLS frequencies for the (1,2), (1,3) and (1,4) modes against inverse particle diameter reveals the Lamb-predicted linear dependence is well-preserved and consistent with previous results. [26] Moreover, fitting this data with our VL and VT for pS sufficiently reproduces all observed BLS frequencies across the particle-size series and indicates no significant size-dependent particle mechanics for pS over 96 – 483 nm. This comparison of measured and predicted vibrational frequencies for all pS particles are collected in Table I.
Figure 3.
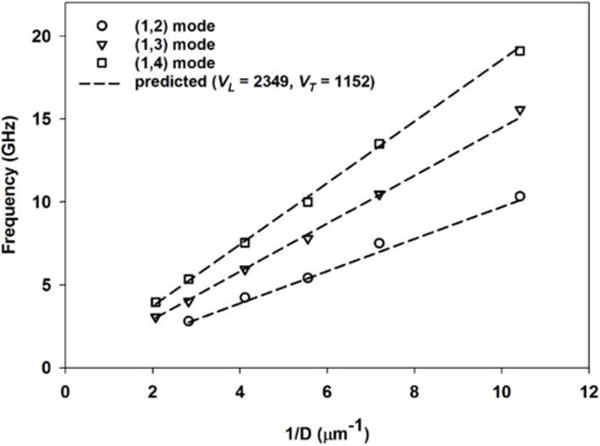
Observed relationship between the measured BLS particle frequencies for the first three spheroidal modes for pS and the inverse particle diameter (1/D). Dashed lines correspond to the calculated BLS particle frequencies our determined VL and VT for pS.
Table I.
Comparison of the measured and predicted BLS particle frequencies for a range of different pS particle sizes. Predicted BLS particle frequencies are determined using VL = 2349 m/s and VT = 1152 m/s.
| pS particle diameter (nm) | Particle BLS frequencies, νi ((1,2), (1,3), (1,4)) |
Predicted particle BLS frequencies, νi,pred ((1,2), (1,3), (1,4)) |
Average % prediction error |
|---|---|---|---|
| 96 ± 5 | 10.33, 15.56, 19.09 | 10.11, 15.08, 19.35 | 2.2 % |
| 139 ± 4 | 7.50, 10.47, 13.51 | 6.98, 10.41, 13.36 | 2.9 % |
| 180 ± 6 | 5.41, 7.79, 10.00 | 5.39, 8.09, 10.31 | 2.5 % |
| 243 ± 4 | 4.24, 5.93, 7.54 | 4.00, 5.96, 7.64 | 2.5 % |
| 354 ± 5 | 2.81, 4.00, 5.34 | 2.74, 4.09, 5.25 | 2.1 % |
| 483 ± 8 | —, 3.06, 3.96 | —, 3.01, 3.85 | 2.2 % |
The Young’s moduli data reported by Guo et al. was extracted using the GetData graph digitizer and these results are overlaid in Figure 4 with the Young’s moduli calculated from our BLS results (EBLS = 3.74 ± 0.15). [20] For our BLS results, we estimate an error of 2% for VT which introduces an error of approximately 4% for the determined Young’s modulus. While the precise mechanism of size-dependent particle stiffening remains an open question centrally relevant to nanomechanics, it is clear that the stiffening of pS is localized to the particle surface (as determined by AFM) with minimal contribution from the particle interior (as determined by BLS) and a comprehensive analysis of particle mechanics requires the use of complementary methods.
Figure 4.
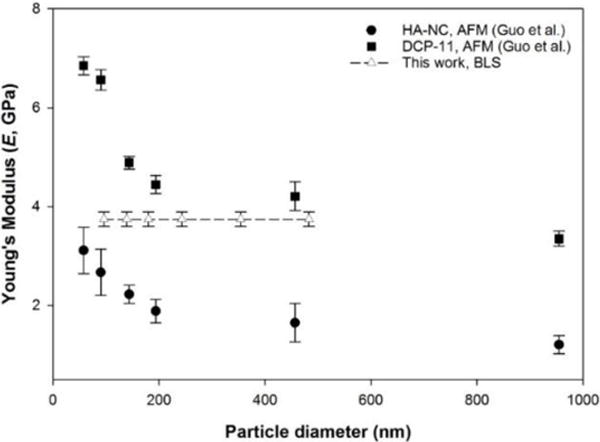
Relative comparison of the size-dependence for the Young’s modulus of pS determined by BLS (dashed line) and a previous nanoindentation study using two different AFM tips.
3.3 Microgel characterization: Particle size and swelling ratio
For our microgel series, the specific details of each microgel composition and size (determined by SEM and AFM) are collected in Table II. SEM micrographs for all microgel compositions reported in this work are shown in Figure 5. Overall, our microgels display excellent uniformity in their particle-size distributions. Further particle size characterization was performed using dynamic light scattering (DLS). Results from the particle-size determination by DLS are reported in Table III with the volumetric swelling ratio (α) calculated using,
| (6) |
where D10 and D60 respectively denote the particle diameter determined by DLS at 10 °C (swollen state) and 60 °C (collapsed state). For the pNIPAM microgels with increasing BIS crosslinking, the expected reduction in α was observed; however, notably for some pS-co-NIPAM microgels a slight opposite tendency was displayed, i.e. with increased incorporation of BIS the volumetric swelling ratio also increased.
Table II.
Composition of the pS-co-NIPAM series and a comparative size analysis using SEM and AFM.
| Microgel Sample | Composition (mol%) (Styrene:NIPAM: BIS) | Diameter (nm) (Dried, SEM) |
Height (nm) (Dried, AFM) |
Width (nm) (Dried, AFM) |
Aspect ratio (Width/Height, AFM) |
|---|---|---|---|---|---|
| pS-co-NIPAM-1 | 50:50:0 | 170 ± 5 | 200 ± 4 | 247 ± 12 | 1.23 ± 0.06 |
| pS-co-NIPAM-2 | 49.5:49.5:1 | 175 ± 4 | 213 ± 4 | 247 ± 6 | 1.16 ± 0.04 |
| pS-co-NIPAM-3 | 48.5:48.5:3 | 164 ± 4 | 187 ± 2 | 238 ± 8 | 1.27 ± 0.04 |
| pS-co-NIPAM-4 | 24.75:74.25:1 | 171 ± 8 | 181 ± 5 | 254 ± 10 | 1.40 ± 0.07 |
| pS-co-NIPAM-5 | 24:73:3 | 190 ± 6 | 170 ± 7 | 252 ± 10 | 1.48 ± 0.08 |
Figure 5.
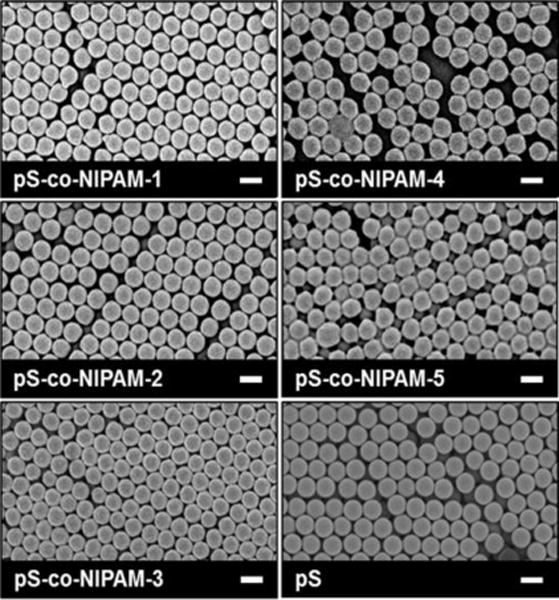
SEM micrographs of pS and the pS-co-NIPAM microgel series. The scale bar in each micrograph represents 200 nm.
Table III.
Temperature dependent particle sizes determined by DLS for the pS-co-NIPAM microgel series and two pNIPAM samples of different BIS crosslinking (-A, 7 mol% BIS, -B, 2 mol% BIS).
| Microgel Sample | Diameter (nm) (DLS at T= 10 °C) | Diameter (nm) (DLS, T = 60 °C) | Volume swelling ratio (α) |
|---|---|---|---|
| pS-co-NIPAM-1 | 220 ± 22 | 221 ± 6 | N/A |
| pS-co-NIPAM-2 | 243 ± 26 | 234 ± 19 | N/A |
| pS-co-NIPAM-3 | 235 ± 18 | 234 ± 23 | N/A |
| pS-co-NIPAM-4 | 342 ± 10 | 222 ± 3 | 3.67 ± 0.17 |
| pS-co-NIPAM-5 | 402 ± 12 | 248 ± 7 | 4.26 ± 0.06 |
| pNIPAM-A | 525 ± 14 | 268 ± 10 | 7.52 ± 0.26 |
| pNIPAM-B | 627 ± 12 | 252 ± 13 | 15.40 ± 0.84 |
3.4 Bulk film BLS spectra for the pS-co-NIPAM series
To characterize the mechanical properties of these microgels, VL is first obtained from the bulk film BLS spectra. Bulk films of each co-polymer system were initially prepared by drop-casting a dilute particle suspension onto a freshly cleaned Si wafer. After drying, bulk films of the microgels were prepared by briefly heating the Si wafer with a heat gun until a transparent film was obtained. The longitudinal acoustic velocity (VL) of the bulk films were obtained from the Brillouin shift for the backscattering geometry which reduces Eq. 5 to [32],
| (7) |
The refractive index of pS-co-NIPAM is obtained from the mixing rule of Lorentz-Lorentz relation shown below [40],
| (8) |
where n12 is the refractive index of pS-co-NIPAM and ϕ1 and ϕ2 are the volume fraction of pNIPAM and pS respectively calculated from the relative composition of NIPAM and styrene listed in Table II. Using n1 =1.500 and n2 = 1.598 as the refractive indices of the individual components (pNIPAM and pS respectively) we calculated of the copolymer refractive index. [41, 42] It was assumed that the minor introduction of BIS (below 3 mol% in all cases) would not yield significant adjustment to the refractive index and the calculated n12 is provided in Table IV for all pS-co-NIPAM compositions.
Table IV.
BLS results for the pS-co-NIPAM and pNIPAM microgel series. Predicted particle BLS frequencies were determined using the corresponding VL and VT shown.
| Microgel Sample | Refractive index (n) | Bulk film BLS frequency, νfilm (GHz) |
Particle BLS reduced frequencies, νiD ((1.2), (1.3), (1,4)) |
Predicted particle BLS frequencies, νi,predD ((1,2), (1,3), (1,4)) |
Sound velocities (m/s) (VL, VT) |
|---|---|---|---|---|---|
| pS-co-NIPAM-1 | 1.547 | 14.47 | 947.2, 1356.5, 1800.9 | 929.6, 1388.7, 1784.5 | 2488, 1100 |
| pS-co-NIPAM-2 | 1.547 | 14.47 | 951.0, 1384.4, 1829.8 | 946.3, 1413.3, 1815.7 | 2488, 1120 |
| pS-co-NIPAM-3 | 1.547 | 14.69 | 1004.0, 1466.6, 1917.8 | 996.5, 1487.4, 1910.1 | 2526, 1180 |
| pS-co-NIPAM-4 | 1.523 | 14.42 | 1023.4, 1517.4, 1940.9 | 1013.2, 1512, 1941.5 | 2518, 1200 |
| pS-co-NIPAM-5 | 1.523 | 14.85 | 1071.7, 1555.3, 2052.0 | 1063.4, 1586.1, 2036.0 | 2595, 1260 |
| pNIPAM-A | 1.500 | 15.13 | N/A | N/A | 2684, N/A |
| pNIPAM-B | 1.500 | 14.24 | N/A | N/A | 2525, N/A |
Further support for our calculated refractive indices was provided using the combination of a 90° forward and 180° backscattering geometry with the ratio of obtained BLS frequencies providing a measure of refractive index. [43] For these samples, bulk film preparation followed the same procedure, however, the substrate was a glass microscope slide, instead of a Si wafer, to provide optical access to the 90° forward scattering geometry. Using the longitudinal frequencies for pS and two representative microgel compositions, pS-co-NIPAM-3 and pS-co-NIPAM-5, our BLS determined refractive indices matched to within 2% of the theoretically determined values.
A summary of the longitudinal BLS frequencies is shown in Table IV and the corresponding bulk-film BLS spectra are collected in Figure 6. In Fig. 6, it is seen that at 2 mol% BIS crosslinking pNIPAM-B and pS bulk films have similar longitudinal acoustic velocities; however, upon further increase of the BIS crosslinking to 7 mol% (pNIPAM-A) VL increases by approximately 6% relative to pNIPAM-B. The sound velocities reported here for dried samples are consistent with other common hydrogels (poly(2-hydroxyethylmethacrylate) and poly(vinyl alcohol)) with mechanical properties determined using BLS. [44, 45] The same tendency is observed when comparing the pS-co-NIPAM compositions where the relative styrene:NIPAM monomer ratio remains nominally constant while increasing the BIS concentration. For both pS-co-NIPAM-2 and -3, and pS-co-NIPAM-4 and -5, increasing the relative BIS concentration by 2% resulted in a similar (ca. 2%) increase in the acoustic velocity.
Figure 6.
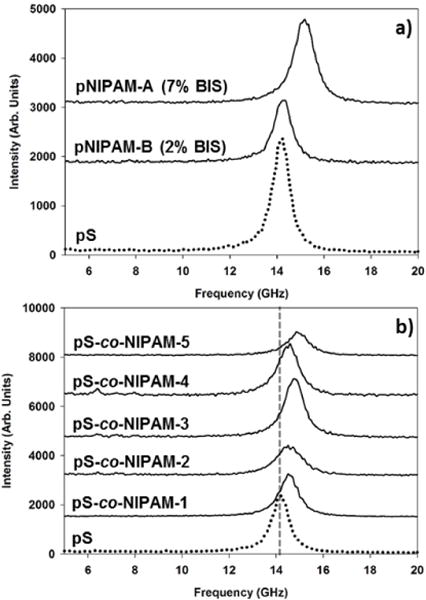
Anti-Stokes BLS spectra of air-dried, microgel films of a.) pNIPAM-A and pNIPAM-B and b.) the pS-co-NIPAM series relative to pS.
3.5 pS-co-NIPAM particle BLS spectra
Particle BLS spectra of the pS-co-NIPAM microgel series are shown in Figure 7. Similarly to pS, these BLS spectra are displayed on a reduced frequency axis for clear demonstration of mechanical variation apart from the expected size dependence. Three clear particle resonances are observed on either side of the elastically scattered Rayleigh line (omitted for clarity from Fig. 7) and the observed BLS peaks of the microgel particles are assigned to spheroidal modes. [36, 46] Li et al. asserted that only spheroidal modes with even l quantum number are Brillouin active, but recent theoretical analysis of Brillouin intensity of nanoparticles suggest that both even and odd l modes contribute to the Brillouin spectrum. [27, 36, 46] Consistent with the BLS spectra for pS-co-NIPAM bulk films, increasing the BIS crosslinking density clearly blue-shifts the particle vibrational frequencies.
Figure 7.
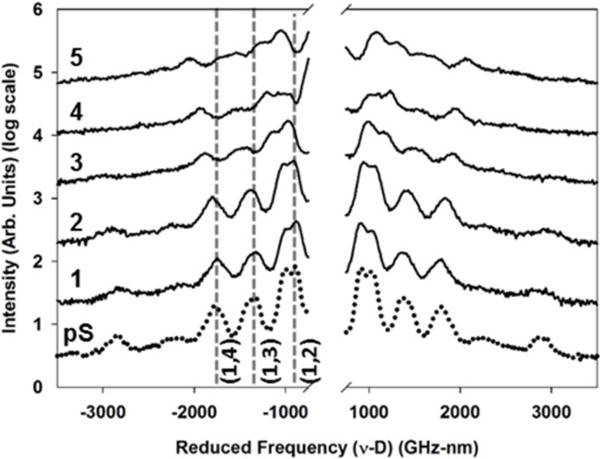
Particle BLS spectra for the pS-co-NIPAM microgel series shown relative to pS on a reduced frequency axis. For illustration, the spectra displaced on the intensity axis. Dashed lines correspond to the spheroidal modes of (n,l) quantum number.
Inspection of dilute nanoparticle suspension dried on the Si wafer reveals regions of thick and thin deposition. When the BLS spectra are obtained from the thin region of deposition, a splitting of the (1,2) mode is observed, whereas spectra obtained from the thick region exhibit a broad asymmetric peak. A comparison of the BLS spectra obtained for these two deposition thicknesses is shown in Figure 8 for pS-co-NIPAM-3 and it is evident that while splitting in the (1,2) spheroidal mode is observed for near monolayer particle deposition, the modal frequencies remain unchanged between regions of thicker and thinner sample deposition. This suggests that pS-co-NIPAM particle deformation is highest at the particle-substrate contact and subsequent layers of particles experience less distortion. If particle distortion were equivalent throughout the entire sample, the peak splitting observed for thin regions of sample deposition would have persisted even for thick, mutli-layered regions of deposition. For consistency, in the frequency analysis of the split (1,2) mode observed for the thin sample regions, the mid-position was taken.
Figure 8.
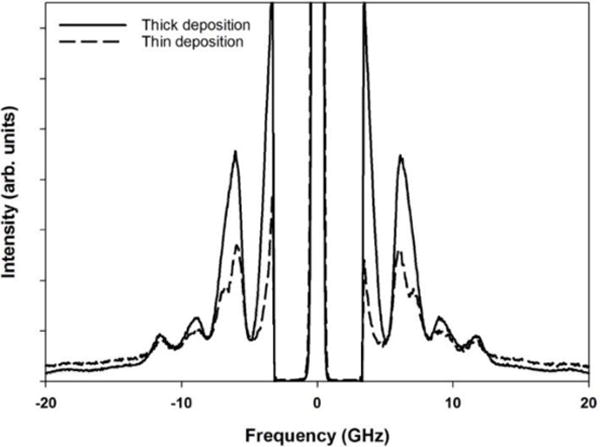
Comparison of the BLS particle spectra collected for pS-co-NIPAM-3 from regions of thin and thick sample deposition. Splitting is evident for the (1,2) spheroidal mode for BLS spectra collected from regions of thin sample deposition.
Both DLS and SEM determined particle distributions were monodisperse, hence polydispersity would only marginally contribute to potential peak splitting. Alternatively, the observed splitting may be a result of shape distortion from the assumed ideal case of a sphere. The BLS spectra for elongated polystyrene particles was reported by Schneider et al. over a series of particle aspect ratios. Notably a relaxation in the degeneracy of (1,2) spheroidal mode resulted in peak splitting with a reported onset at an aspect ratio of 1.28 (i.e. long particle axis divided by short particle axis). [47] For pure pNIPAM, even at high BIS crosslinking, the spreading was significant as observed by AFM imaging. With respect to Table II, the apparent height for pNIPAM-A was 85 ± 3.6 nm; however, the particle width was 370 ± 31 nm. Pure pNIPAM microgels did not provide suitable BLS particle spectra due the significant particle distortion upon drying. For all microgels spreading is evident from the aspect ratios determined using AFM. At higher NIPAM incorporation, particle spreading upon drying becomes higher and this is further supported by both the increased splitting of the (1,2) spheroidal mode and the increased particle aspect ratio determined by AFM. Further reported by Schneider et al. is only at the highest particle distortion (aspect ratio ca. 4) was significant deviation in particle mechanics observed with an approximately 12% increase in stiffness relative to spherical particles. Our aspect ratios are comparatively modest and with the expectation that only particles near the substrate suffer the highest distortion, the mechanical moduli reported for pS-co-NIPAM are determined using a spherical-particle model consistent with the theoretical treatment summarized in Section 3.1.
The reduced frequencies for each microgel are reported in Table IV. The raw particle frequencies for a specific composition may be obtained by dividing the reduced frequencies by the specific particle diameter (determined by SEM) listed in Table II. Using the same minimization routine discussed for pS, VT was determined for all microgels and the results of this analysis are provided in Table IV. For calculation of the engineering moduli (Young’s modulus (E), Poisson’s ratio (σ), bulk modulus (K) and shear modulus (G)), the density is needed. The density of pS-co-NIPAM (ρ12) is obtained from the density of bulk pNIPAM (ρ1 = 1.1 g/mL) and pS (ρ2 = 1.05 g/mL) using the following relation,
| (9) |
where the minor BIS contribution is assumed to have a negligible influence on the particle density. Calculated densities and engineering moduli for the pS-co-NIPAM microgel series are collected in Table V.
Table V.
Comparison of mechanical moduli determined for the air-dried pS-co-NIPAM microgel series using BLS and AFM nanoindentation.
| Microgel Sample | Density, ρ (g/mL) |
Bulk modulus, K (GPa) |
Shear modulus, G (GPa) |
Poisson’s ratio, σ | BLS Young’s modulus, E (GPa) |
AFM Young’s modulus, E (GPa) |
|---|---|---|---|---|---|---|
| pS-co-NIPAM-1 | 1.075 | 4.92 ± 0.2 | 1.30 ± 0.05 | 0.380 ± 0.015 | 3.59 ± 0.14 | 0.24 ± 0.03 |
| pS-co-NIPAM-2 | 1.075 | 4.86 ± 0.19 | 1.35 ± 0.05 | 0.373 ± 0.015 | 3.70 ± 0.15 | 0.54 ± 0.03 |
| pS-co-NIPAM-3 | 1.075 | 4.86 ± 0.19 | 1.50 ± 0.06 | 0.360 ± 0.014 | 4.07 ± 0.16 | 0.61 ± 0.05 |
| pS-co-NIPAM-4 | 1.088 | 4.92 ± 0.2 | 1.57 ± 0.06 | 0.356 ± 0.014 | 4.25 ± 0.16 | 0.91 ± 0.06 |
| pS-co-NIPAM-5 | 1.088 | 5.02 ± 0.2 | 1.73 ± 0.07 | 0.346 ± 0.013 | 4.65 ± 0.19 | 0.99 ± 0.03 |
Inspection of Table V reveals that the bulk modulus for all dried pS-co-NIPAM microgels is largely insensitive to crosslinking density and styrene:NIPAM composition while being approximately 20% larger than pS particles. Alternatively shear moduli increased approximately linearly with BIS mol% as anticipated from rubber elasticity theory. The Young’s modulus revealed was most sensitive to increased BIS crosslinking. For example, between pS-co-NIPAM-2 and 3 and pS-co-NIPAM-4 and 5 the Young’s modulus changed by 10.0% and 9.4%, respectively, which reflects the sensitivity of BLS to BIS crosslinking. Furthermore, with an increase in the ratio of NIPAM to pS, the Young’s modulus increases by 12.5%, which shows that incorporation of NIPAM confers an increased stiffness to the copolymer and is consistent with the bulk film BLS spectra.
3.6 Microgel mechanics determined by AFM nanoindentation
AFM nanoindentation remains the gold standard for evaluating material mechanics at the sub-micron scale. [48, 49, 50] Our specific interest is to compare the results obtained from AFM with those provided from BLS with the expectation that the alternative mechanisms through which each technique probes the material will provide unique mechanical data, particularly for particles with a non-homogeneous interior. Nanoindentation results for the complete pS-co-NIPAM series are collected in Table V and representative force-displacement curves for all materials are provided as Supporting Information.
A direct comparison of AFM and BLS determined Young’s moduli for the pS-co-NIPAM is shown in Figure 9 and while the BLS results display consistently higher Young’s moduli than those determined from nanoindentation, however, a reasonable correlation between the two techniques does exist. One source of this difference may be the frequency of measurement. The GHz frequencies measured in BLS would result in significant apparent stiffening for viscoelastic materials provided the dissipative component (i.e. loss modulus) is operative at time scales substantially longer than the hypersonic compressional wave. For AFM nanoindentation, the force-displacement curves are obtained under essentially static conditions and thus provide ample time for material relaxation under stress, which may result in a lower elastic modulus. Scarcelli et al. have demonstrated for multiple, bulk samples, a log-log linear relationship between the longitudinal modulus (M) determined by BLS and either the shear modulus (G) determined by rheometry or Young’s modulus (E) determined by indentation. [13, 51] This empirical relationship has further been reported by Antonacci for polydimethylsiloxane (PDMS) gels and silicone rubbers. [52] The large differences in moduli (kPa, static vs. GPa, BLS) were partially attributed to the sensitivity of the compressional wave (BLS) to water and with a Poisson’s ratio near 0.5 (for an incompressible fluid) the BLS obtained moduli would be expected to be higher. This is consistent with our air-dried microgels with the difference between AFM and BLS being considerably smaller, i.e. one order of magnitude or less, than previously reported for hydrated samples.
Figure 9.
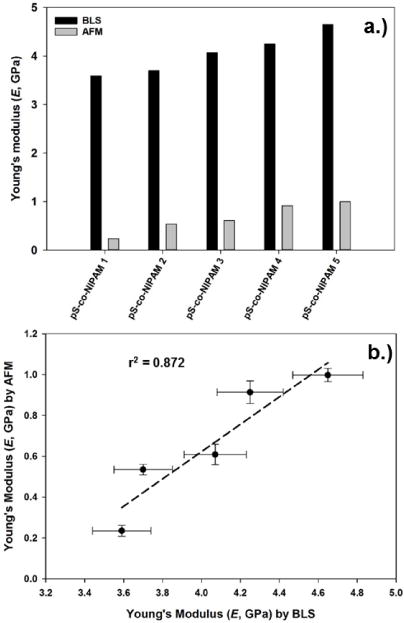
a.) Direct comparison of Young’s moduli determined for the pS-co-NIPAM microgel series using BLS (black columns) and AFM nanoindentation (gray columns). b.) Linear correlation (r2 = 0.872) of the BLS and AFM determined Young’s moduli for the pS-co-NIPAM series.
To explore whether a similar log-log linear behavior is observed for pS-co-NIPAM, log-log transformations were performed here and while a positive correlation persists, the original r2 shown in Figure 9 decreases to r2 = 0.660, log MBLS vs. log EAFM, and r2 = 0.666, log MBLS vs. log GAFM. Note that the calculation of MBLS and GAFM were performed using standard elasticity relationships for isotropic materials and for calculating GAFM the Poisson’s ratios determined from BLS were used. [33] All log-log transformations are provided as Supporting Information. While these analyses do not wholly exclude a potential frequency-dependent contribution to the differences in AFM- and BLS-determined moduli, it does highlight the need for alternative considerations when comparing the data from these two techniques.
As demonstrated by Guo et al., the absolute value of the Young’s modulus is sensitive to the selected model for data analysis. The JKR model consistently provided lower Young’s moduli relative to the Hertzian contact model for pS particles. [20] For our studies, the JKR model was preferred over the Hertzian contact model due to the observation of adhesive forces, which ranged from ca. 2 – 4 nN, between the AFM tip and pS-co-NIPAM particles. Thus, for our pS-co-NIPAM nanoindentation results, the use of JKR may also contribute to the differences observed between the BLS and AFM results.
For pNIPAM, the crosslinking density is not homogeneously distributed within the microgel interior but rather at high BIS incorporation, a densely crosslinked core is displayed and the particle density decays radially toward the particle surface. [14, 15] For pNIPAM-A (7 mol% BIS), the average Young’s modulus was determined to be 201 ± 10 MPa from sampling 30 individual particles. This result is consistent with a previous nanoindentation result reported by Tagit et al. for air-dried pNIPAM (6.8 mol% BIS crosslinking) with E = 125.9 ± 0.9 MPa. [8] However, their pNIPAM microgel dimensions were 142 ± 18 nm : 581 ± 59 nm (height : width, respectively) and thus larger than our microgel particles which were 85 ± 3.6 nm : 370 ± 31 nm. Apart from experimental differences between the two AFM measurements, we would expect a greater influence from the densely crosslinked core on our Young’s moduli for the smaller pNIPAM microgels.
The mechanical characterization provided by either BLS or AFM is clearly sensitive to the microgel architecture and the distribution of crosslinking. Nanoindentation would specifically be influenced by surface crosslinking introduced through our KPS-initiated polymerization. Alternatively, since BLS samples whole-particle vibrations, we expect from rubber elasticity theory that any increase in the crosslinking density, i.e. whether distributed near the surface (KPS) or near the core (BIS), would yield an increase to the microgel stiffness. With respect to pS-co-NIPAM, the particle core is enriched with pS leaving a shell of predominantly cross-linked pNIPAM. [14] Within this pNIPAM-enriched shell, at BIS crosslinking less than 1 mol% we expect an inverted microgel structure, with higher crosslinks at the particle surface, consistent with the microgel structures reported by Virtanen et al. for low BIS (mol% < 2.0%) incorporation and guides the interpretation of our nanoindentation results. [15]
With no BIS crosslinking, the Young’s modulus for pS-co-NIPAM-1 (E = 240 MPa) necessarily stems from surface crosslinks. The influence of a stiff, pS enriched core may further contribute to the Young’s modulus for pS-co-NIPAM-1; however, at tip penetration depths maximally near 6 nm, this contribution is expected to be minor. For pS-co-NIPAM-2, the introduction of 1 mol% BIS crosslinking leads to an approximately balanced distribution of both KPS-induced and BIS crosslinks across the pNIPAM-enriched shell and consequently E increases by approximately a factor of two because the number of effective crosslinks has doubled within a region accessible to nanoindentation. However, upon further BIS crosslinking, the density gradient shifts its maximum from the particle surface toward the particle interior, and consequently a relatively minor increase (ca. 13%) in E is observed for pS-co-NIPAM-3. In contrast, as demonstrated from BLS, the largest increases in E are accompanied by increased BIS crosslinking and this further supports the inverted-to-fuzzy transition of the microgel interior at higher BIS crosslinking.
This model is further consistent with our nanoindentation results for pS-co-NIPAM-4 and -5. At low BIS crosslinking, but higher NIPAM incorporation (pS-co-NIPAM-4), a higher, crosslinked polymer fraction (higher density) near the particle surface leads to a 50% increase in E relative to pS-co-NIPAM-3. However, upon further BIS incorporation, crosslinking within the microgel interior increases toward the core and only a modest, 8.7% increase in E is observed for pS-co-NIPAM-5.
3.6 Swelling curves for pS-co-NIPAM
Particle mechanics are central to understanding the swelling behavior of stimuli-responsive, smart materials. The effect of crosslinking density on the temperature dependent swelling of pNIPAM microgel particles has shown that with an increase in crosslinking density the relative swelling decreases. [53] As demonstrated by Hellweg et al. the swelling behavior for pS-co-NIPAM (at a constant BIS cross-linker molar ratio of 3.1%) is significantly modified with increasing incorporation of styrene. [14] At 75 mol% styrene, a volume phase transition is no longer observed and the copolymer particles behave similarly to pure pS. Moreover, the breadth of the transition temperature window was increased with styrene addition. To explore the influence of crosslinking on the swelling behavior of pS-co-NIPAM, we measured the temperature-dependent size of pS-co-NIPAM particles from 10 °C to 60 °C. For pS-co-NIPAM-1, -2 and -3, no volume phase transition was observed. For pS-co-NIPAM-4 and -5, a volume phase transition was observed and the swelling curves are shown in Figure 10.
Figure 10.
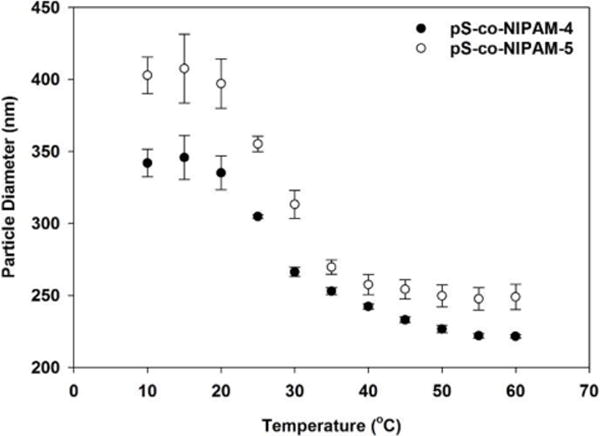
Swelling curves for pS-co-NIPAM-4 and pS-co-NIPAM-5 determined by DLS over the temperature range of 10 – 60 °C. Error bars represent standard deviation in particle size from three separate measurements.
As shown in Table III for pNIPAM-A and pNIPAM-B, the expected increase in swelling with decreasing BIS incorporation is observed. However, for pS-co-NIPAM-4 and -5, increasing the BIS crosslinking density resulted in a minor, yet unexpected, increase to the swelling ratio. The minor increase in swelling for pS-co-NIPAM-5, despite its higher crosslinking density, is supported by the mechanical data provided from AFM and BLS. For pS-co-NIPAM-4, the increasing number of surface crosslinks, which is supported by the large increase in E, acts to constrain particle swelling; however, for pS-co-NIPAM-5, even though the BIS crosslinking is increased, the density gradient at the particle surface is reduced and thus swelling may increase, but in a limited fashion because the overall tendency of increased crosslinking to oppose swelling.
4. CONCLUSIONS
A complete set of mechanical properties for air-dried pS-co-NIPAM microgels was determined using complementary techniques: BLS and AFM nanoindentation. Each of these techniques sample the material in distinctly different ways and for our initial comparative evaluation of pS particles mechanics, the two techniques convey markedly separate interpretations of size-dependent particle mechanics at sub-micron dimensions. While the AFM study reveals particle stiffening below 200 nm for pS, our results suggest the particle mechanics are independent of size, at least over the particle diameter range of 96 – 483 nm.
For our pS-co-NIPAM microgel series, each system exhibited excellent monodispersity with typical particle diameters of approximately 200 nm. BLS particle spectra demonstrated at least three unique resonances, which upon assignment to specific spheroidal modes, were used to determine all elastic moduli. Increasing the BIS crosslinking density expectedly increased the Young’s modulus of both the 50:50 and 75:25 microgel compositions. Moreover, the shear modulus increased approximately linearly with respect to increasing BIS mol%, while the Poisson’s ratio decreased with increasing BIS and/or NIPAM mol% and the bulk modulus was insensitive to variation in microgel composition.
Young’s moduli determined by AFM nanoindentation supported the rank-order in E determined by BLS; however, the interpretation of increasing stiffness depends distinctly upon the type and distribution of microgel crosslinks. BLS particle spectroscopy is sensitive to the overall crosslinking despite its non-symmetric distribution throughout the microgel interior. Alternatively, the surface mechanics provided from nanoindentation is consistent with an inverted microgel, which possesses higher crosslinking, introduced by KPS, at the particle surface. As the BIS crosslinking increases, the particle density gradient shifts toward the particle interior resulting in a relatively minor increase in E from AFM, but a more pronounced change in E as determined by BLS.
A minor increase in the swelling ratio was observed with increasing BIS for pS-co-NIPAM-4 and -5, a trend not observed for pure pNIPAM crosslinked with BIS. This increased swelling for pS-co-NIPAM-5 results from the shifting density gradient away from the surface toward the particle interior and is consistent with our mechanical data. Therefore, to expand upon the Flory-Rehner model of particle swelling, which assumes a homogeneous distribution of crosslinks, detailing how local structure of the microgel interior affects both its mechanical properties and swelling behavior is critically important. Overall, this complementary approach offers new insight into microgel mechanics necessary for next-generation design and application of responsive materials.
Supplementary Material
Acknowledgments
Research reported in this publication was supported by the National Institute of Biomedical Imaging and Bioengineering of the National Institutes of Health under award number R21EB021035 to L.L.S. The content is solely the responsibility of the authors and does not necessarily represent the official views of the National Institutes of Health. Furthermore, this work utilized the Hitachi S-4800 Scanning Electron Microscope in the University of Iowa Central Microscopy Research Facilities that was purchased with funding from the NIH SIG grant S10 RR022498.
References
- 1.Morachis JM, Mahmoud EA, Almutairi A. Pharmacol Rev. 2012;64:505–519. doi: 10.1124/pr.111.005363. [DOI] [PMC free article] [PubMed] [Google Scholar]
- 2.Banquy X, Suarez F, Argaw A, Rabanel JM, Grutter P, Bouchard JF, Hildgen P, Giasson S. Soft Matter. 2009;5:3984–3991. [Google Scholar]
- 3.Liu W, Zhou X, Mao Z, Yu D, Wang B, Gao C. Soft Matter. 2012;8:9235–9245. [Google Scholar]
- 4.Zhang L, Cao Z, Li Y, Ella-Menye JR, Bai T, Jiang S. ACS Nano. 2012;6:6681–6686. doi: 10.1021/nn301159a. [DOI] [PubMed] [Google Scholar]
- 5.Anselmo AC, Zhang M, Kumar S, Vogus DR, Menegatti S, Helgeson ME, Mitragotri S. ACS Nano. 2015;9:3169–3177. doi: 10.1021/acsnano.5b00147. [DOI] [PubMed] [Google Scholar]
- 6.Xia LW, Xie R, Ju XJ, Wang W, Chen Q, Chu LY. Nat Commun. 2013;4(2226):1–11. doi: 10.1038/ncomms3226. [DOI] [PMC free article] [PubMed] [Google Scholar]
- 7.Klouda L, Mikos AG. Eur J Pharm Biopharm. 2008;68:34–45. doi: 10.1016/j.ejpb.2007.02.025. [DOI] [PMC free article] [PubMed] [Google Scholar]
- 8.Tagit O, Tomczak N, Julius Vansco G. Small. 2008;4:119–126. doi: 10.1002/smll.200700260. [DOI] [PubMed] [Google Scholar]
- 9.Schmidt S, Zeiser M, Hellweg T, Duschl C, Fery A, Mohwald H. Adv Func Mater. 2010;20:3235–3243. [Google Scholar]
- 10.Hashmi S, Dufresne E. Soft Matter. 2009;5:3682–3688. [Google Scholar]
- 11.Klieber C, Hecksher T, Pezeril T, Torchinsky DH, Dyre JC, Nelson KA. J Chem Phys. 2013;138:12A544. doi: 10.1063/1.4789948. [DOI] [PubMed] [Google Scholar]
- 12.Palombo F, Winlove CP, Edginton RS, Green E, Stone N, Caponi S, Madami M, Fioretta D. J R Soc Interface. 2014;11:20140739. doi: 10.1098/rsif.2014.0739. [DOI] [PMC free article] [PubMed] [Google Scholar]
- 13.Scarcelli G, Polacheck WJ, Nia HT, Patel K, Grodzinsky AJ, Kamm RD, Yun SH. Nat Methods. 2015;12:1132–1134. doi: 10.1038/nmeth.3616. [DOI] [PMC free article] [PubMed] [Google Scholar]
- 14.Hellweg T, Dewhurst CD, Eimer W, Kratz K. Langmuir. 2004;20:4330–4335. doi: 10.1021/la0354786. [DOI] [PubMed] [Google Scholar]
- 15.Vitranen OLJ, Mourran A, Pinard PT, Richtering W. Soft Matter. 2016;12:3919–3928. doi: 10.1039/c6sm00140h. [DOI] [PubMed] [Google Scholar]
- 16.Wei G, Shouwen Y, Ganyun H. Nanotechnology. 2006;17:1118–1122. doi: 10.1088/0957-4484/17/4/045. [DOI] [PubMed] [Google Scholar]
- 17.Liang L, Ma H, Wei Y. J Nanomater. 2011:670857. [Google Scholar]
- 18.Yu Q, Qi L, Mishra RK, Zeng X, Minor AM. Appl Phys Lett. 2015;106:261903. [Google Scholar]
- 19.Dingreville R, Qu J, Cherkaoui M. J Mech Phys Solids. 2005;53:1827–1854. [Google Scholar]
- 20.Guo D, Li J, Xie G, Wang Y, Luo J. Langmuir. 2014;30:7206–7212. doi: 10.1021/la501485e. [DOI] [PubMed] [Google Scholar]
- 21.McGrath JG, Bock RD, Cathcart JM, Lyon LA. Chem Mater. 2007;19:1584–1591. [Google Scholar]
- 22.Hutter JL, Bechhoefer J. Rev Sci Instrum. 1993;64:1868–1873. [Google Scholar]
- 23.Johnson KL, Kendall K, Roberts AD. P Roy Soc Lond A Mat. 1971;324:301–313. [Google Scholar]
- 24.Kuok MH, Lim HS, Ng SC, Liu NN, Wang ZK. Phys Rev Lett. 2003;90:255502. doi: 10.1103/PhysRevLett.90.255502. [DOI] [PubMed] [Google Scholar]
- 25.Faatz M, Cheng W, Wegner G. Langmuir. 2005;21:6666–6668. doi: 10.1021/la050604m. [DOI] [PubMed] [Google Scholar]
- 26.Cheng W, Wang JJ, Jonas U, Steffen W, Fytas G, Penciu R, Economou EN. J Chem Phys. 2005;123:121104. doi: 10.1063/1.2046607. [DOI] [PubMed] [Google Scholar]
- 27.Li Y, Lim HS, Ng SC, Wang ZK, Kuok MH. Chem Phys Lett. 2008;461:111–113. [Google Scholar]
- 28.Lamb H. Proc London Math Soc. 1882;13:189–212. [Google Scholar]
- 29.Patton KR, Geller MR. Phys Rev B. 2003;67:155418. [Google Scholar]
- 30.Huarng LD, Chen P. Jour Agric Res China. 1994;43:439–452. [Google Scholar]
- 31.Tamura A, Higeta K, Ichinokawa T. J Phys C: Solid State Phys. 1982;15:4975–4991. [Google Scholar]
- 32.Cummins HZ, Schoen PE. Laser Handbook. Amsterdam, North Holland Publishing Co.; Amsterdam: 1971. p. E1. [Google Scholar]
- 33.Newnham R. Properties of Materials. Oxford University Press; New York: 2005. [Google Scholar]
- 34.Still T, Mattarelli M, Kiefer D, Fytas G, Montagna M. J Phys Chem Lett. 2010;1:2440–2444. [Google Scholar]
- 35.Mattarelli M, Montagna M, Still T, Schneider D, Fytas G. Soft Matter. 2012;8:4235–4243. [Google Scholar]
- 36.Mattarelli M, Montagna M. Chem Phys Lett. 2012;524:112–115. [Google Scholar]
- 37.Still T, Cheng W, Retsch M, Jonas U, Fytas G. J Phys: Condens Matter. 2008;20:404203. [Google Scholar]
- 38.Patterson GD. J Polym Sci. 1976;14:741–748. [Google Scholar]
- 39.Still T, Retsch M, Jonas U, Sainidou R, Rembert P, Mpoukouvalas K, Fytas G. Macromolecules. 2010;43:3422–3428. [Google Scholar]
- 40.Bicerano J. Prediction of Polymer Properties. Marcel Dekker, Inc.; New York: 2009. [Google Scholar]
- 41.Zhou S, Wu C. Macromolecules. 1996;29:4998–5001. [Google Scholar]
- 42.Miles REH, Rudic S, Orr-Ewing AJ, Reid JP. J Phys Chem A. 2010;114:7077–7084. doi: 10.1021/jp103246t. [DOI] [PubMed] [Google Scholar]
- 43.Krüger JK, Marx A, Peetz L, Roberts R, Unruh HG. Colloid Polym Sci. 1986;264:403–414. [Google Scholar]
- 44.Hosea TJC, Ng SC. Chem Phys. 1986;103:345–352. [Google Scholar]
- 45.Vanderwal J, Sidebottom D, Walton D, Johari GP. J Polym Sci B Polym Phys. 1992;30:1089–1095. [Google Scholar]
- 46.Montagna M. Phys Rev B. 2008;77:045418. [Google Scholar]
- 47.Schneider D, Beltramo PJ, Mattarelli M, Pfleiderer P, Vermant J, Crespy D, Montagna M, Furst EM, Fytas G. Soft Matter. 2013;9:9129–9136. [Google Scholar]
- 48.Karunatilaka C, Bucar DK, Ditzler LR, Friscic T, Swenson DC, MacGillivray LR, Tivanski AV. Angew Chem Int Edit. 2011;50:8642–8646. doi: 10.1002/anie.201102370. [DOI] [PubMed] [Google Scholar]
- 49.Morris HS, Estillore AD, Laskina O, Grassian VH, Tivanski AV. Anal Chem. 2016;88:3647–3654. doi: 10.1021/acs.analchem.5b04349. [DOI] [PubMed] [Google Scholar]
- 50.Rupasinghe TP, Hutchins KM, Bandaranayake BS, Ghorai S, Karunatilake C, Bucar DK, Swenson DC, Arnold MA, MacGillivray LR, Tivanski AV. J Am Chem Soc. 2015;137:12768–12771. doi: 10.1021/jacs.5b07873. [DOI] [PubMed] [Google Scholar]
- 51.Scarcelli G, Kim P, Yun SH. Biophys J. 2011;101:1539–1545. doi: 10.1016/j.bpj.2011.08.008. [DOI] [PMC free article] [PubMed] [Google Scholar]
- 52.Antonacci G. Brillouin Scattering Microscopy for Mechanical Imaging. London: Imperial College; 2015. [Google Scholar]
- 53.Varga I, Gilanyi T, Meszaros R, Filipcsei G, Zrinyi M. J Phys Chem B. 2001;105:9071–9076. [Google Scholar]
Associated Data
This section collects any data citations, data availability statements, or supplementary materials included in this article.


