To the editor
Eosinophilic esophagitis (EoE) presents with diverse features which can differ between children and adults, as well as among adults, but eosinophils alone do not account for this heterogeneity.(1, 2) Mast cells are involved in EoE pathogenesis, are highly increased in EoE compared to non-EoE controls, and mast cell-associated genes are upregulated in EoE.(2–5) Mast cells also produce the profibrotic factor TGF-β1 and promote smooth muscle contraction.(6) However, the extent to which mast cell presence correlates with clinical features of EoE is unknown. We aimed to determine if esophageal mast cell levels correlated with clinical symptoms, endoscopic findings, and histologic features in newly diagnosed adults with EoE.
We performed a secondary analysis of data and biospecimens collected during a prospective cohort study of EoE cases, details of which have been previously described.(7) The parent study included adults (>18) undergoing outpatient endoscopy for symptoms of esophageal dysfunction. EoE was diagnosed by consensus guidelines.(8) This study was approved by the UNC Institutional Review Board. No authors have conflicts related to this study.
Data collection, biopsy procurement, symptom measures, full immunohistochemistry details, and statistical analyses are outlined in the Supplemental Materials. In brief, we used a mast cell tryptase antibody (#M7052, DAKO/Agilent, Santa Clara, CA) at 1:3000 dilution as previously described.(4, 5) Glass slides were digitized and the maximum density of tryptase-positive cells were quantified (cells/mm2) in five non-overlapping high power fields of esophageal epithelium using the Aperio Positive Pixel Count Algorithm, version 9.1 (Aperio Technologies). For analysis, levels of mast cells were compared for EoE patients across demographic, endoscopic, and histologic characteristics, as well as for fibrostenotic vs inflammatory phenotypes. We also analyzed the mast cell to eosinophil ratio (a ratio >1 indicates more mast cells than eosinophils). For positive associations, we used linear regression to assess whether associations persisted after controlling for the eosinophil count.
We analyzed 96 EoE cases. Compared to patients with the lowest quartile of mast cells, patients with the highest quartile had significantly more furrows, higher eosinophil counts, and more eosinophil degranulation (Table 1). Notably, these findings persisted after regression analysis controlling for eosinophil counts. However, most of the clinical, endoscopic, and histologic features were similar regardless of mast cell quartile.
Table 1. Patient Characteristic, and characteristics stratified by the highest and lowest mast cell quartile, and by mast cell to eosinophil ratios ≤1 and >1.
| Characteristic | Overall EoE population n=96) |
Lowest mast cell quartile (n=24) | Highest mast cell quartile
(n=24) |
p | Mast cell to eos ratio ≤ 1 (n=72) | Mast cell to eos ratio > 1
(n=24) |
p |
|---|---|---|---|---|---|---|---|
| Mast cell density (mean cells/mm2 ± SD) |
266.8 ± 180.0 | 88.7 ± 32.6 | 515.3 ± 157.4 | -- | 235.1 ± 142.2 | 361.6 ± 242.6 | 0.002 |
| Eosinophil density (eos/mm2; mean ± SD) |
555.9 ± 478.1 | 304.2 ± 212.0 | 717.5 ± 501.1 | < 0.001 | 664.6 ± 498.8 | 229.8 ± 168.8 | < 0.001 |
| Age at diagnosis (mean ± SD) | 37.2 ± 12.7 | 38.0 ± 14.2 | 38.4 ± 13.6 | 0.91 | 37.1 ± 12.6 | 37.6 ± 13.2 | 0.88 |
| Male (n, %) | 54 (56) | 10 (42) | 15 (63) | 0.15 | 38 (53) | 16 (67) | 0.24 |
| White (n, %) | 91 (95) | 23 (96) | 24 (100) | 0.31 | 68 (94) | 23 (96) | 0.79 |
| Symptoms | |||||||
| Dysphagia (n, %) | 94 (98) | 24 (100) | 23 (96) | 0.31 | 71 (99) | 23 (96) | 0.41 |
| >5 yrs of dysphagia (n, %) | 53 (60) | 13 (56) | 12 (55) | 0.51 | 37 (57) | 16 (70) | 0.67 |
| VAS* score (mean ± SD | 3.5 ± 2.7 | 2.4 ± 1.9 | 3.6 ± 2.8 | 0.12 | 3.5 ± 2.6 | 3.5 ± 3.0 | 0.97 |
| Heartburn (n, %) | 8 (8) | 1 (4) | 2 (8) | 0.55 | 7 (10) | 1 (4) | 0.39 |
| GERD-Q† (mean ± SD) | 4.7 ± 6.3 | 2.6 ± 3.9 | 4.5 ± 5.6 | 0.19 | 4.2 ± 6.3 | 6.2 ± 6.3 | 0.21 |
| Abdominal pain (n, %) | 7 (7) | 0 (0) | 1 (4) | 0.31 | 5 (7) | 2 (8) | 0.82 |
| SODA‡ score (mean ± SD) | 42.8 ± 12.5 | 39.1 ± 11.7 | 42.3 ± 12.8 | 0.51 | 43.3 ± 12.1 | 41.1 ± 13.9 | 0.58 |
| Nausea/Vomiting (n, %) | 0 (0) | 0 (0) | 0 (0) | -- | 0 (0) | 0 (0) | -- |
| Any atopic disorder (n, %) | 69 (72) | 11 (46) | 16 (67) | 0.31 | 44 (61) | 15 (63) | 0.65 |
| Asthma | 30 (32) | 6 (25) | 8 (33) | 0.46 | 23 (32) | 7 (29) | 0.86 |
| Atopic dermatitis | 10 (11) | 2 (8) | 2 (8) | 0.93 | 6 (8) | 4 (17) | 0.24 |
| Allergic rhinitis/sinusitis | 62 (66) | 16 (67) | 14 (58) | 0.68 | 47 (65) | 15 (63) | 0.93 |
| Food allergies | 35 (37) | 7 (29) | 9 (38) | 0.41 | 26 (36) | 9 (38) | 0.84 |
| EGD findings (n, %) | |||||||
| Normal | 3 (3) | 1 (4) | 0 (0) | 0.31 | 2 (3) | 1 (4) | 0.74 |
| Rings | 84 (88) | 19 (79) | 22 (92) | 0.22 | 62 (86) | 22 (92) | 0.48 |
| Strictures | 37 (39) | 11 (46) | 6 (25) | 0.13 | 30 (42) | 7 (29) | 0.28 |
| Narrowing | 36 (38) | 7 (29) | 8 (33) | 0.76 | 29 (40) | 7 (29) | 0.33 |
| Crepe paper mucosa | 7 (7) | 1 (4) | 2 (8) | 0.55 | 7 (10) | 0 (0) | 0.11 |
| Furrows | 87 (91) | 20 (83) | 24 (100) | 0.04 | 66 (92) | 21 (88) | 0.54 |
| White plaques/exudates | 53 (55) | 11 (46) | 17 (71) | 0.08 | 45 (63) | 8 (33) | 0.01 |
| Edema/decreased vascularity | 51 (53) | 9 (38) | 14 (58) | 0.15 | 42 (58) | 9 (38) | 0.08 |
| Hiatal hernia | 12 (13) | 2 (8) | 0 (0) | 0.15 | 10 (14) | 2 (8) | 0.48 |
| Dilation performed | 34 (35) | 9 (38) | 6 (25) | 0.35 | 27 (38) | 7 (29) | 0.46 |
| Other histologic findings (n, %)# | |||||||
| Eosinophil degranulation | 86 (96) | 16 (84) | 24 (100) | 0.04 | 67 (99) | 19 (86) | 0.02 |
| Eosinophil microabscesses | 67 (74) | 13 (68) | 20 (83) | 0.25 | 59 (87) | 8 (36) | < 0.001 |
| Basal layer hyperplasia | 42 (49) | 7 (41) | 13 (54) | 0.41 | 36 (55) | 6 (29) | 0.03 |
| Spongiosis | 80 (89) | 14 (74) | 22 (92) | 0.11 | 61 (90) | 19 (86) | 0.67 |
| Lamina propria fibrosis | 22 (37) | 5 (36) | 5 (29) | 0.71 | 18 (43) | 4 (24) | 0.16 |
* VAS = visual analogue scale for dysphagia severity; data available for n = 79 overall, 42 in the quartile analysis, and 79 in the ratio analysis
† GERD-Q = Gastroesophageal reflux disease questionnaire; data available for 86 overall, 44 in the quartile analysis, and 86 in the ratio analysis
‡ Severity of Dyspepsia Assessment; data available for n = 54 overall, 27 in the quartile analysis, and 54 in the ratio analysis
# Data available for n = 90 overall, 43 in the quartile analysis, and 90 in the ratio analysis
There was not a significant association between mast cells and clinical symptoms or atopic conditions (Figure 1A). Endoscopically, the mean level of mast cells was significantly increased in patients with the finding of furrows (279.9 ± 182.9 vs 139.6 ± 69.7; p=0.03), and there were weak trends towards an increase in patients with rings and exudates (Figure 1B). There was not as assocation between mast cell levels and the fibrostenotic or inflammatory phenotype. Histologically, eosinophil degranulation and spongiosis were weakly associated with mast cell density (Figure 1C). Eosinophil density was weakly correlated with mast cell infiltration (R=0.21, p=0.04) (Supplemental Figure 1). There was poor correlation between symptom severity and mast cells (Supplemental Figures 2A-C).
Figure 1.
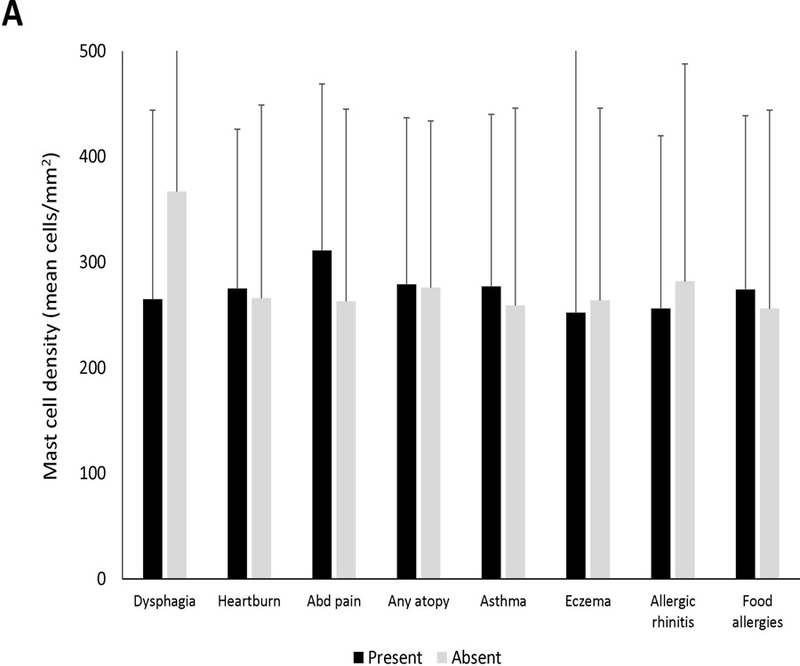
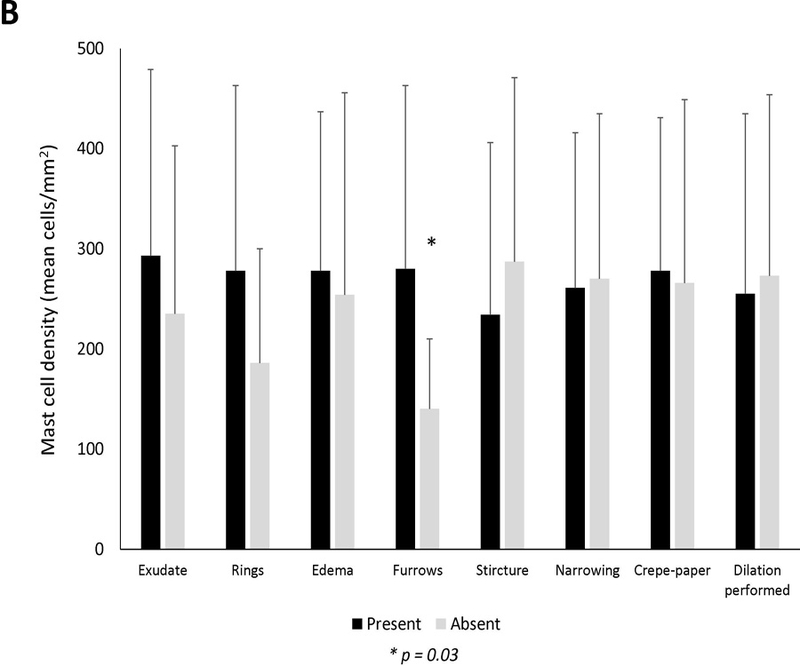
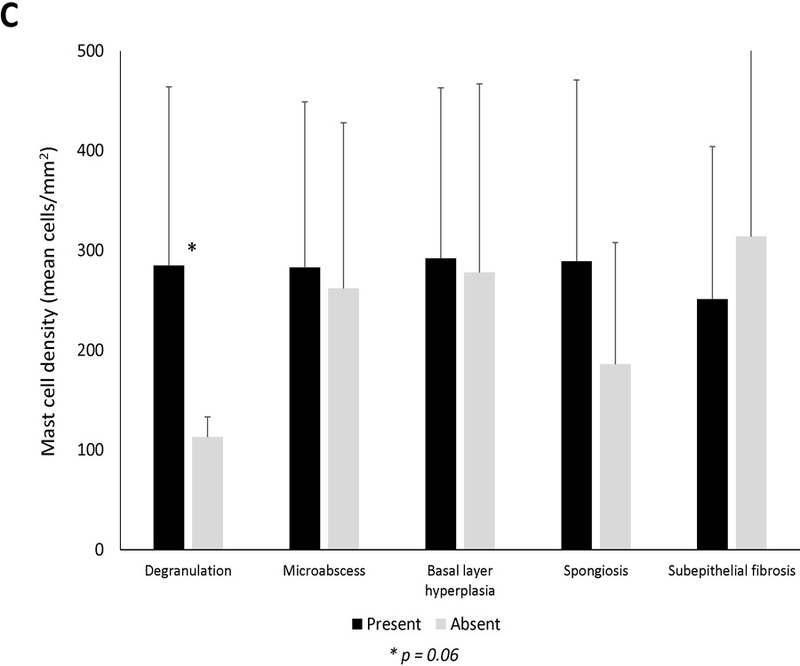
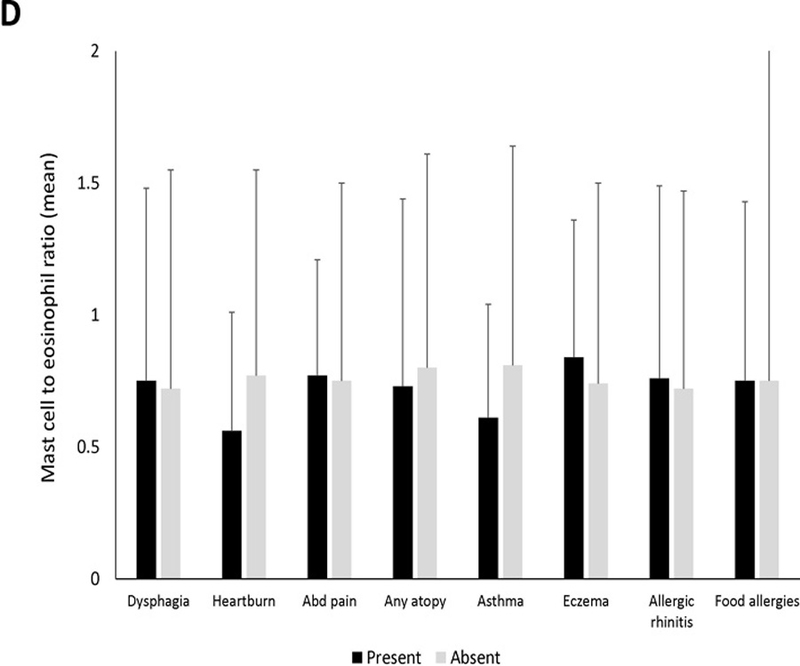
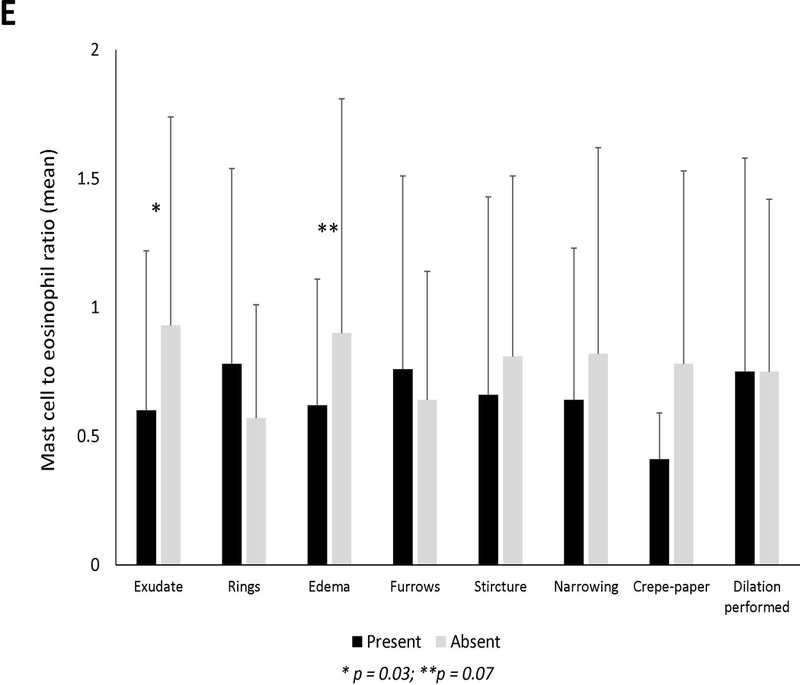
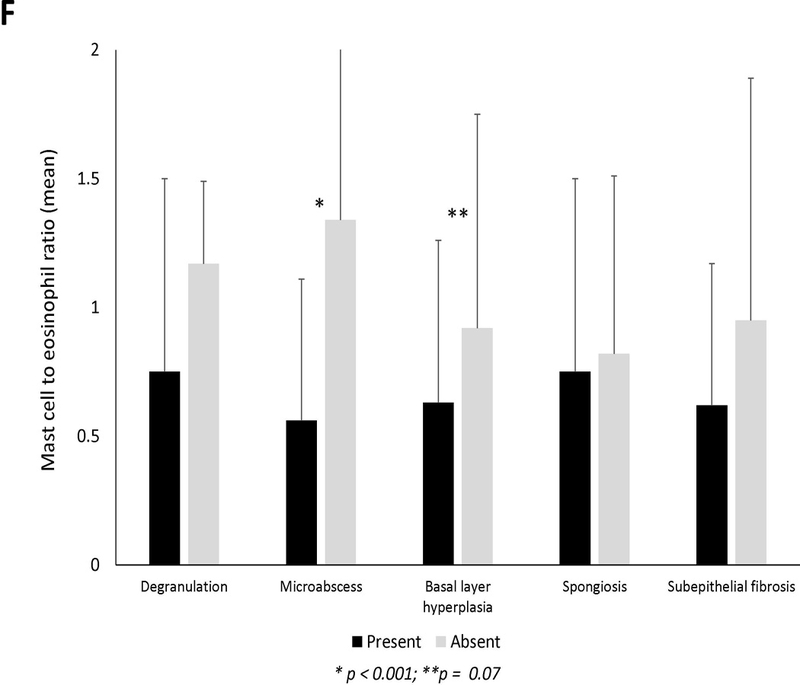
Mean mast cell density in association with (A) clinical findings (B) endoscopic findings and (C) histologic findings of EoE. Black bars indicate the presence of the findings and gray bars indicated absence of the findings. Mean mast cell to eosinophil ratio in association with (D) clinical findings (E) endoscopic findings and (F) histologic findings of EoE. Black bars indicate the presence of the findings and gray bars indicated absence of the findings.
Twenty-four subjects (25%) had a mast cell to eosinophil ratio >1 (Table 1). These cases had significantly fewer exudates, eosinophil degranulation, microabscesses, and basal layer hyperplasia compared to those with ratio of ≤1. Mast cell to eosinophil ratio weakly correlated with reflux (R=0.23, p=0.03) but not with dysphagia or abdominal pain (Supplemental Figures 2D-F). There were no associations between mast cell to eosinophil ratio and clinical features (Figure 1D). On endoscopy, EoE cases with exudates had a significantly lower ratio than cases without exudates (Figure 1E). Mast cell to eosinophil ratios were significantly lower in patients with microabscesses (Figure 1F).
Several findings from our study were notable. First, we found that elevated levels of mast cells were associated with esophageal furrows and eosinophil degranulation independent of eosinophil counts. While little is known about the development of furrows in EoE, the same association between mast cells and furrows has been preliminarily reported in a pediatric EoE cohort.(9) Furrows may represent areas of increased mucosal swelling, and mast cells could contribute by enhancing tissue contraction or edema.
Second, there was poor correlation between the degree of esophageal epithelial mast cell infiltration and dysphagia, heartburn, or abdominal pain symptom severity. One possible explanation could be that mast cell infiltration of deeper layers of the esophageal wall is more important to pathogenesis, and therefore would not been seen on our epithelial analysis.
Third, approximately a quarter of EoE cases who had higher levels of mast cells than eosinophils (mast cell to eosinophil ratio >1). Interestingly, this group did not have more allergic disease, but had fewer exudates endoscopically and microabscesses histologically. This novel metric may suggest a subset of EoE patients with a less severe phenotype in which mast cell directed therapies may be useful, but this is speculative and the hypothesis must be tested.
There are several limitations to note. We performed a secondary analysis of baseline samples from adult EoE patients, so further investigation in a primary study with correction for multiple testing is needed to confirm findings, evaluate children or post-treatment changes, though prior work shows mast cells decrease in EoE after successful treatment.(5) Differences in mast cell subtypes could not be distinguished with tryptase staining alone. We did not analyze extracellular tryptase or histamine deposition, were not able to assess cell-surface markers (KIT or IgE receptor) for information on mast cell activation, and our analysis was limited to the esophageal epithelium. However, the strengths of this study include: utilization of prospectively collected data and biospecimens linked to well characterized clinical, endoscopic, and histologic data; use of an autostainer and image analysis software to provide consistence in samples; and use of quantitative symptom scores.
In conclusion, the presence of furrows was significantly correlated with higher mast cell levels in patients with EoE. Despite this interesting finding, mast cell density did not seem to directly correlate with clinical symptoms or most endoscopic or histologic findings in patients with EoE. However, our study clearly identifies a subset of EoE cases with more mast cells than eosinophils, with differences in endoscopic and histologic features, potentially suggesting a role for mast cell directed therapies.
Supplementary Material
Acknowledgments
Financial support: Funded in part by T35 DK007386 (MT), K23DK090073 (ESD), and used resources from the UNC Center for GI Biology and Disease (P30DK34987) and the UNC Translational Core Laboratory (TPL) which is supported, in part, by grants from the National Cancer Institute (P30-CA016086), NIEHS (P30ES010126), and NCBT (2015-IDG-1007)
Potential competing interests: No authors have conflicts related to this study. Dr. Dellon has received research funding from Adare, Meritage, Miraca, Nutricia, Celgene/Receptos, Regeneron, and Shire; is a consultant for Adare, Alivio, Allakos, AstraZeneca, Banner, Enumeral, Celgene/Receptos, GSK, Regeneron, Robarts, and Shire; and has received an educational grant from Banner and Holoclara. The other authors have no pertinent disclosures to report.
Footnotes
Guarantor of the article: Evan Dellon
Specific author contributions (note that all authors approved the final draft and the authorship list):
Tappata: data acquisition/analysis/interpretation; drafting of the article; critical revision
Eluri: data analysis/interpretation; critical revision
Perjar: data acquisition (pathology review); critical revision
Hollyfield: data acquisition (pathology review); critical revision
Betancourt: data acquisition (pathology review); critical revision
Randall: data acquisition (pathology review); critical revision
Woosley: pathology supervision; eosinophil count review; critical revision
Wechsler: data interpretation; critical revision
Dellon: project conception/design; data acquisition/analysis/interpretation; drafting of the article; critical revision
References
- 1.Safroneeva E, Straumann A, Coslovsky M, Zwahlen M, Kuehni CE, Panczak R, et al. Symptoms Have Modest Accuracy in Detecting Endoscopic and Histologic Remission in Adults With Eosinophilic Esophagitis. Gastroenterology 2016;150(3):581–590 e4. [DOI] [PMC free article] [PubMed] [Google Scholar]
- 2.Dellon ES. The pathogenesis of eosinophilic esophagitis: beyond the eosinophil. Dig Dis Sci 2013;58(6):1445–8. [DOI] [PMC free article] [PubMed] [Google Scholar]
- 3.Abonia JP, Blanchard C, Butz BB, Rainey HF, Collins MH, Stringer K, et al. Involvement of mast cells in eosinophilic esophagitis. J Allergy Clin Immunol 2010;126:140–9. [DOI] [PMC free article] [PubMed] [Google Scholar]
- 4.Dellon ES, Chen X, Miller CR, Fritchie KJ, Rubinas TC, Woosley JT, et al. Tryptase staining of mast cells may differentiate eosinophilic esophagitis from gastroesophageal reflux disease. Am J Gastroenterol 2011;106:264–71. [DOI] [PMC free article] [PubMed] [Google Scholar]
- 5.Dellon ES, Speck O, Woodward K, Covey S, Rusin S, Gebhart JH, et al. Markers of Eosinophilic Inflammation for Diagnosis of Eosinophilic Esophagitis and Proton Pump Inhibitor-Responsive Esophageal Eosinophilia: A Prospective Study. Clin Gastroenterol Hepatol 2014;12:2015–22. [DOI] [PMC free article] [PubMed] [Google Scholar]
- 6.Aceves SS, Chen D, Newbury RO, Dohil R, Bastian JF, Broide DH. Mast cells infiltrate the esophageal smooth muscle in patients with eosinophilic esophagitis, express TGF-beta1, and increase esophageal smooth muscle contraction. J Allergy Clin Immunol 2010;126(6):1198–204 e4. [DOI] [PubMed] [Google Scholar]
- 7.Dellon ES, Rusin S, Gebhart JH, Covey S, Speck O, Woodward K, et al. A clinical prediction tool identifies cases of eosinophilic esophagitis without endoscopic biopsy: A prospective study. Am J Gastroenterol 2015;110:1347–54. [DOI] [PMC free article] [PubMed] [Google Scholar]
- 8.Liacouras CA, Furuta GT, Hirano I, Atkins D, Attwood SE, Bonis PA, et al. Eosinophilic esophagitis: Updated consensus recommendations for children and adults. J Allergy Clin Immunol 2011;128:3–20.e6. [DOI] [PubMed] [Google Scholar]
- 9.Bolton SM, Kagalwalla AF, Arva NC, Wang MY, Amsden K, Melin-Aldana H, et al. Mast Cell Density is Increased in Children with Eosinophilic Esophagitis who have Persistent Symptoms, Endoscopic Findings, or Epithelial Abnormalities Despite Low Eosinophil Counts After Treatment. Gastroenterology 2018, abstract in press. [Google Scholar]
Associated Data
This section collects any data citations, data availability statements, or supplementary materials included in this article.


