

Abstract
Immunological abnormalities are increasingly reported in people with schizophrenia, but no clear functional biomarkers associated with genetic correlates of the disease have been found. Regulatory T cells (Tregs) are key immunoregulatory cells involved in the control of inflammatory processes and their functions are directly related to the human leucocyte antigen (HLA) gene, which has been implicated in schizophrenia genetic studies. However, there is a lack of studies reporting Treg status in people with schizophrenia. In the current study, the proportion of circulating Tregs was examined using flow cytometry in 26 medicated participants with schizophrenia and 17 healthy controls. Psychiatric symptoms and cognitive function were evaluated using the Scale for the Assessment of Negative Symptoms, the Brief Psychiatric Rating Scale, and the MATRICS Consensus Cognitive Battery. The proportion of Tregs was found to be significantly greater in the schizophrenia group compared to healthy controls. No differences were observed in total lymphocyte counts or CD3+ and CD4 + T cells, confirming a specific effect for Tregs. Elevated Tregs in schizophrenia correlated with fewer negative symptoms, a core domain of the illness. These results suggest that Tregs may contribute to improved negative symptoms in schizophrenia, possibly by counteracting on-going inflammatory processes.
Keywords: MHC locus, blood biomarkers, schizophrenia biomarkers, cognition, lymphocytes, Foxp3, CD4 cells
1. Introduction
Schizophrenia (SZ) is a complex heterogeneous disease with recognized genetic risk factors. Genetic studies have identified more than 100 loci conferring risk for the disease and there is consensus today for a polygenic etiology of SZ (Purcell et al., 2009). Genome wide association studies (GWAS) using large cohorts have strongly implicated polymorphisms in the chromosome 6p21.3–22.1 region as one the most consistent genomic regions associated with the disease (Agartz et al., 2011; Bergen et al., 2012; Stefansson et al., 2009; Zhang et al., 2013). This region corresponds to a highly variable and recombinant portion of the human genome coding for human leucocyte antigen (HLA) proteins, which are also known as major histocompatibility complex (MHC) molecules (Stefansson et al., 2009). Due to their involvement in cellular immune functions, including antigen processing and tolerance, it is believed that the pathophysiology of SZ is related, at least in part, to disrupted immune processes that influence the responses of the immune system and its interaction with the central nervous system, with particular effects during prenatal neurodevelopment (Brown, 2011; Elmer and McAllister, 2012; McAllister, 2014). Indeed, there are an increasing number of studies pointing to an ongoing inflammatory process in SZ characterized by elevated inflammatory markers in peripheral blood (Doorduin et al., 2009; Fineberg and Ellman, 2013; Muller et al., 2012; Saetre et al., 2007).
Cytokines, chemokines and C-reactive protein are among the most commonly studied immune function biomarkers in SZ (Brown et al., 2004; Fatjo-Vilas et al., 2012; Fineberg and Ellman, 2013; Hope et al., 2013; Miller et al., 2013a; Reale et al., 2011). These molecules have gained relevance in clinical research as they may contribute to the underlying pathophysiological processes and genetic underpinnings associated with SZ. Nevertheless, cytokines and chemokines are involved in multiple cellular functions that may or may not be directly linked with MHC function. Thus, immune biomarkers directly related with MHC function may provide a more stable biomarker, as well as provide potential mechanistic insights on specific pathological cellular processes.
In this regard, CD3+ T cells are directly related to MHC function; these cells depend on permanent interactions involving T cell receptor-MHC complexes during development, differentiation and survival of the T cell repertoire (Charles A Janeway, 2001). Thus, CD3+ T cells may constitute a valuable biomarker of the disease in relation to functional variation of the MHC locus. Moreover, increasing evidence from basic rodent studies implicates different types of CD3+ T cells in particular brain functions and behavioral processes (Kipnis et al., 2008; Kipnis et al., 2012), which may provide specific insights about endophenotypes or symptoms of the disease. However, studies reporting on various aspects of CD3 + T cell biology in SZ are relatively uncommon (Craddock et al., 2007; Ding et al., 2014; Drexhage et al., 2011; Fernandez-Egea et al., 2016; Miller et al., 2013b). CD3+ T cells differentiate into two major types, expressing one of two different cell surface markers, CD8 or CD4, which allow specific interactions with either MHC class I or class II respectively. Within the CD4+ type, regulatory T cells (CD4+/CD25+/Foxp3+; Tregs) are an attractive CD3+ T cell subtype for a biomarker in SZ, since they function to provide important immunomodulatory control over other T cell subtypes and inflammatory processes (Arce-Sillas et al., 2016; Miyara et al., 2009; Rodriguez-Perea et al., 2016). The development and functions of these cells are directly related to the expression of the transcription factor Foxp3 and the CD25 cell surface marker within the CD3+/CD4+ T cell subtype (Kitagawa and Sakaguchi, 2017; Mohr et al., 2018). Tregs have broad immune suppressive activity on diverse immune cells, which requires MHC cellular interactions. Therefore, in the present study we compared the proportions of Tregs in healthy controls and stable medicated participants with SZ and examined the relationship between Tregs and negative symptoms and cognitive performance, two core domains of the illness.
2. Methods
2.1. Study participants and data and sample collection
All participants were recruited from the Maryland Psychiatric Research Center, University of Maryland in Catonsville, MD between February and November of 2017. Participants were between 18 and 64 years of age and of either sex and any race. Participants with schizophrenia were required to meet Diagnostic and Statistical Manual (DSM)-5 criteria (American Psychiatric Association, 2013) for schizophrenia or schizoaffective disorder, able to give informed consent and considered clinically stable as defined by use of the same antipsychotic treatment for 30 days prior to the study. Healthy controls were included if they were free of all major psychiatric illness as determined by the Structured Clinical Interview for Diagnosis-5, and able to give informed consent. Exclusion criteria for both participants with schizophrenia and healthy controls included a DSM-5 diagnosis of alcohol or substance misuse disorders currently or in the last 3 months, any current active systemic infection with fever (temperature > 38°C), any long-term untreated chronic infections, pregnancy, and other conditions whose pathology and treatments may alter their immune status. The study was approved by the University of Maryland Institutional Review Board (IRB), reliance was granted to UMB IRB by the Department of Health and Mental Hygiene IRB, and the study was approved by the Spring Grove Hospital Research Committee. Twenty-six participants with schizophrenia and 17 healthy controls met inclusion and exclusion criteria, passed the Evaluation to Sign Consent (ESC), signed informed consent and were enrolled in the study.
2.2. Laboratory assays
All study participants arrived between 7:00–8:00 am under fasting conditions. Participants had their blood drawn for flow cytometry, a complete blood count (CBC) and a Chemistry 14 panel. All processing of blood was completed immediately. Samples were maintained at 2–5°C and processed for flow cytometry within 2 h of collection using a stringent collection and transport protocol. Samples for the CBC and Chemistry 14 were sent to LabCorp (Burlington, NC, USA) for standard processing. In addition to the blood draws, demographic information, height, weight, sex/gender, past medical history, current medications, and blood pressure data were collected on the same day.
2.3. Neuropsychological and psychiatric symptom evaluation
The MATRICS Consensus Cognitive Battery (MCCB) was used to assess neuropsychological test performance. The MCCB is specifically designed to assess cognition in people with schizophrenia. The MCCB is comprised of 10 tests, which assess seven cognitive domains. The MCCB composite score is a standardized mean of the seven domain scores. T-scores are standardized to normative data, and have an estimated mean of 50 and SD of 10 in the general healthy population (Nuechterlein et al., 2008).
The Brief Psychiatric Rating Scale (BPRS) total score was used to measure global psychopathology. The four BPRS positive symptom items - conceptual disorganization, suspiciousness, hallucinatory behavior, and unusual thought content – were used to measure positive psychotic symptoms (Overall JE, 1962). The Scale for the Assessment of Negative Symptoms (SANS) minus the global items, inappropriate affect, poverty of content of speech, and attention items, was used to evaluate negative symptoms (Andreasen, 1982; Buchanan et al., 2007). The Calgary Depression Rating Scale (CDS), which was specifically designed to assess depressive symptoms in people with schizophrenia (Addington et al., 1993) was used to measure depressive symptoms. Finally, the Clinical Global Impression (CGI) severity item was used to assess global illness severity (Guy W, 1976). The MCCB and symptom assessments were conducted immediately after the blood samples were obtained.
2.4. Flow cytometry and T cell analyses
Peripheral blood mononuclear cells (PBMCs) were prepared using Ficoll density gradient separation following manufacture’s guidelines (Ficoll-Paque™ PLUS Media, GE Healthcare™). Briefly, after centrifugation the mononuclear cell layer was washed twice and re-suspended in 1 ml MACS buffer (1X PBS, 2% FBS, 2 mM EDTA). After determining the cell concentration, approximately 1–1.5 × 10⁶ cells were washed twice with PBS and re-suspended in 1 ml PBS buffer and 1 μl viability marker (Fixable Viability Dye eFluor™ 506, eBioscience, Cat#: 65–0866-14). Cells were then incubated at 4°C in the dark for 30 min and washed twice with PBS. Cell surface epitopes for CD3, CD4, CD25, and CD45RA were labeled before fixation. For this, cells were re-suspended in 100 µl PBS buffer containing a combination of fluorescence conjugated anti-human antibodies including: PE-CD3 (BioLegend Catalog #: 317308); FITC-CD4 (BioLegend Catalog #: 357405); PE/Cy7-CD45RA (BioLegend Catalog #: 304126); PerCP-Cy5.5; and CD25-APC (Miltenyi Biotec Inc. Catalog #: 130–098-213). Cells were incubated at 4°C in the dark for 30 to 60 min. After surface staining, the cells were fixed and permeabilized overnight at 4°C, washed again and then labeled for Foxp3 with e-fluor 450-Foxp3 (FOXP3 Monoclonal Antibody (236A/E7), eBioscience™, Catalog #: 48–4777-42) at 4°C in the dark for 1 h. The samples were then washed and resuspended in fresh buffer for analysis. Flow cytometric analysis was performed using a BDTM LSR II flow cytometer (BD Biosciences, San Jose, California). Lymphocytes were gated on forward scatter (FSC) versus side scatter (SSC), corrected for live/dead and single cells (Fig. 1A-C), and 500,000 events collected for initial gating and then standardized to 50,000 lymphocytes for analysis using FlowJo version 10 software (Tree Star, Ashland, Oregon) with biexponential scaling. Tregs were quantified within the CD3+ and CD4+ gate as CD25+/Foxp3+ (Fig 1A, B). Tregs negative for the CD45RA antigen were defined as activated Tregs (Fig. 1C) and used as marker of functional Tregs (Miyara et al., 2009). Blood from two collection tubes per participant were processed individually. This generated duplicate data per single participant. Variability between samples for individual participants was less than 5%.
Figure 1. >Analysis of Tregs by flow cytometry.
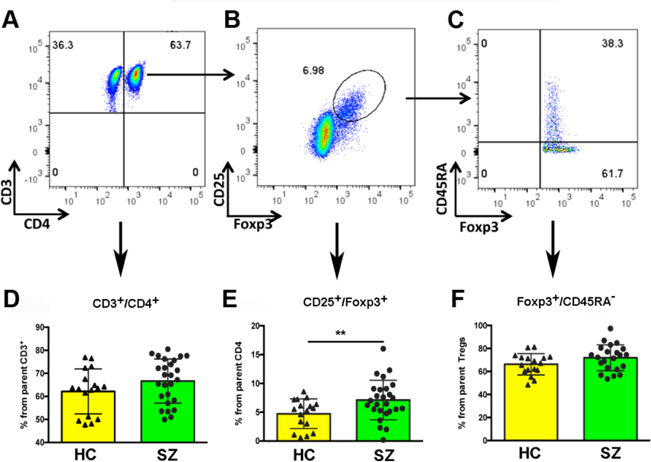
Representative flow cytometry dot plots showing the population of total CD4+ cells (A), CD4+/CD25+/Foxp3+ regulatory T cells (B) and CD45RAneg activated regulatory T cells (C). Student’s t tests were conducted between healthy controls (HC) and schizophrenia (SZ) patients for D) CD4+ T cells, E) regulatory T cells (p = 0.019), and F) activated regulatory T cells. N = 17 HC and 26 SZ patients.
2.5. Statistics
The demographic information is reported descriptively. The mean standard deviation of clinical data and neuropsychological outcomes for each group was calculated using Student’s t tests and Chi Square tests. The flow cytometry samples were de-identified so that those analyzing the samples were blind to group identity. Paired comparisons were conducted for proportion of T cell subtypes using Student’s t-tests. Spearman’s correlation analyses were used to determine the relationship between Tregs and psychiatric symptoms and neurocognitive performance. Linear regression models included covariates such as gender, smoking status and BMI to examine the impact of these variables on outcomes. All analyses were conducted using SAS 9.4 (SAS Institute, NC, USA). Data are reported as mean ± SD; while p ≤ 0.05 is considered significant.
3. Results
3.1. Demographics and sample characteristics
Demographic, clinical characteristics, BMI and blood counts are listed in Table 1. There were no significant group differences on any demographic variable, BMI, white blood cell count, total lymphocytes or in any other blood cell type. Medication use in the schizophrenia group is listed in the table. None of the healthy controls were treated with a psychotropic medication.
Table 1. Demographic and clinical characteristics.
Demographic and clinical characteristics of the sample including blood cell counts and medications. No differences were observed in any parameter except medications. FGA & SGA: First and second-generation antipsychotic respectively.
| Schizophrenia (N = 26) |
Healthy Controls (N = 17) |
Statistics | |
|---|---|---|---|
| Age (years; mean ± SD) | 45.5 ± 11.0 | 39.7 ± 12.4 | t = −1.62 p = 0.112 |
| Sex (male, N, %) | N = 19 (47%) | N = 9 (53%) | χ2 = 1.8 p = 0.176 |
| Race (N, %) | |||
|
White AA Asian Mixed |
N = 9 (35%) N = 15 (58%) N = 0 N = 2 (8%) |
N = 8 (47%) N = 6 (35%) N = 1 N = 2 (12%) |
χ2 = 3.1 p = 3.7 |
| Cigarette smoker current | 10 (38%) | 3 (18%) | χ2 = 2.1 p = 0.15 |
| Body mass index (kg/m2) | 32.4 ± 10.0 | 30.1 ± 6.1 | t = −0.92 p = 0.36 |
| White blood cell count (x103/μl) | 6.3 ± 2.8 | 5.6 ± 1.9 | t = 0.78 p = 0.44 |
| Neutrophils (x103/μl) | 3.9 ± 2.3 | 3.2 ± 1.3 | t = −125 p = 0.22 |
| Lymphocytes (x103/μl) | 1.8 ± 0.7 | 1.8 ± 0.6 | t = −0.10 p = 0.91 |
| Monocytes (x103/μl) | 0.5 ± 0.3 | 0.4 ± 0.2 | t = −1.14 p = 0.26 |
| Eosinophils (x103/μl) | 0.2 ± 0.1 | 0.2 ± 0.1 | t = 0.45 p = 0.66 |
| Basophils (x103/μl) | 0.0 ± 0.01 | 0.0 ± 0.01 | t = 0.27 p = 0.78 |
| Medications | |||
|
Clozapine SGA FGA |
N = 9 (35%) N = 7 (27%) N = 10 (38%) |
NA | |
| Antidepressants | N = 9 (35%) | NA | |
| Anxiolytics | N = 8 (31%) | NA |
3.2. Tregs are increased in participants with schizophrenia
The proportion of Tregs was higher in participants with SZ compared to the healthy controls (7.1 ± 0.7 versus 4.7 ± 0.6 respectively, t = 2.44, p = 0.02; Figure 1-E). No significant differences between groups were observed in the proportion of CD3+ cells from the parent lymphocyte gate, or in total CD4+ cells from the parent CD3+ population (Fig. 1-D) indicating a specific effect for Tregs. Likewise, no significant differences were observed in the proportion of activated Tregs (CD45RAneg.) between participants with SZ and healthy controls (Fig. 1-F) suggesting an overall increase in functional Tregs. These results were confirmed by applying an alternate gating strategy by obtaining a univariate histogram for Foxp3 within the CD4+/CD25+ gate (not shown). This yielded similar results of increased Foxp3 expression in Tregs in the SZ group compared to controls. These results show an increased proportion of circulating Tregs in participants with SZ, which is specific for this T cell subtype. As the total lymphocyte counts were almost identical between the two groups, and no group differences were found for CD3+ or CD4+ cells, these results translate to increased total numbers of Tregs in participants with SZ with respect to controls. While no relationships were noted between smoking, BMI, age and Tregs, logistic regression analyses were performed with Tregs as the dependent variable to assess the contribution of group, age, BMI, and smoking status on Tregs. The only variable for which there was a significant effect was diagnosis (F = 5.47; p = 0.025), suggesting that higher Tregs in SZ is not due to age (F = 0.46; p = 0.50), smoking (F = 0.18; p = 0.67) or BMI (F = 0.02; p = 0.89), three variables that are influenced by inflammation.
3.3. Neuropsychological test performance and symptoms correlations with Tregs
Data distribution for main diagnostic symptoms is shown in Figure 2. As expected, compared to healthy controls, participants with SZ had higher BPRS, SANS and CGI scores and lower MCCB composite score (Fig 2A-D). While there were trends for higher depressive symptoms in SZ and lower attention scores, these differences were not significant. The participants with SZ were stable with a low level of symptom presentation.
Figure 2. Psychiatric symptoms.
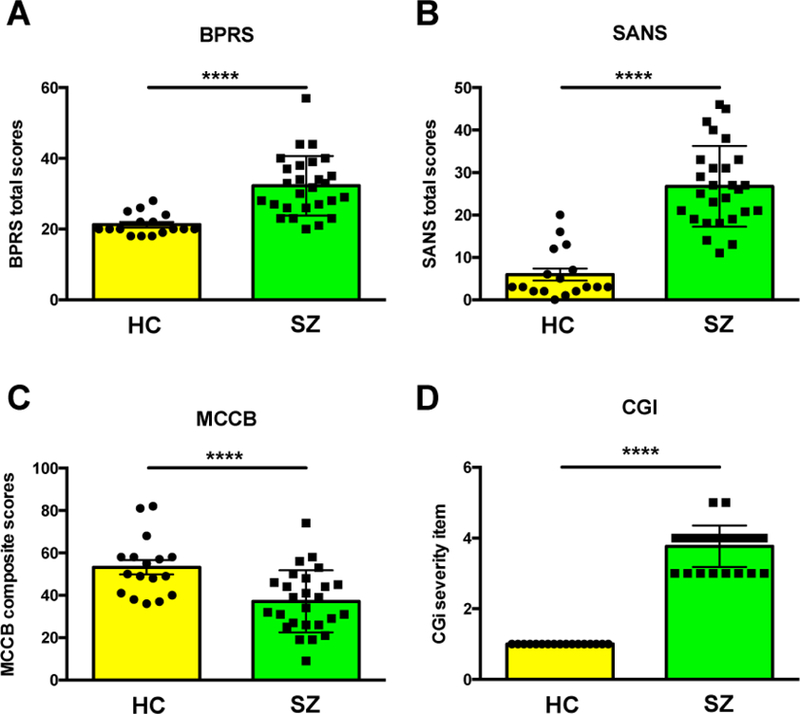
Psychiatric symptoms and neurocognitive function in the schizophrenia group (SZ) and healthy controls (HC). A) BPRS: Brief Psychiatric Rating Scale total score. B) SANS: Scale for the Assessment of Negative Symptoms. C) MCCB: MATRICS Consensus Cognitive Battery. D) CGI: Clinical Global Impression. Scores are shown as Mean ± SD. **** Significant p values (≤ 0.0001)
Spearman’s correlations were used to examine the relationship of Tregs and symptom domains. Healthy controls displayed no relationship between Tregs and symptoms in any domain or cognitive performance, with the exception of higher Tregs being correlated to higher working memory performance (r = 0.49; p = 0.05; data not shown). In the SZ group, Tregs were associated with lower SANS total scores (r = −0.38; p = 0.05; Fig 3A, B); the relationship between Tregs and SANS total score was primarily driven by the correlations observed with the alogia (r = −0.46; p = 0.018) and affective blunting (r = −0.36; p = 0.07) scales (Table 2). These correlations for Tregs were not observed for CD3+ or CD4+ T cells indicating that these populations are not influencing these outcomes. Age, smoking status and BMI were not related to Tregs and did not contribute significantly to any group effects. There were no significant relationships observed for BPRS total or positive symptom scores.
Figure 3. Correlations of Tregs with total SANS scores.
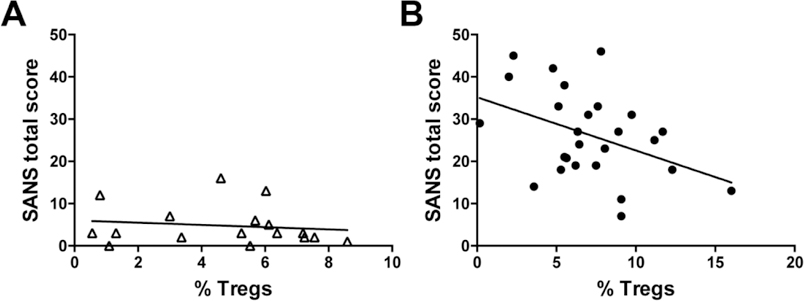
Correlation plots for percentage of Tregs from the CD4+ group of cells and total SANS scores in healthy controls and participants with schizophrenia
Table 2. Correlations of T cells with psychiatric symptoms and cognition in schizophrenia patients.
For the schizophrenia group, the SANS total score as well as domains of alogia and affective blunting suggest less impaired negative symptoms with higher Tregs based on significant correlations (see text). Higher CD4 cells were correlated to higher visual memory performance. Significant p values are noted in bold.
| CD3+ | CD4+ | Tregs | |
|---|---|---|---|
| BPRS Total | r = −0.25 p = 0.22 |
r = 0.05 p = 0.80 |
r = −0.01 p = 0.96 |
| Positive symptoms | r = −0.24 p = 0.25 |
r = 0.16 p = 0.44 |
r = 0.06 p = 0.76 |
| SANS total score | r = 0.08 p = 0.71 |
r = −0.28 p = 0.17 |
r = −0.38 p = 0.05 |
| SANS Anhedonia | r = 0.23 p = 0.26 |
r = −0.53 p = 0.005 |
r = −0.18 p = 0.38 |
| SANS Alogia | r = 0.04 p = 0.86 |
r = −0.35 p = 0.08 |
r = −0.46 p = 0.02 |
| SANS Avolition | r = −0.03 p = 0.90 |
r = −0.13 p = 0.52 |
r = −0.20 p = 0.32 |
| SANS Affective blunting | r = −0.08 p = 0.70 |
r = 0.08 p = 0.69 |
r = −0.36 p = 0.07 |
| Calgary Depression Rating Scale | r = −0.16 p = 0.44 |
r = −0.05 p = 0.79 |
r = −0.14 p = 0.48 |
| Clinical Global Impression | r = −0.06 p = 0.76 |
r = −0.20 p = 0.32 |
r = 0.02 p = 0.91 |
| MCCB composite | r = −0.08 p = 0.71 |
r = 0.15 p = 0.46 |
r = 0.31 p = 0.12 |
| Speed of processing | r = 0.12 p = 0.56 |
r = −0.07 p = 0.73 |
r = 0.29 p = 0.15 |
| Attention/vigilance | r = −0.03 p = 0.88 |
r = 0.04 p = 0.86 |
r = 0.26 p = 0.20 |
| Working memory | r = 0.21 p = 0.31 |
r = −0.28 p = 0.17 |
r = 0.26 p = 0.20 |
| Verbal learning and memory | r = −0.05 p = 0.79 |
r = 0.24 p = 0.24 |
r = −0.03 p = 0.89 |
| Visual learning and memory | r = −0.34 p = 0.08 |
r = 0.46 p = 0.02 |
r = 0.03 p = 0.87 |
| Reasoning and problem solving | r = −0.00 p = 0.96 |
r = −0.03 p = 0.88 |
r = 0.33 p = 0.09 |
There were no significant associations between Tregs and MCCB total score or any domain score (see Table 2). In contrast, there was a significant correlation between higher CD4+ T cells and better visual learning and memory performance (r = 0.46; p = 0.02). Notably, the correlations for CD4+ cells found in both HC and SZ groups in the cognitive domain were not found for Tregs, suggesting that other CD4+ T cell subtypes, but not Tregs, are associated with cognitive performance.
3.4. Psychiatric Medications and Tregs
All participants with SZ received antipsychotic medications (see Table 1 for type of antipsychotic). A subgroup of participants with SZ was also medicated with antidepressants and anxiolytics. Thus, we examined the contribution of antipsychotic, antidepressant or anxiolytic medications on Tregs within the SZ group. Moreover, among antipsychotic use, clozapine, second-generation antipsychotics (SGA) and first generation antipsychotics (FGA) were also examined with respect to Tregs. There was no significant difference in contribution among the antipsychotic classes on the prevalence of Tregs, (F = 1.25; p = 0.31). Also, there was no effect of antidepressant (F = 2.50; p = 0.13) or with anxiolytic (F = 1.34; p = 0.26) use on the prevalence of Tregs. These results suggest that psychotropic medications had no detectable effect on Treg prevalence in this study.
4. Discussion
To our knowledge, this is the first study reporting on Tregs in SZ using the canonical marker Foxp3 as a marker of Tregs (Kitagawa and Sakaguchi, 2017; Miyara et al., 2009; Mohr et al., 2018; Rodriguez-Perea et al., 2016). Despite a modest sample size, the present study revealed an important effect size showing an increased proportion of Tregs in medicated participants with SZ compared to healthy controls. The difference in Tregs was not related to an acute exacerbation of symptoms as the participants with SZ were required to be clinically stable to enter the study. Potential confounders, including BMI, smoking status and age, were not correlated with the numbers of Tregs. The group difference was specific for Tregs, since there were no significant differences in the proportion of CD4+ T cells. Comparable proportions of activated Tregs (CD45RAneg) between groups and increased expression of Foxp3 in SZ suggest that the increase relates to the generation and maintenance of functional Tregs, possibly mediating immunosuppressive or anti-inflammatory functions (Miyara et al., 2009; Mohr et al., 2018). Interestingly, higher Tregs were significantly associated with lower negative symptoms, especially alogia and affective blunting, which suggests that an increase in Tregs in SZ is associated with better emotional expression.
Although we found no relationship between Tregs and psychotropic medications, as all participants with SZ were medicated and stable, increases in Tregs may be the result of medication effects on Tregs and/or these cells may be mediators of treatment response. The only other available study reporting on Tregs in SZ indicates that either of these possibilities are feasible, in particular with respect to negative symptoms (Fernandez-Egea et al., 2016). Indeed, Fernandez-Egea and colleagues found reduced Tregs in a sample of 18 treatment resistant clozapine-treated participants with SZ compared to matched controls. Within the SZ sample, reduced Tregs were associated with more severe negative symptoms, which is consistent with our findings. In addition, Fernandez-Egea and colleagues found a significant relationship between increased Tregs and better neuropsychological test performance. Although we did not find significant relationships between Tregs and neuropsychological test performance, some of the observed correlations were in the direction of increased Tregs being associated with better performance (i.e: p = 0.09 for reasoning and problem solving and p = 0.15 for speed of processing, Table 2). While neither study examined prospective changes in Treg populations across disease state, it is plausible that Tregs may relate to treatment efficacy. Related to this, a study examining antipsychotic-naïve, first episode people with SZ found that an increased proportion of Th17 cells correlated with positive and negative syndrome scale (PANSS) scores, and were decreased by chronic treatment with risperidone (Ding et al., 2014). The pro-inflammatory role of Th17 cells is well established (Song et al., 2014) and it is possible that one of the therapeutic effects of Tregs may be mediated by suppressing Th17 cells (Knochelmann et al., 2018). Since both Th17 and Tregs are subtypes of CD3+/CD4+ cells, these findings may represent functional outcomes related to the MHC region, which, as previously discussed, has been implicated in SZ by GWAS studies. Thus, the potential value of Tregs as a functional biomarker associated with genetic disease risk deserves further investigation. Also of note, the serine/threonine kinase 1(AKT1) gene, previously implicated in schizophrenia by several studies (Nicodemus et al., 2010; Emamian ES., 2012; Wockner et al., 2014) has direct regulatory roles on Tregs through interaction with the forkhead box O (Foxo) family of transcription factors, which in turn regulates Foxp3 expression and function (Ouyang et al., 2010; 2012). Therefore, down- or upstream mechanisms of Treg homeostasis may provide insights on biological processes involving diverse genes associated with the disease.
As previously discussed, specific correlations were found in the SZ sample with Tregs and domains of affect. Moreover, correlations between CD4+ cells and domains of cognitive functioning were observed for both control and SZ groups. While these findings in humans require further confirmation in larger cohorts, the association of CD4+ T cells with improved cognition and Tregs with emotional expression is consistent with basic rodent studies showing a role for these cells in emotional regulation and cognitive processes (Brynskikh et al., 2008; Clark et al., 2016; Clark et al., 2018; Derecki et al., 2010; Herkenham and Kigar, 2017; Kim et al., 2012; Kipnis et al., 2004; Kipnis et al., 2012). While the exact mechanisms on how CD4+ T cells in general, and Tregs in particular mediate these effects are not entirely clear, there is growing consensus that direct interactions with the central nervous system (CNS) are required (reviewed by (Filiano et al., 2017). Together, these studies provide support for the proposition that Tregs may not only be useful biomarkers directly associated with MHC variations, but they may also map specific neurobehavioral traits of immune-CNS interactions mediated through the MHC locus.
4.1. Limitations
Major limitations are the small sample size and the analysis performed at a single point in time. As discussed throughout the manuscript, our study cannot determine if medication status contributes to higher Tregs in SZ. While many variables may confound these results, age, smoking, or BMI were not found related to the prevalence of any T cell subtype. Moreover, participants were not enrolled if they currently tested positive for illicit drugs, limiting their potential effect on Tregs in this study.
4.2. Conclusions
This is the first study analyzing Tregs in schizophrenia using the canonical marker Foxp3, revealing increased proportions in stable participants with SZ, which inversely correlate with negative symptoms, suggesting that increases in this cell population may counter balance putative processes promoting and/or maintaining negative symptoms, in particular alogia and possibly affective blunting. Further studies including additional T cells subsets, such as Th17 cells, measured at multiple time-points and under different treatment protocols are warranted.
Highlights.
◦ Regulatory T cells are increased in the blood of stable medicated schizophrenia patients
◦ This increase corresponds to functional cells according to canonical
◦ markers
◦ A negative correlation between regulatory T cells and negative symptoms was detected
◦ A positive correlation for both schizophrenia and healthy controls was
◦ found for cognition and CD4 T cells
◦ These results supports the use of regulatory T cells as valid biomarkers in schizophrenia
Acknowledgements
The author’s wish to thank Dr. Amit Golding and Molly Hritzo from the University of Maryland School of Medicine for their help with flow cytometry.
Funding source
Funded by NIMH grant Silvio O. Conte Centers for Basic Neuroscience or Translational Mental Health Research P50 MH103222.
Footnotes
Conflict of interest
No disclosures to report
Publisher's Disclaimer: This is a PDF file of an unedited manuscript that has been accepted for publication. As a service to our customers we are providing this early version of the manuscript. The manuscript will undergo copyediting, typesetting, and review of the resulting proof before it is published in its final citable form. Please note that during the production process errors may be discovered which could affect the content, and all legal disclaimers that apply to the journal pertain.
References
- Addington D, Addington J, Maticka-Tyndale E, 1993. Assessing depression in schizophrenia: the Calgary Depression Scale. Br J Psychiatry Suppl(22), 39–44. [PubMed] [Google Scholar]
- Agartz I, Brown AA, Rimol LM, Hartberg CB, Dale AM, Melle I, et al. , 2011. Common sequence variants in the major histocompatibility complex region associate with cerebral ventricular size in schizophrenia. Biol Psychiatry 70 (7), 696–698. [DOI] [PubMed] [Google Scholar]
- American Psychiatric Association, 2013. Diagnostic and statistical manual of mental disorders (5th ed.). Washington, DC: 5th edition. [Google Scholar]
- Andreasen NC, 1982. Negative symptoms in schizophrenia. Definition and reliability. Arch Gen Psychiatry 39 (7), 784–788. [DOI] [PubMed] [Google Scholar]
- Arce-Sillas A, Alvarez-Luquin DD, Tamaya-Dominguez B, Gomez-Fuentes S, Trejo-Garcia A, Melo-Salas M, et al. , 2016. Regulatory T Cells: Molecular Actions on Effector Cells in Immune Regulation. J Immunol Res 2016, 1720827. [DOI] [PMC free article] [PubMed] [Google Scholar]
- Bergen SE, O’Dushlaine CT, Ripke S, Lee PH, Ruderfer DM, Akterin S, et al. , 2012. Genome-wide association study in a Swedish population yields support for greater CNV and MHC involvement in schizophrenia compared with bipolar disorder. Mol Psychiatry 17 (9), 880–886. [DOI] [PMC free article] [PubMed] [Google Scholar]
- Brown AS, 2011. Exposure to prenatal infection and risk of schizophrenia. Front Psychiatry 2, 63. [DOI] [PMC free article] [PubMed] [Google Scholar]
- Brown AS, Hooton J, Schaefer CA, Zhang H, Petkova E, Babulas V, et al. , 2004. Elevated maternal interleukin-8 levels and risk of schizophrenia in adult offspring. Am J Psychiatry 161 (5), 889–895. [DOI] [PubMed] [Google Scholar]
- Brynskikh A, Warren T, Zhu J, Kipnis J, 2008. Adaptive immunity affects learning behavior in mice. Brain Behav Immun 22 (6), 861–869. [DOI] [PubMed] [Google Scholar]
- Buchanan RW, Javitt DC, Marder SR, Schooler NR, Gold JM, McMahon RP, et al. , 2007. The Cognitive and Negative Symptoms in Schizophrenia Trial (CONSIST): the efficacy of glutamatergic agents for negative symptoms and cognitive impairments. Am J Psychiatry 164 (10), 1593–1602. [DOI] [PubMed] [Google Scholar]
- Charles A Janeway J, Travers Paul, Walport Mark, and Shlomchik Mark J, 2001. Immunobiology, 5th edition Garland Publishing, new York. [Google Scholar]
- Clark SM, Soroka JA, Song C, Li X, Tonelli LH, 2016. CD4(+) T cells confer anxiolytic and antidepressant-like effects, but enhance fear memory processes in Rag2(−/−) mice. Stress 19 (3), 303–311. [DOI] [PMC free article] [PubMed] [Google Scholar]
- Clark SM, Vaughn CN, Soroka JA, Li X, Tonelli LH, 2018. Neonatal adoptive transfer of lymphocytes rescues social behavior during adolescence in immune deficient mice. Eur J Neurosci. [DOI] [PMC free article] [PubMed] [Google Scholar]
- Craddock RM, Lockstone HE, Rider DA, Wayland MT, Harris LJ, McKenna PJ, et al. , 2007. Altered T-cell function in schizophrenia: a cellular model to investigate molecular disease mechanisms. PLoS One 2 (8), e692. [DOI] [PMC free article] [PubMed] [Google Scholar]
- Derecki NC, Cardani AN, Yang CH, Quinnies KM, Crihfield A, Lynch KR, et al. , 2010. Regulation of learning and memory by meningeal immunity: a key role for IL-4. J Exp Med 207 (5), 1067–1080. [DOI] [PMC free article] [PubMed] [Google Scholar]
- Ding M, Song X, Zhao J, Gao J, Li X, Yang G, et al. , 2014. Activation of Th17 cells in drug naive, first episode schizophrenia. Prog Neuropsychopharmacol Biol Psychiatry 51, 78–82. [DOI] [PubMed] [Google Scholar]
- Doorduin J, de Vries EF, Willemsen AT, de Groot JC, Dierckx RA, Klein HC, 2009. Neuroinflammation in schizophrenia-related psychosis: a PET study. J Nucl Med 50 (11), 1801–1807. [DOI] [PubMed] [Google Scholar]
- Drexhage RC, Hoogenboezem TA, Cohen D, Versnel MA, Nolen WA, van Beveren NJ, et al. , 2011. An activated set point of T-cell and monocyte inflammatory networks in recent-onset schizophrenia patients involves both pro- and anti-inflammatory forces. Int J Neuropsychopharmacol 14 (6), 746–755. [DOI] [PubMed] [Google Scholar]
- Elmer BM, McAllister AK, 2012. Major histocompatibility complex class I proteins in brain development and plasticity. Trends Neurosci 35 (11), 660–670. [DOI] [PMC free article] [PubMed] [Google Scholar]
- Emamian ES. AKT/GSK3 signaling pathway and schizophrenia. 2012. Front Mol Neurosci. 5:33. [DOI] [PMC free article] [PubMed] [Google Scholar]
- Fatjo-Vilas M, Pomarol-Clotet E, Salvador R, Monte GC, Gomar JJ, Sarro S, et al. , 2012. Effect of the interleukin-1beta gene on dorsolateral prefrontal cortex function in schizophrenia: a genetic neuroimaging study. Biol Psychiatry 72 (9), 758–765. [DOI] [PubMed] [Google Scholar]
- Fernandez-Egea E, Vertes PE, Flint SM, Turner L, Mustafa S, Hatton A, et al. , 2016. Peripheral Immune Cell Populations Associated with Cognitive Deficits and Negative Symptoms of Treatment-Resistant Schizophrenia. PLoS One 11 (5), e0155631. [DOI] [PMC free article] [PubMed] [Google Scholar]
- Filiano AJ, Gadani SP, Kipnis J, 2017. How and why do T cells and their derived cytokines affect the injured and healthy brain? Nat Rev Neurosci 18 (6), 375–384. [DOI] [PMC free article] [PubMed] [Google Scholar]
- Fineberg AM, Ellman LM, 2013. Inflammatory cytokines and neurological and neurocognitive alterations in the course of schizophrenia. Biol Psychiatry 73 (10), 951–966. [DOI] [PMC free article] [PubMed] [Google Scholar]
- Guy W, 1976. The clinical global impression scale. The ECDEU assesment manual for psychopharmacology revised 76 (338), 218–222. [Google Scholar]
- Herkenham M, Kigar SL, 2017. Contributions of the adaptive immune system to mood regulation: Mechanisms and pathways of neuroimmune interactions. Prog Neuropsychopharmacol Biol Psychiatry 79 (Pt A), 49–57. [DOI] [PMC free article] [PubMed] [Google Scholar]
- Hope S, Ueland T, Steen NE, Dieset I, Lorentzen S, Berg AO, et al. , 2013. Interleukin 1 receptor antagonist and soluble tumor necrosis factor receptor 1 are associated with general severity and psychotic symptoms in schizophrenia and bipolar disorder. Schizophr Res 145 (1–3), 36–42. [DOI] [PubMed] [Google Scholar]
- Kim SJ, Lee H, Lee G, Oh SJ, Shin MK, Shim I, et al. , 2012. CD4+CD25+ regulatory T cell depletion modulates anxiety and depression-like behaviors in mice. PLoS One 7 (7), e42054. [DOI] [PMC free article] [PubMed] [Google Scholar]
- Kipnis J, Cohen H, Cardon M, Ziv Y, Schwartz M, 2004. T cell deficiency leads to cognitive dysfunction: implications for therapeutic vaccination for schizophrenia and other psychiatric conditions. Proc Natl Acad Sci U S A 101 (21), 8180–8185. [DOI] [PMC free article] [PubMed] [Google Scholar]
- Kipnis J, Derecki NC, Yang C, Scrable H, 2008. Immunity and cognition: what do age-related dementia, HIV-dementia and ‘chemo-brain’ have in common? Trends Immunol 29 (10), 455–463. [DOI] [PubMed] [Google Scholar]
- Kipnis J, Gadani S, Derecki NC, 2012. Pro-cognitive properties of T cells. Nat Rev Immunol 12 (9), 663–669. [DOI] [PMC free article] [PubMed] [Google Scholar]
- Kitagawa Y, Sakaguchi S, 2017. Molecular control of regulatory T cell development and function. Curr Opin Immunol 49, 64–70. [DOI] [PubMed] [Google Scholar]
- Knochelmann HM, Dwyer CJ, Bailey SR, Amaya SM, Elston DM, Mazza-McCrann JM, et al. , 2018. When worlds collide: Th17 and Treg cells in cancer and autoimmunity. Cell Mol Immunol. [DOI] [PMC free article] [PubMed] [Google Scholar]
- McAllister AK, 2014. Major histocompatibility complex I in brain development and schizophrenia. Biol Psychiatry 75 (4), 262–268. [DOI] [PMC free article] [PubMed] [Google Scholar]
- Miller BJ, Culpepper N, Rapaport MH, 2013a. C-Reactive Protein Levels in Schizophrenia. Clin Schizophr Relat Psychoses, 1–22. [DOI] [PubMed] [Google Scholar]
- Miller BJ, Gassama B, Sebastian D, Buckley P, Mellor A, 2013. b. Meta-analysis of lymphocytes in schizophrenia: clinical status and antipsychotic effects. Biol Psychiatry 73 (10), 993–999. [DOI] [PMC free article] [PubMed] [Google Scholar]
- Miyara M, Yoshioka Y, Kitoh A, Shima T, Wing K, Niwa A, et al. , 2009. Functional delineation and differentiation dynamics of human CD4+ T cells expressing the FoxP3 transcription factor. Immunity 30 (6), 899–911. [DOI] [PubMed] [Google Scholar]
- Mohr A, Malhotra R, Mayer G, Gorochov G, Miyara M, 2018. Human FOXP3(+) T regulatory cell heterogeneity. Clin Transl Immunology 7 (1), e1005. [DOI] [PMC free article] [PubMed] [Google Scholar]
- Muller N, Wagner JK, Krause D, Weidinger E, Wildenauer A, Obermeier M, et al. , 2012. Impaired monocyte activation in schizophrenia. Psychiatry Res 198 (3), 341–346. [DOI] [PubMed] [Google Scholar]
- Nicodemus KK1, Law AJ, Radulescu E, Luna A, Kolachana B, Vakkalanka R, Rujescu D, Giegling I, Straub RE, McGee K, Gold B, Dean M, Muglia P, Callicott JH, Tan HY, Weinberger DR. Biological validation of increased schizophrenia risk with NRG1, ERBB4, and AKT1 epistasis via functional neuroimaging in healthy controls. 2010. Arch Gen Psychiatry 67(10):991–1001. [DOI] [PMC free article] [PubMed] [Google Scholar]
- Nuechterlein KH, Green MF, Kern RS, Baade LE, Barch DM, Cohen JD, et al. , 2008. The MATRICS Consensus Cognitive Battery, part 1: test selection, reliability, and validity. Am J Psychiatry 165 (2), 203–213. [DOI] [PubMed] [Google Scholar]
- Ouyang W, Beckett O, Ma Q, Paik JH, DePinho RA, Li MO. 2010. Foxo proteins cooperatively control the differentiation of Foxp3+ regulatory T cells. Nat Immunol. 11(7):618–27. [DOI] [PubMed] [Google Scholar]
- Ouyang W1, Liao W, Luo CT, Yin N, Huse M, Kim MV, Peng M, Chan P, Ma Q, Mo Y, Meijer D, Zhao K, Rudensky AY, Atwal G, Zhang MQ, Li MO. 2012. Novel Foxo1-dependent transcriptional programs control T(reg) cell function. Nature 491(7425):554–9. [DOI] [PMC free article] [PubMed] [Google Scholar]
- Overall JE,GD, 1962. The brief psychiatric rating scale. Psychological Reports 10, 799–812. [DOI] [PubMed] [Google Scholar]
- Purcell SM, Wray NR, Stone JL, Visscher PM, O’Donovan MC, Sullivan PF, et al. , 2009. Common polygenic variation contributes to risk of schizophrenia and bipolar disorder. Nature 460 (7256), 748–752. [DOI] [PMC free article] [PubMed] [Google Scholar]
- Reale M, Patruno A, De Lutiis MA, Pesce M, Felaco M, Di Giannantonio M, et al. , 2011. Dysregulation of chemo-cytokine production in schizophrenic patients versus healthy controls. BMC Neurosci 12, 13. [DOI] [PMC free article] [PubMed] [Google Scholar]
- Rodriguez-Perea AL, Arcia ED, Rueda CM, Velilla PA, 2016. Phenotypical characterization of regulatory T cells in humans and rodents. Clin Exp Immunol 185 (3), 281–291. [DOI] [PMC free article] [PubMed] [Google Scholar]
- Saetre P, Emilsson L, Axelsson E, Kreuger J, Lindholm E, Jazin E, 2007. Inflammation-related genes up-regulated in schizophrenia brains. BMC Psychiatry 7, 46. [DOI] [PMC free article] [PubMed] [Google Scholar]
- Song X, Gao H, Qian Y, 2014. Th17 differentiation and their pro-inflammation function. Adv Exp Med Biol 841, 99–151. [DOI] [PubMed] [Google Scholar]
- Stefansson H, Ophoff RA, Steinberg S, Andreassen OA, Cichon S, Rujescu D, et al. , 2009. Common variants conferring risk of schizophrenia. Nature 460 (7256), 744–747. [DOI] [PMC free article] [PubMed] [Google Scholar]
- Wockner LF1, Noble EP2, Lawford BR3, Young RM4, Morris CP4, Whitehall VL1, Voisey J4. 2014. Genome-wide DNA methylation analysis of human brain tissue from schizophrenia patients. Transl Psychiatry. 4:e339. [DOI] [PMC free article] [PubMed] [Google Scholar]
- Zhang Y, Lu T, Yan H, Ruan Y, Wang L, Zhang D, et al. , 2013. Replication of association between schizophrenia and chromosome 6p21–6p22.1 polymorphisms in Chinese Han population. PLoS One 8 (2), e56732. [DOI] [PMC free article] [PubMed] [Google Scholar]