Abstract
Demineralized bone matrix is a widely used allograft from which not only the inorganic mineral but also embedded growth factors are removed by hydrochloric acid (HCl). The cellular response to the growth factors released during the preparation of demineralized bone matrix, however, has not been studied. Here we investigated the in vitro impact of acid bone lysate (ABL) prepared from porcine cortical bone chips on oral fibroblasts. Proteomic analysis of ABL revealed a large spectrum of bone-derived proteins including TGF-β1. Whole genome microarrays and RT-PCR together with the pharmacologic blocking of TGF-β receptor type I kinase with SB431542 showed that ABL activates the TGF-β target genes interleukin 11, proteoglycan 4, and NADPH oxidase 4. Interleukin 11 expression was confirmed at the protein level by ELISA. Immunofluorescence and Western blot showed the nuclear localization of Smad2/3 and increased phosphorylation of Smad3 with ABL, respectively. This effect was independent of whether ABL was prepared from mandible, calvaria or tibia. These results demonstrate that TGF-β is a major growth factor that is removed upon the preparation of demineralized bone matrix.
Introduction
Bone grafts are regularly used for augmentation in implant dentistry, oral and maxillofacial surgery, besides other medical fields including orthopedics and traumatology dealing with bone reconstructions1,2. Freshly prepared bone autografts are considered gold standard in reconstructing large and complex bone defects due to the osteoconductive surface and the presence of osteogenic cells that can contribute to bone formation3. Furthermore, growth factors released upon autograft resorption are supposed to support bone regeneration, even though evidence to support this claim is poor. Similar to the resorption of autografts by osteoclasts, demineralization of allografts by hydrochloric acid does not only remove the mineral phase4. Hydrochloric acid also removes a fraction of growth factors intrinsic to bone. The biological activity of the respective acid bone lysate (ABL), which are discarded upon the preparation of demineralized bone matrix, has not been characterized so far.
Bone is a rich source of growth factors including TGF-β15,6. Pioneer work of purification and characterization of TGF-β1 released by hydrochloric acid and other methods dates back to the 1980s6–8. With the introduction of proteomics, bone extraction protocols were refined9 still including demineralization of bone by hydrochloric acid10. The concentration of TGF-β1 with around 0.5 ng/ml in bone lysates is conserved among skeletal areas and gender5. In vivo, TGF-β1 is stored in a latent form and can be released and activated by osteoclasts11–13. TGF-β1 released during bone remodeling induces migration of mesenchymal stem cells14,15 and targets osteoclasts16. However, the activity of TGF-β1 and other growth factors in ABL has not been studied recently.
Bioassays with TGF-β-responsive cells are appropriate to determine TGF-β activity in ABL. We previously used oral fibroblasts to detect TGF-β1 activity in supernatants of freshly prepared bone chips17 and enamel matrix derivatives18. Moreover, the adsorption of TGF-β1 from these preparations to collagen matrices commonly used for guided bone regeneration was determined by gene expression changes of oral fibroblasts19,20. The selection of genes was based on proteomic analysis and a whole genome microarray resulting in a panel of TGF-β target genes including interleukin 11 (IL11), proteoglycan4 (PRG4), and NADPH oxidase 4 (NOX4)21,22. Further support for activation of TGF-β signaling comes from phosphorylation and translocation of Smad3 into the nucleus23.
Here we report the protein composition of ABL and determine the respective biological activity for oral fibroblasts. Based on a whole genome microarray and RT-PCR approach including the pharmacologic blocking of TGF-β receptor type I kinase with SB43154224, ABL caused a robust activation of TGF-β signaling. ABL also reduced the expression of osteogenic and adipogenic differentiation markers in calvaria cells and 3T3-L1 cells, respectively. Our findings suggest that TGF-β is among the major growth factors being discarded upon the demineralization of bone matrix.
Results
ABL contains a large spectrum of proteins including TGF-β
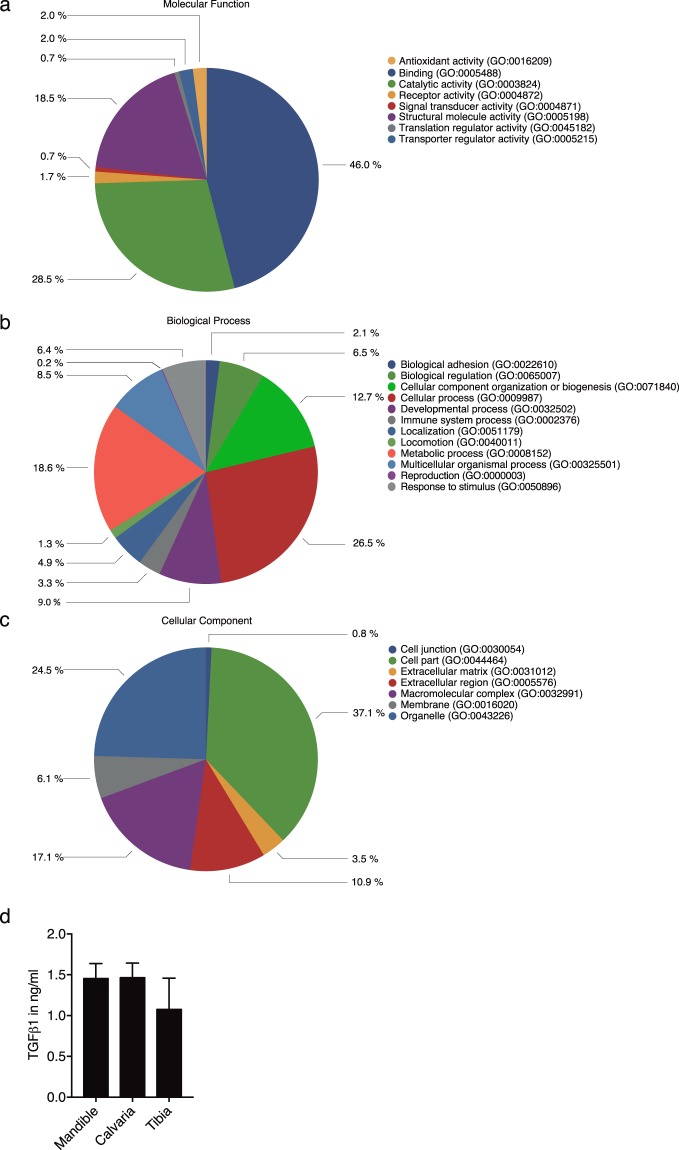
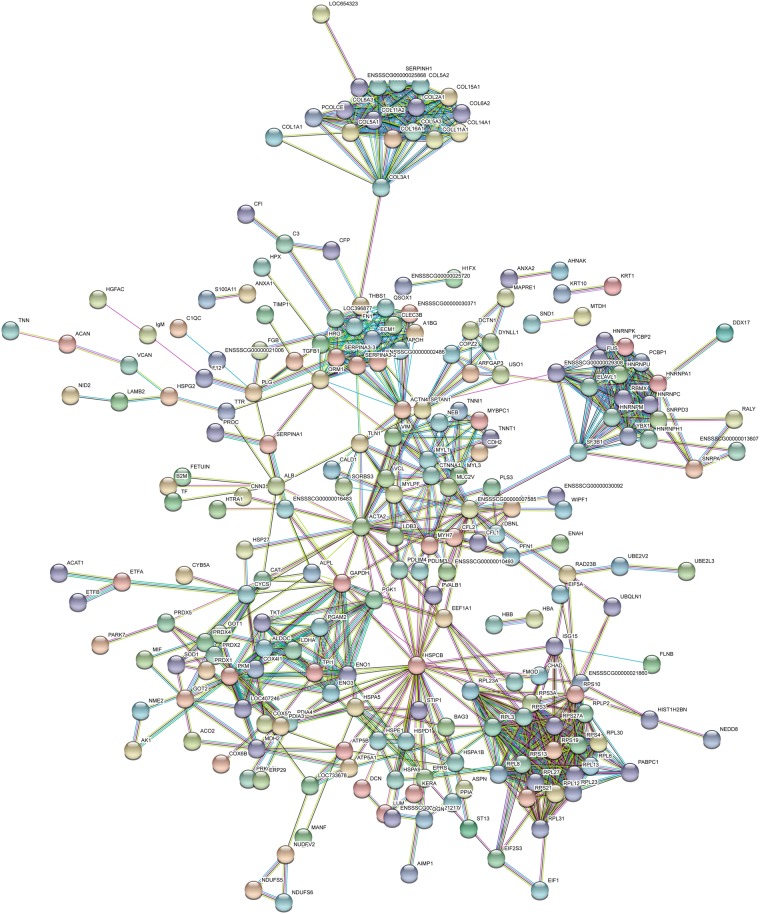
To understand the complexity of ABL with respect to a possible cellular response, a proteomic analysis was performed. In support of previous proteomic analysis of bone-conditioned medium (BCM)22, we detected a wide range of proteins including growth factors with a possible impact on cellular function (Figs 1 and 2). Proteomic analysis of ABL revealed 394 proteins including TGF-β1 (Suppl. Table 1). Panther classified ABL proteins into 8, 12 and 7 groups according to their molecular function (Fig. 1a), biologic process (Fig. 1b) and cellular component (Fig. 1c), respectively. The majority of proteins were linked to transporter regulator activity (46%) and catalytic activity (28.5%) (Fig. 1a). Cellular process and metabolic process were represented by 26.5% and 18.6% of the proteins, respectively (Fig. 1b). The majority of the proteins originated from cells (37.1%) and organelles (24.5%) (Fig. 1c). The presence of active TGF-β1 in ABL was 1.3 ± 0.2 ng/ml independent of the bone source: mandible, calvaria or tibia (Fig. 1d). According to the STRING analysis tool, proteins in ABL revealed multiple clusters including ribosomal protein and collagens and also showed TGF-β1 (Fig. 2).
Figure 1.
Acid bone lysate (ABL) contains a large spectrum of proteins including TGF-β. Panther analysis of molecular function (a) cellular component (b) and class (c) of proteins in ABL. (d) TGF-β1 immunoassay of different bone regions: mandible, calvaria and tibia. N = 3–5. Data represent the mean ± SD.
Figure 2.
STRING representation of a network involving the proteins detected in ABL. Different line colors represent the types of evidence for the association between proteins.
ABL maintains cell viability
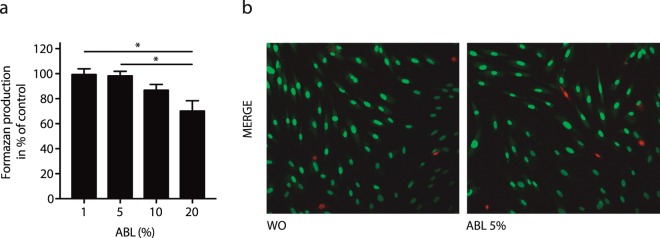
To evaluate the impact of ABL on cell viability, the formation of formazan was determined. Dose-response curves indicate that a concentration of 5% ABL is appropriate to maintain viability of human gingival fibroblasts (Fig. 3a). Cell viability at 5% acidy bone lysate was further confirmed by live-dead staining (Fig. 3b). Thus, 5% of acid bone lysate was selected to study the whole genome response in gingival fibroblasts.
Figure 3.
Viability of primary oral fibroblast exposed to acid bone lysate (ABL). Cell viability staining of primary oral fibroblast upon exposure to ABL was tested by MTT assay (a) and Live-Dead staining (b). The results from these experiments demonstrated that stimulation with ABL at 5% is highly biocompatible with oral fibroblast. Live-Dead staining was done with viable cells appearing in green and dead cells in red. N = 3–5. Data represent the mean ± SD relative to the control. *P < 0.05, by Kruskal-Wallis test with Dunn’s multiple comparisons correction.
ABL provokes changes in gene expression based on a whole genome assay
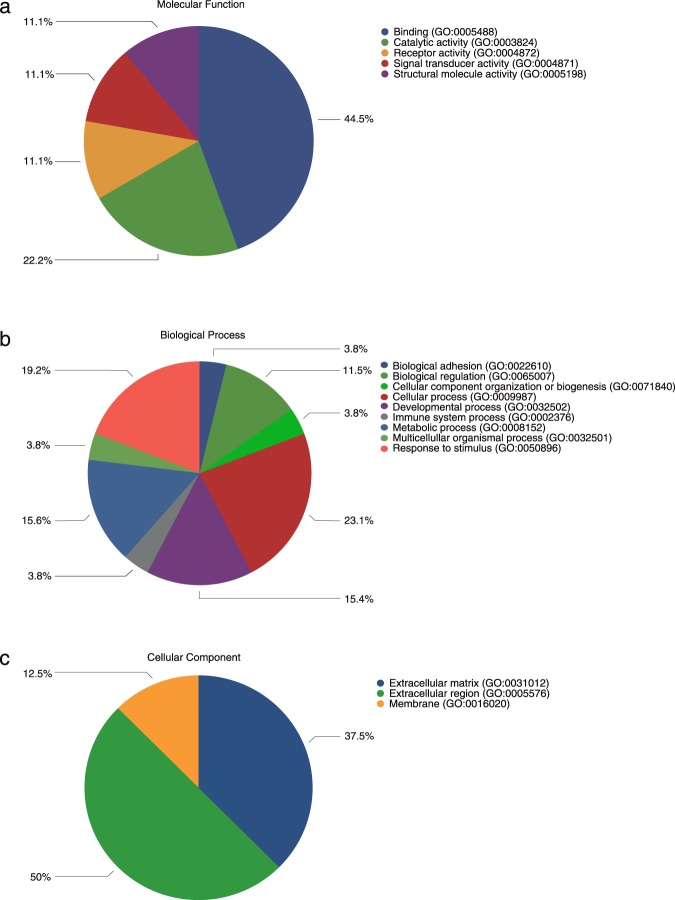
To determine the overall cellular response of oral fibroblasts to ABL, a whole genome gene assay was performed. Overall, 1527 genes are changed ≥ 1.5-fold (Suppl. Table 2). Among those genes, 17 genes (IL11, NOX4, PRG4, IL33, MMP10, ADAMTS5, MMP13, BMP2, COMP, INHBA, AREG, COL10A1, CXCL5, PMEPA1, TSPAN13, GPR183, ESM1) and 1 gene (PTX3) are at least 10-fold up- and down-regulated, respectively (Table 2). To gain information on the significantly expressed genes, we functionally categorized them using the WEB-based Gene Stet Analysis Toolkit (WebGestalt) database. GO-term analysis revealed that up-regulated genes in response to ABL were associated with the TGF-β signaling pathway (adj. P = 0.000045; enrichment score 12.12; genes: TGF-β1; BMP2, BMP6, ID3, ID1, INHBA, COMP) besides other signaling pathways. Panther classified the most regulated genes into 5, 9 and 3 groups according to their molecular function (Fig. 4a), biologic process (Fig. 4b) and cellular component (Fig. 4c), respectively. The majority of genes were linked to binding (44.5%) and catalytic activity (22.2%) (Fig. 4a). Cellular process and response to stimulus were represented by 23.1% and 19.2% of the genes, respectively (Fig. 4b). The majority of the genes were related to the extracellular region (50.0%) and extracellular matrix (37.5%) (Fig. 4c).
Table 2.
Genes with at least 10x changes in oral fibroblasts exposed to ABL.
| Gene Symbol | Regulation | Fold Change |
|---|---|---|
| IL11 | up | 85.5 |
| IL33 | up | 30.3 |
| MMP10 | up | 24.5 |
| NOX4 | up | 20.5 |
| ADAMTS5 | up | 20.4 |
| MMP13 | up | 19.2 |
| PRG4 | up | 17.0 |
| BMP2 | up | 16.2 |
| COMP | up | 14.1 |
| INHBA | up | 14.0 |
| AREG | up | 13.5 |
| COL10A1 | up | 13.3 |
| CXCL5 | up | 12.7 |
| PMEPA1 | up | 12.5 |
| TSPAN13 | up | 12.5 |
| GPR183 | up | 12.0 |
| ESM1 | up | 10.3 |
| PTX3 | down | 16.6 |
Figure 4.
Acid bone lysate (ABL) provokes changes in gene expression based on gene arrays. Eighteen genes were at least 10-fold up- and down-regulated by ABL (Table 2). Panther analysis of molecular function (a) biological process (b) and cellular component (c) of most regulated genes in oral fibroblasts by ABL.
ABL incites changes in gene expression via activation of TGF-β signalling
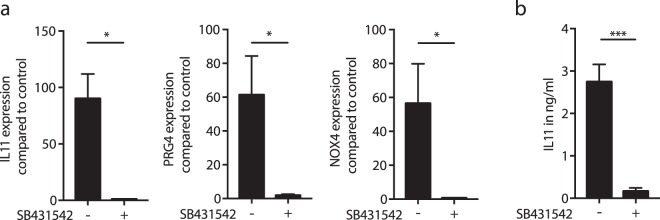
In a pilot experiment with the gene array (n = 1), SB431542 blocked the expression of all 17 highly up-regulated genes to less than 2-fold, except for ESM1 (3.3-fold) and CXCL5 (5.1-fold) suggesting that the TGF-β receptor I kinase mediates the respective effect of ABL (Suppl. Table 3). In support of the gene array, RT-PCR and immunoassay confirmed the increased expression of IL11, PRG4, and NOX4 by ABL and also their suppression by SB431542 (Fig. 5a). At protein level, ABL increased IL11 release into the cell-culture supernatant and these effects were blocked by SB431542 (Fig. 5b). Further proof for activation of TGF-β signalling comes from gingival fibroblasts exposed to ABL showing increased phosphorylation of Smad3 (Fig. 6a) and an accumulation of Smad2/3 in the nucleus (Fig. 6b).
Figure 5.
Acid bone lysate (ABL) changes the expression of selected genes via TGF-β signaling. Addition of TGF- β receptor 1 kinase antagonist SB431542 to ABL blocks the expression of the selected genes (a). Immunoassay of IL11 supports the previous findings at the protein level (b). N = 3–5. Data represent the mean ± SD. *P < 0.05, ***P < 0.001, by two-tailed Mann-Whitney test.
Figure 6.
Acid bone lysate (ABL) activates TGF-β-Smad2/3 signaling in primary oral fibroblasts. Incubation of gingival fibroblasts with ABL also caused an increased phosphorylation of Smad3 (a). Representative immunofluorescence confirmed the translocation of Smad2/3 into the nucleus upon stimulation with ABL (b). Treatment with 10 ng/ml of TGF-β was used as a positive control.
ABL from various sources supports TGF-β signalling
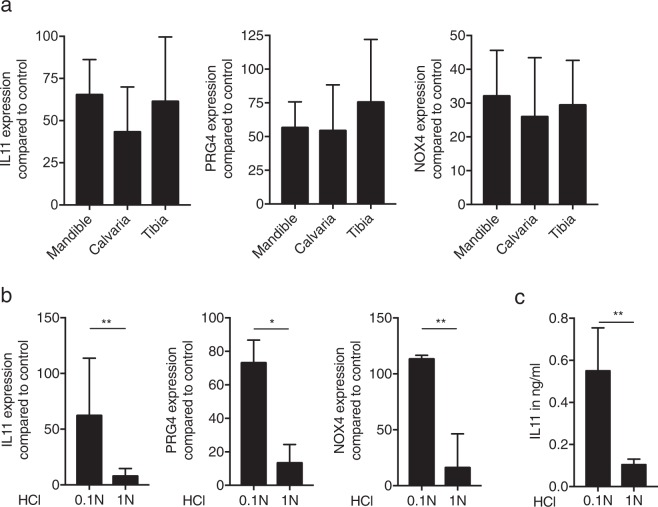
To understand if the embryologic origin of bone affects the activity of the respective ABL, bone chips were prepared from the mandible, the calvaria and the tibia25. All three independent preparations stimulated the expression of IL11, PRG4 and NOX4 in oral fibroblasts (Fig. 7a). Moreover, ABL prepared by 0.1 N HCl was most effective compared to lysates obtained with 0.01 N (data not shown), 1.0 N HCl (Fig. 7b) and also to lysates prepared with sodium tartrate buffer at pH 4.7 (Suppl. Fig. 2). In support of the RT-PCR, immunoassay confirmed the higher amount of IL11 in lysates obtained with 0.1 N (Fig. 7c).
Figure 7.
Acid bone lysate (ABL) obtained from mandible, calvaria and tibia produces an equivalent gene expression and TGF-β activity is highly dependent on hydrochloric acid concentration. ABL obtained from different sources (mandible, calvaria and tibia) produces a similar response on selected genes (a). ABL prepared with 0.1 N hydrochloric acid induces a higher TGF-β activity at mRNA level (b). Immunoassay of IL11 confirmed the higher activity of TGF-β at protein level with 0.1 N ABL (c). N = 3–5. Data represent the mean ± SD. P > 0.05, by Kruskal-Wallis test with Dunn’s multiple comparisons correction, *P < 0.05, **P < 0.01, by two-tailed Mann-Whitney test.
ABL decreases osteogenic and adipogenic differentiation markers
In agreement with our previous work17, exposure of osteogenic calvaria cells and adipogenic 3T3-L1 cells to ABL caused a considerable decrease of the marker genes alkaline phosphatase (ALP) and osteocalcin (OC) (Fig. 8a), as well as PPARγ and C/EBP (Fig. 8b), respectively. Chondrogenic ATDC5 cells showed a moderate increase of SOX9 and COL10A (Fig. 8c). Histochemical staining of alkaline phosphatase activity confirmed the findings from gene expression (Fig. 8d).
Figure 8.
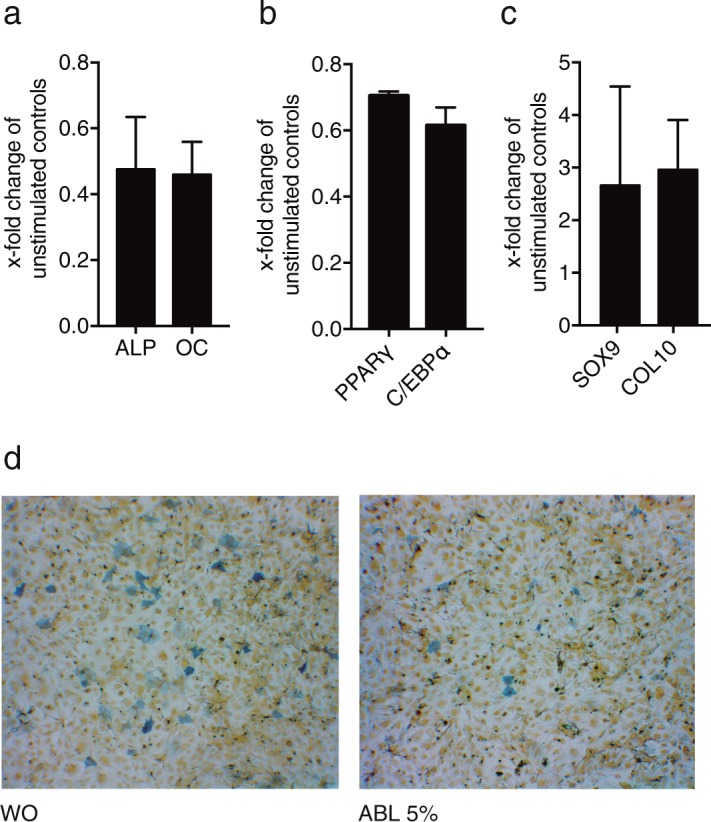
Acid bone lysate (ABL) decreases osteogenic and adipogenic differentiation. Exposure of osteogenic calvaria cells and adipogenic 3T3-L1 cells to ABL caused a considerable decrease of the marker genes alkaline phosphatase (ALP) and osteocalcin (OC) (a), as well as PPARγ and C/EBP (b), respectively. Chondrogenic ATDC5 cells showed a moderate increase of SOX9 and COL10 (c). Histochemical staining of alkaline phosphatase activity confirmed the findings from gene expression in osteogenic calvaria cells (d). N = 3–5. Data represent the mean ± SD.
Discussion
Bone is a rich source of growth factors that are released by osteoclasts during remodeling14,15, fracture healing26, but also during the preparation of demineralized bone matrix. Previous immunoassays5–8 and today’s proteomic analysis9,10 revealed the composition of growth factors and other molecules stored within the bone matrix. If, however, the respective growth factors released by HCl can induce a cellular response remained unclear. The study described herein revealed that, although ABL contains a large spectrum of proteins including growth factors, all 17 genes most strongly up-regulated by ABL in oral fibroblasts, including IL11, NOX4 and PRG4, required activation of the TGF-β receptor type I kinase. In support of TGF-β receptor type I kinase signalling, ABL activated phosphorylation and nuclear accumulation of Smad3. Thus, demineralization by HCl caused the release of TGF-β into the acid bone lysate that is biologically active based on a panel of in vitro assays.
Our findings confirm previous observations that bone is a rich source of TGF-β15–8, with a concentration of around 0.5 ng/ml in bone lysates of different skeletal areas5. Moreover, TGF-β being stored in the bone matrix in its latent form can be activated by low pH27. Also in line with our findings is that TGF-β of demineralized bone matrix maintains its activity28. In vital bone, TGF-β1 released by osteoclasts during bone remodeling controls migration of mesenchymal stem cells14,15 and also acts on osteoclasts16. Our pioneering research shows that TGF-β1 released during the preparation of demineralized bone matrix caused a major increase of TGF-β target genes, including IL11, NOX4 and PRG4. Support for this conclusion comes from our findings that in the presence of a TGF-β receptor I kinase inhibitor, ABL failed to change gene expression. These data are in support of previous research on BCM21 and enamel matrix derivative19 which also induces the expression of IL11, NOX4 and PRG4 mediated by TGF-β receptor type I kinase activity. Further confirmation for the activation of TGF-β signaling, comes from our observations that ABL increased phosphorylation and nuclear accumulation of Smad2/3, similar to research with recombinant TGF-β129. Taken together, ABL holds a TGF-β activity as indicated by our bioassays with oral fibroblasts.
As a consequence of the TGF-β activity, based on our gene array approach, IL11, NOX4 and PRG4 were highly increased in oral fibroblasts by ABL. Considering that TGF-β activity is removed from bone grafts during demineralization, the question arises whether this change in gene expression has a biological or even clinical relevance. Clearly this is speculation but nevertheless these genes are involved in bone regeneration and wound healing. IL11 is a member of the IL6 family of cytokines and has been regarded as a target gene to investigate down-stream TGF-β signalling pathways in lung fibroblasts30, periodontal ligament and gingival fibroblasts31 and together with BMP-2, can accelerate bone regeneration32. NOX4 generates intracellular superoxide and also modulates osteoblasts BMP-2 activity33. Hydrogen peroxide34 reduces osteoblast differentiation and expression of alkaline phosphatase35 but it remains unclear if this mechanism explains our observations that ABL lowered osteogenic differentiation. PRG4 is expressed in the superficial zone of articular cartilage36 and supports endochondral bone formation37. Thus, considering that HCl lowers TGF-β from bone and that TGF-β target genes play a role in bone regeneration and remodeling, allografts likely possess a diminished capacity to use TGF-β signalling for graft consolidation. Moreover, whether the ABL-mediated increase of IL11, NOX4 and PRG4 expression has an impact on bone regeneration needs to be determined in appropriate animal models.
The clinical relevance of the present findings, therefore, may be related to the difference between bone autografts and allografts. While autografts are rich in TGF-β and other growth factors being stored in the bone matrix, demineralized bone matrix presumably contains only remnants of active TGF-β38. Moreover, HCl can deactivate pH sensitive growth factors in the demineralized bone matrix39. So overall, allografts are left with the growth factors that remain in the bone matrix while autografts that are rich in growth factors being liberated by osteoclasts. Can our observation now explain possible differences in the clinical behavior of autografts and allografts? On the one hand, TGF-β1 released during bone remodeling induces migration of mesenchymal stem cells14,15 and targets osteoclasts16, and exogenous TGF-β supports bone regeneration in the dog humerus40. On the other hand, however, TGF-β inhibited bone formation in rat bone chambers41 and mandibular defects42. TGF-β signalling also drives scar formation during wound healing43. In support for the latter concept are our findings that ABL considerably reduced osteogenic differentiation of calvaria cells, similar to TGF-β44 and bone BCM17 in MC3T3E1. Moreover, BCM loaded onto a collagen membrane can reduce bone formation in rat calvaria defects45. Thus, the clinical relevance of the present data has to be interpreted with caution, particularly with respect to the role of TGF-β1 released from bone grafts during graft consolidation. It is also not known if it is the content of TGF-β that explains the differential healing capacity of autografts and allografts in vivo.
Many questions remain to be answered. For example, whether ABL reflects the growth factors released by osteoclasts during resorption of autografts. Osteoclasts work at around pH 4 and can liberate growth factors by demineralization and their protease activity46. Our results showed that ABL prepared with a tartrate buffer at pH 4.7 moderately increased the expression of IL11 and NOX4 but not of PRG4, in contrast to the robust activation of TGF-β target genes obtained with ABL prepared with 0.1 M HCl. Osteoclasts might however activate latent TGF-β by proteases not being simulated in our experiment11,47. Considering that bone chips release TGF-β activity even at a neutral pH17, it remains unclear if the tartrate buffer liberates growth factors by decalcification of the bone matrix. Therefore, the data have to be interpreted with caution. Furthermore, it would be interesting to understand the response of cells other than those of the mesenchymal lineage including macrophages48 and endothelial cells49 that play a role during bone regeneration and thus graft consolidation. Our proteomic analysis, besides the work of others10, revealed a large spectrum of proteins that are released into ABL. Even though the most strongly regulated genes in oral fibroblasts are the consequence of TGF-β signalling, the possible cellular response to other growth factors and bioactive molecules within the ABL remain to be discovered. Another interesting approach would be to perform bone transplantation using mouse models with an osteoblast-specific TGF-β knock out50. This research can provide the scientific basis to refine protocols aiming to maintain growth factors and their activity during the preparation of allografts.
In conclusion, TGF-β is the major growth factor removed during the preparation of demineralized bone matrix that caused a robust activation of the respective signaling pathway in oral fibroblasts. These findings might provide a possible explanation to distinguish the performance of autografts and allografts at sites of bone augmentation.
Methods
Acid bone lysate
Bone was obtained from adult pigs within 6 h post-mortem (Fleischerei Leopold Hödl, Vienna, Austria). Bone chips were harvested from the mandible, calvaria, and tibia with a bone scraper (Hu-Friedy, Rotterdam, the Netherlands). Bone chips were washed with Dulbecco’s modified Eagle medium (DMEM) supplemented with antibiotics (Invitrogen Corporation, Carlsbad, CA, USA). Five grams of wet bone chips were incubated while being stirred with 50 ml of 0.01, 0.1 and 1.0 N HCl (10% weight/volume) or alternatively with 10 mM sodium tartrate buffer (pH 4.7) at room temperature. ABL was harvested after 16 h, centrifuged, and pH neutralized. After another centrifugation, ABL was filtered sterile and kept frozen at −20 °C. The stocks were thawed immediately before each experiment.
Cell culture
Human gingiva was harvested from extracted wisdom teeth from patients who had given informed and written consent. An approval was obtained from the Ethics Committee of the Medical University of Vienna (EK NR 631/2007), Vienna, Austria. All experiments were performed in accordance with relevant guidelines and regulations. A total of three strains of fibroblasts were established by explant cultures and fewer than 10 passages were used for the experiments. Calvaria-derived osteoblasts were obtained according to a standard protocol previously described51. Briefly, mouse pups less than 5 days old were euthanized and their calvaria collagenase digested through a series of sequential digestions. The first 2 digests were discarded, and the subsequent digests were pooled and plated. The 3T3-L1 cell line was obtained from Christian Wolfrum (ETH Zürich, Zürich, Switzerland). Cells were seeded at a concentration of 30,000 cells/cm² onto culture dishes one day prior to stimulation. If not otherwise indicated, cells were exposed to 5% ABL in serum-free medium for 16 h. The inhibitor for the TGF-βRI kinase, SB431542 (Calbiochem, Merck, Billerica, MA, USA) was used at 10 µM.
Cell differentiation
For osteogenic differentiation, calvaria cells were incubated in growth medium containing 50 μg/mL ascorbic acid and 10 mM beta glycerophosphate. For adipogenic differentiation, 3T3-L1 cells were incubated in growth medium containing 0.5 mM 1-methyl-3-isobutylxanthine (Sigma, St. Louis, MO, USA), 1 μM dexamethasone (Sigma) and 1 μg/mL insulin (Calbiochem, Merck Millipore), 10 μM indomethacin (Sigma), and 10 μM rosiglitazone (Sigma)52. Alkaline phosphatase staining was performed after 3 days. For histochemical staining of alkaline phosphatase, cells were fixed as indicated and incubated with a substrate solution containing naphthol AS-TR phosphate and fast blue BB salt (Sigma)53. After rinsing with distilled water, cultures were photographed.
Cell viability
For viability experiments, gingival fibroblasts were incubated overnight with ABL at the indicated concentrations. MTT (3-[4,5-dimethythiazol-2-yl]-2,5-diphenyltetrazolium bromide; Sigma) solution at a final concentration of 0.5 mg/ml was added to each well of a microtiter plate (CytoOne) for 2 h at 37 °C. The medium was removed and formazan crystals were solubilized with dimethyl sulfoxide. Optical density was measured at 570 nm. Data were expressed as percentage of optical density in the treatment groups normalized to unstimulated control values. In addition, cell viability was assessed by Live-Dead staining kit from Enzo Life Sciences AG (Lausen, Switzerland).
Mass spectrometry
Extracted proteins were precipitated using methanol/dichloromethane and digested with trypsin as described earlier54 (For detail see Suppl. Methods). Briefly, precipitated proteins were dissolved in 50 mM triethylammonium bicarbonate, and protein concentration was determined using the DeNovix DS-11 Microvolume Spectrophotometer (Wilmington, USA). Proteins were digested overnight at 37 °C using a trypsin/protein ratio of 1:50. Peptides were separated on a C18 µPAC (µ-Pillar-Arrayed-Column, PharmaFluidics, Gent, Belgium) using a nano RSLC UltiMate3000 (ThermoScientific, Vienna, Austria) separation system and detected with a Q-Exactive Plus Biopharma mass spectrometer.
A user defined injection program was used for sample injection and additional injector and trap column wash. Every sample injection was followed by two blank runs with injections of 2,2,2-trifluoroethanol for removal of possible samples remaining in the injector or on the trap column and prevention of carryover in the separation system. All database searches were performed using the in-house Mascot 2.6 and the most recent version of the Sus scrofa SwissProt database. All search results were refined and researched using Scaffold 4.6.5 (Proteome Software, Portland, OR). For the classification of the proteins the Panther system Version 13.1 (http://pantherdb.org) was used55. To predict protein-protein interactions String database was used56 (https://string-db.org). The mass spectrometry proteomics data have been deposited to the ProteomeXchange Consortium via the PRIDE57 partner repository with the dataset identifier PXD010145 and 10.6019/PXD010145”.
Microarray analysis
Total RNA was harvested with the RNA Isolation Kit (Extractme, BLIRT S.A., Gdańsk, Poland). RNA quality was determined using the Agilent 2100 Bioanalyzer (Agilent Technologies, Santa Clara, CA, USA). Microarray analysis was performed using the SurePrint G3 Human Gene Expression v2 Microarray (Agilent Technologies, Santa Clara, CA, USA). Array image acquisition was performed with the Agilent G2505B Microarray Scanner and Feature Extraction software version 9.5 (Agilent). Background-corrected fluorescence intensity values were imported into GeneSpring v.15, log2-transformed, and then normalized by quantile normalization. A filtering step was applied in order to reduce the number of multiple hypotheses. Only genes for which at least 100% of the values in one of the two evaluated conditions were above the 60th percentile were used for further analysis. Differentially expressed mRNAs were identified by paired t-tests in GeneSpring. The resulting p-values were corrected for multiplicity by applying Benjamini-Hochberg adjustment to all p-values calculated for a time point with a false discovery rate (FDR) < 5%58. Genes with an adjusted p-value < 0.05 were considered significant.
RT-PCR and immunoassay
Reverse transcription (RT) was performed with the SensiFAST™ cDNA Synthesis Kit (Bioline Reagents Ltd., London, UK). RT-PCR was done with SensiFAST™ SYBR® Kit using manufacturer’s instructions (Bioline). Amplification was performed with the StepOnePlus Real-Time PCR System (Applied Biosystems, Life Technologies, Carlsbad, CA, USA). Primer sequences are given in Table 1. Relative gene expression was calculated with the delta delta CT method. Reactions were run in duplicates. The supernatant was analyzed for IL11 and TGF-β1 using an immunoassay assay according to the manufacturer’s instructions (R&D Systems, Minneapolis, MN, USA).
Table 1.
Primer sequences.
| Sequence_F | Sequence_R | |
|---|---|---|
| hGAPDH | aag cca cat cgc tca gac ac | gcc caa tac gac caa atc c |
| hPRG4 | cag ttg cag gtg gca tct c | tcg tga ttc agc aag ttt cat c |
| hNOX4 | tct tgg ctt acc tcc gag ga | ctc ctg gtt ctc ctg ctt gg |
| hIL11 | gga cag gga agg gtt aaa gg | gct cag cac gac cag gac |
| mbactin | cta agg cca acc gtg aaa ag | acc aga ggc ata cag gga ca |
| mC/EBP | caa gag ccg aga taa agc caa aca | gtg tcc agt tca cgg ctc ag |
| mCol10 | gca tct ccc agc acc aga | cca tga acc agg gtc aag aa |
| mOC | ctg acc tca cag atg cca ag | gta gcg ccg gag tct gtt c |
| mPPARg | atc atc tac acg atg ctg gcc | ctc cct ggt cat gaa tcc ttg |
| mSox9 | cag caa gac tct ggg caa g | tcc acg aag ggt ctc ttc tc |
| mALP | aac cca gac aca agc att cc | gag aca ttt tcc cgt tca cc |
Western blot
Cell extracts containing SDS buffer and protease inhibitors (PhosSTOP with cOmplete; Sigma, St. Louis, MO, USA) were separated by SDS-PAGE and transferred onto nitrocellulose membranes (Whatman, GE Healthcare, General Electric Company, Fairfield, CT, USA). Membranes were blocked and the binding of the first antibody (rabbit anti-pSmad3 Ser423/425, 1:500, Abcam, ab52903, Cambridge, UK), and actin (Santa Cruz Biotechnology, SCBT, Santa Cruz, CA, USA) was detected with the appropriate secondary antibody directly labeled with near-infrared dyes (LI-COR Biosciences, Lincoln, NE, USA) and visualized with the appropriate imaging system (LI-COR Biosciences). Acquired images were not processed.
Immunofluorescence
Immunofluorescent analysis was performed on human gingival fibroblasts plated onto Millicell® EZ slides (Merck KGaA, Darmstadt, Germany) treated with ABL 5% for 30 min. Cells were fixed in paraformaldehyde and blocked in 1% BSA and 0.3% Triton in PBS at room temperature for 1 hour. Cells were subsequently incubated with Smad2/3 antibody (1:800, D7G7 XP® Rabbit mAb #8685, Cell Signaling, MA, USA) overnight at 4 °C. Alexa Fluor 488 secondary antibody (1:500; Anti-Rabbit, Cell signaling Technology, USA) was applied for 1 hour. Cells were washed and mounted onto glass slides. Fluorescent images were captured at 40x in oil immersion using a Zeiss Axiovert 200 M fluorescent microscope.
Statistical analysis
All experiments were repeated three to five times. Bars show the mean and standard deviation of the cumulative data from all experiments. Statistical analysis was based on Mann-Whitney U test and Kruskal-Wallis test with Dunn’s multiple comparisons correction. Analyses were performed using Prism v7 (GraphPad Software, La Jolla, CA, USA). Significance was set at p < 0.05.
Electronic supplementary material
Acknowledgements
We thank Luiza Matos for her helpful contribution during data collection. Marion Gröger and Sabine Rauscher from Core Facility Imaging at the Medical University of Vienna for their technical assistance with immunofluorescence. Further we thank Markus Jeitler from the Core Facilities Genomics, Medical University of Vienna, for performing the Microarray analysis and Gabriele Haar for technical assistance. This work was funded by a grant from the Osteology Foundation (S-17-003, 17-125 and 17-219). Franz Josef Strauss is supported by a grant from the Osteology Foundation and by the National Commission for Scientific and Technological Research (CONICYT), Chile. Alexandra Stähli received grants from the Swiss Dental Association (288-15), the Swiss Society of Periodontology (SSP), the Foundation for the Promotion of Oral Health and Research as well as the Osteology Foundation. Reinhard Gruber was supported by a grant from the Osteology Foundation (14–126).
Author Contributions
F.J.S. and R.G. designed the study and wrote the main manuscript text. A.S. and F.J.S. performed the experiments and prepared the figures. L.B., G.M. conducted experiments, contributed to the interpretation of the data, preparation of figures and revised the manuscript. V.G., N.H. and G.S. conducted experiments. All authors reviewed the final manuscript and approved the final version.
Data Availability
The datasets generated during and/or analyzed during the current study are available from the corresponding author on reasonable request.
Competing Interests
The authors declare no competing interests.
Footnotes
Publisher’s note: Springer Nature remains neutral with regard to jurisdictional claims in published maps and institutional affiliations.
Electronic supplementary material
Supplementary information accompanies this paper at 10.1038/s41598-018-34418-3.
References
- 1.Friberg B. Bone augmentation for single tooth implants: A review of the literature. Eur J Oral Implantol. 2016;9(Suppl 1):S123–134. [PubMed] [Google Scholar]
- 2.Tuchman A, et al. Iliac Crest Bone Graft versus Local Autograft or Allograft for Lumbar Spinal Fusion: A Systematic Review. Global Spine J. 2016;6:592–606. doi: 10.1055/s-0035-1570749. [DOI] [PMC free article] [PubMed] [Google Scholar]
- 3.Goldberg, V. M. & Stevenson, S. Natural history of autografts and allografts. Clin Orthop Relat Res, 7–16 (1987). [PubMed]
- 4.Gruskin E, Doll BA, Futrell FW, Schmitz JP, Hollinger JO. Demineralized bone matrix in bone repair: history and use. Adv Drug Deliv Rev. 2012;64:1063–1077. doi: 10.1016/j.addr.2012.06.008. [DOI] [PMC free article] [PubMed] [Google Scholar]
- 5.Pfeilschifter J, et al. Concentration of transforming growth factor beta in human bone tissue: relationship to age, menopause, bone turnover, and bone volume. J Bone Miner Res. 1998;13:716–730. doi: 10.1359/jbmr.1998.13.4.716. [DOI] [PubMed] [Google Scholar]
- 6.Hauschka PV, Mavrakos AE, Iafrati MD, Doleman SE, Klagsbrun M. Growth factors in bone matrix. Isolation of multiple types by affinity chromatography on heparin-Sepharose. The Journal of biological chemistry. 1986;261:12665–12674. [PubMed] [Google Scholar]
- 7.Seyedin SM, et al. Cartilage-inducing factor-A. Apparent identity to transforming growth factor-beta. The Journal of biological chemistry. 1986;261:5693–5695. [PubMed] [Google Scholar]
- 8.Seyedin SM, Thomas TC, Thompson AY, Rosen DM, Piez KA. Purification and characterization of two cartilage-inducing factors from bovine demineralized bone. Proceedings of the National Academy of Sciences of the United States of America. 1985;82:2267–2271. doi: 10.1073/pnas.82.8.2267. [DOI] [PMC free article] [PubMed] [Google Scholar]
- 9.Cleland TP, Voegele K, Schweitzer MH. Empirical evaluation of bone extraction protocols. PloS one. 2012;7:e31443. doi: 10.1371/journal.pone.0031443. [DOI] [PMC free article] [PubMed] [Google Scholar]
- 10.Jiang X, et al. Method development of efficient protein extraction in bone tissue for proteome analysis. J Proteome Res. 2007;6:2287–2294. doi: 10.1021/pr070056t. [DOI] [PubMed] [Google Scholar]
- 11.Oursler MJ. Osteoclast synthesis and secretion and activation of latent transforming growth factor beta. J Bone Miner Res. 1994;9:443–452. doi: 10.1002/jbmr.5650090402. [DOI] [PubMed] [Google Scholar]
- 12.Pfeilschifter J, Mundy GR. Modulation of type beta transforming growth factor activity in bone cultures by osteotropic hormones. Proceedings of the National Academy of Sciences of the United States of America. 1987;84:2024–2028. doi: 10.1073/pnas.84.7.2024. [DOI] [PMC free article] [PubMed] [Google Scholar]
- 13.Oreffo RO, Mundy GR, Seyedin SM, Bonewald LF. Activation of the bone-derived latent TGF beta complex by isolated osteoclasts. Biochem Biophys Res Commun. 1989;158:817–823. doi: 10.1016/0006-291X(89)92795-2. [DOI] [PubMed] [Google Scholar]
- 14.Tang Y, et al. TGF-beta1-induced migration of bone mesenchymal stem cells couples bone resorption with formation. Nat Med. 2009;15:757–765. doi: 10.1038/nm.1979. [DOI] [PMC free article] [PubMed] [Google Scholar]
- 15.Crane JL, Cao X. Bone marrow mesenchymal stem cells and TGF-beta signaling in bone remodeling. J Clin Invest. 2014;124:466–472. doi: 10.1172/JCI70050. [DOI] [PMC free article] [PubMed] [Google Scholar]
- 16.Weivoda MM, et al. Osteoclast TGF-beta Receptor Signaling Induces Wnt1 Secretion and Couples Bone Resorption to Bone Formation. J Bone Miner Res. 2016;31:76–85. doi: 10.1002/jbmr.2586. [DOI] [PMC free article] [PubMed] [Google Scholar]
- 17.Peng J, et al. Bone-Conditioned Medium Inhibits Osteogenic and Adipogenic Differentiation of Mesenchymal Cells In Vitro. Clin Implant Dent Relat Res. 2015;17:938–949. doi: 10.1111/cid.12200. [DOI] [PubMed] [Google Scholar]
- 18.Stahli A, Bosshardt D, Sculean A, Gruber R. Emdogain-regulated gene expression in palatal fibroblasts requires TGF-betaRI kinase signaling. PloS one. 2014;9:e105672. doi: 10.1371/journal.pone.0105672. [DOI] [PMC free article] [PubMed] [Google Scholar]
- 19.Stahli A, Miron RJ, Bosshardt DD, Sculean A, Gruber R. Collagen Membranes Adsorb the Transforming Growth Factor-beta Receptor I Kinase-Dependent Activity of Enamel Matrix Derivative. Journal of periodontology. 2016;87:583–590. doi: 10.1902/jop.2016.150538. [DOI] [PubMed] [Google Scholar]
- 20.Caballe-Serrano J, et al. Collagen barrier membranes adsorb growth factors liberated from autogenous bone chips. Clinical oral implants research. 2017;28:236–241. doi: 10.1111/clr.12789. [DOI] [PubMed] [Google Scholar]
- 21.Zimmermann M, et al. Bone-Conditioned Medium Changes Gene Expression in Bone-Derived Fibroblasts. The International journal of oral & maxillofacial implants. 2015;30:953–958. doi: 10.11607/jomi.4060. [DOI] [PubMed] [Google Scholar]
- 22.Caballe-Serrano J, Bosshardt DD, Buser D, Gruber R. Proteomic analysis of porcine bone-conditioned medium. The International journal of oral & maxillofacial implants. 2014;29:1208–1215d. doi: 10.11607/jomi.3708. [DOI] [PubMed] [Google Scholar]
- 23.Nakao A, et al. TGF-beta receptor-mediated signalling through Smad2, Smad3 and Smad4. EMBO J. 1997;16:5353–5362. doi: 10.1093/emboj/16.17.5353. [DOI] [PMC free article] [PubMed] [Google Scholar]
- 24.Laping NJ, et al. Inhibition of transforming growth factor (TGF)-beta1-induced extracellular matrix with a novel inhibitor of the TGF-beta type I receptor kinase activity: SB-431542. Mol Pharmacol. 2002;62:58–64. doi: 10.1124/mol.62.1.58. [DOI] [PubMed] [Google Scholar]
- 25.Hatami Kia B, Mendes JRG, Muller HD, Heimel P, Gruber R. Bone-Conditioned Medium Obtained From Calvaria, Mandible, and Tibia Cause an Equivalent TGF-beta1 Response In Vitro. J Craniofac Surg. 2018;29:553–557. doi: 10.1097/SCS.0000000000004251. [DOI] [PubMed] [Google Scholar]
- 26.Einhorn TA, Gerstenfeld LC. Fracture healing: mechanisms and interventions. Nat Rev Rheumatol. 2015;11:45–54. doi: 10.1038/nrrheum.2014.164. [DOI] [PMC free article] [PubMed] [Google Scholar]
- 27.Lyons RM, Keski-Oja J, Moses HL. Proteolytic activation of latent transforming growth factor-beta from fibroblast-conditioned medium. J Cell Biol. 1988;106:1659–1665. doi: 10.1083/jcb.106.5.1659. [DOI] [PMC free article] [PubMed] [Google Scholar]
- 28.Puolakkainen PA, Ranchalis JE, Strong DM, Twardzik DR. The effect of sterilization on transforming growth factor beta isolated from demineralized human bone. Transfusion. 1993;33:679–685. doi: 10.1046/j.1537-2995.1993.33893342752.x. [DOI] [PubMed] [Google Scholar]
- 29.Fink SP, Mikkola D, Willson JK, Markowitz S. TGF-beta-induced nuclear localization of Smad2 and Smad3 in Smad4 null cancer cell lines. Oncogene. 2003;22:1317–1323. doi: 10.1038/sj.onc.1206128. [DOI] [PubMed] [Google Scholar]
- 30.Elias, J. A. et al. IL-1 and transforming growth factor-beta regulation of fibroblast-derived IL-11. J Immunol152, 2421–2429 (1994). [PubMed]
- 31.Yashiro R, et al. Transforming growth factor-beta stimulates interleukin-11 production by human periodontal ligament and gingival fibroblasts. Journal of clinical periodontology. 2006;33:165–171. doi: 10.1111/j.1600-051X.2006.00898.x. [DOI] [PubMed] [Google Scholar]
- 32.Suga K, et al. Synergism between interleukin-11 and bone morphogenetic protein-2 in the healing of segmental bone defects in a rabbit model. J Interferon Cytokine Res. 2004;24:343–349. doi: 10.1089/107999004323142204. [DOI] [PubMed] [Google Scholar]
- 33.Mandal CC, et al. Reactive oxygen species derived from Nox4 mediate BMP2 gene transcription and osteoblast differentiation. The Biochemical journal. 2011;433:393–402. doi: 10.1042/BJ20100357. [DOI] [PMC free article] [PubMed] [Google Scholar]
- 34.Schroder K. NADPH oxidases in bone homeostasis and osteoporosis. Cell Mol Life Sci. 2015;72:25–38. doi: 10.1007/s00018-014-1712-2. [DOI] [PMC free article] [PubMed] [Google Scholar]
- 35.Atashi F, Modarressi A, Pepper MS. The role of reactive oxygen species in mesenchymal stem cell adipogenic and osteogenic differentiation: a review. Stem Cells Dev. 2015;24:1150–1163. doi: 10.1089/scd.2014.0484. [DOI] [PMC free article] [PubMed] [Google Scholar]
- 36.Rhee DK, et al. The secreted glycoprotein lubricin protects cartilage surfaces and inhibits synovial cell overgrowth. The Journal of clinical investigation. 2005;115:622–631. doi: 10.1172/JCI22263. [DOI] [PMC free article] [PubMed] [Google Scholar]
- 37.Novince CM, et al. Proteoglycan 4: a dynamic regulator of skeletogenesis and parathyroid hormone skeletal anabolism. Journal of bone and mineral research: the official journal of the American Society for Bone and Mineral Research. 2012;27:11–25. doi: 10.1002/jbmr.508. [DOI] [PMC free article] [PubMed] [Google Scholar]
- 38.Filho GS, et al. Conditioned medium of demineralized freeze-dried bone activates gene expression in periodontal fibroblasts in vitro. Journal of periodontology. 2015;86:827–834. doi: 10.1902/jop.2015.140676. [DOI] [PubMed] [Google Scholar]
- 39.Rehfeldt F, Engler AJ, Eckhardt A, Ahmed F, Discher DE. Cell responses to the mechanochemical microenvironment–implications for regenerative medicine and drug delivery. Adv Drug Deliv Rev. 2007;59:1329–1339. doi: 10.1016/j.addr.2007.08.007. [DOI] [PMC free article] [PubMed] [Google Scholar]
- 40.Sumner DR, et al. Locally delivered rhTGF-beta2 enhances bone ingrowth and bone regeneration at local and remote sites of skeletal injury. J Orthop Res. 2001;19:85–94. doi: 10.1016/S0736-0266(00)00015-2. [DOI] [PubMed] [Google Scholar]
- 41.Aspenberg P, Jeppsson C, Wang JS, Bostrom M. Transforming growth factor beta and bone morphogenetic protein 2 for bone ingrowth: a comparison using bone chambers in rats. Bone. 1996;19:499–503. doi: 10.1016/S8756-3282(96)90257-4. [DOI] [PubMed] [Google Scholar]
- 42.Zellin G, Beck S, Hardwick R, Linde A. Opposite effects of recombinant human transforming growth factor-beta 1 on bone regeneration in vivo: effects of exclusion of periosteal cells by microporous membrane. Bone. 1998;22:613–620. doi: 10.1016/S8756-3282(98)00059-3. [DOI] [PubMed] [Google Scholar]
- 43.Roberts AB, Russo A, Felici A, Flanders KC. Smad3: a key player in pathogenetic mechanisms dependent on TGF-beta. Ann N Y Acad Sci. 2003;995:1–10. doi: 10.1111/j.1749-6632.2003.tb03205.x. [DOI] [PubMed] [Google Scholar]
- 44.Noda M, Rodan GA. Type-beta transforming growth factor inhibits proliferation and expression of alkaline phosphatase in murine osteoblast-like cells. Biochem Biophys Res Commun. 1986;140:56–65. doi: 10.1016/0006-291X(86)91057-0. [DOI] [PubMed] [Google Scholar]
- 45.Kuchler U, et al. Bone-conditioned medium modulates the osteoconductive properties of collagen membranes in a rat calvaria defect model. Clin Oral Implants Res. 2018 doi: 10.1111/clr.13133. [DOI] [PubMed] [Google Scholar]
- 46.Blair HC, Kahn AJ, Crouch EC, Jeffrey JJ, Teitelbaum SL. Isolated osteoclasts resorb the organic and inorganic components of bone. J Cell Biol. 1986;102:1164–1172. doi: 10.1083/jcb.102.4.1164. [DOI] [PMC free article] [PubMed] [Google Scholar]
- 47.Xu X, et al. Transforming growth factor-β in stem cells and tissue homeostasis. Bone Research. 2018;6:2. doi: 10.1038/s41413-017-0005-4. [DOI] [PMC free article] [PubMed] [Google Scholar]
- 48.Alexander KA, et al. Osteal macrophages promote in vivo intramembranous bone healing in a mouse tibial injury model. J Bone Miner Res. 2011;26:1517–1532. doi: 10.1002/jbmr.354. [DOI] [PubMed] [Google Scholar]
- 49.Sivaraj KK, Adams RH. Blood vessel formation and function in bone. Development. 2016;143:2706–2715. doi: 10.1242/dev.136861. [DOI] [PubMed] [Google Scholar]
- 50.Kuchler U, et al. Bone-conditioned medium modulates the osteoconductive properties of collagen membranes in a rat calvaria defect model. Clinical oral implants research. 2018;29:381–388. doi: 10.1111/clr.13133. [DOI] [PubMed] [Google Scholar]
- 51.Taylor, S. E. B., Shah, M. & Orriss, I. R. Generation of rodent and human osteoblasts. Bonekey Rep3, 10.1038/bonekey.2014.80 (2014). [DOI] [PMC free article] [PubMed]
- 52.Zebisch K, Voigt V, Wabitsch M, Brandsch M. Protocol for effective differentiation of 3T3-L1 cells to adipocytes. Analytical biochemistry. 2012;425:88–90. doi: 10.1016/j.ab.2012.03.005. [DOI] [PubMed] [Google Scholar]
- 53.Gruber R, Kandler B, Fischer MB, Watzek G. Osteogenic differentiation induced by bone morphogenetic proteins can be suppressed by platelet-released supernatant in vitro. Clinical oral implants research. 2006;17:188–193. doi: 10.1111/j.1600-0501.2005.01216.x. [DOI] [PubMed] [Google Scholar]
- 54.Fichtenbaum A, Schmid R, Mitulovic G. Direct injection of HILIC fractions on the reversed-phase trap column improves protein identification rates for salivary proteins. Electrophoresis. 2016;37:2922–2929. doi: 10.1002/elps.201600222. [DOI] [PubMed] [Google Scholar]
- 55.Mi H, Poudel S, Muruganujan A, Casagrande JT, Thomas PD. PANTHER version 10: expanded protein families and functions, and analysis tools. Nucleic Acids Res. 2016;44:D336–342. doi: 10.1093/nar/gkv1194. [DOI] [PMC free article] [PubMed] [Google Scholar]
- 56.Szklarczyk D, et al. The STRING database in 2017: quality-controlled protein-protein association networks, made broadly accessible. Nucleic Acids Res. 2017;45:D362–D368. doi: 10.1093/nar/gkw937. [DOI] [PMC free article] [PubMed] [Google Scholar]
- 57.Vizcaino JA, et al. 2016 update of the PRIDE database and its related tools. Nucleic Acids Res. 2016;44:D447–456. doi: 10.1093/nar/gkv1145. [DOI] [PMC free article] [PubMed] [Google Scholar]
- 58.Benjamini Y, Hochberg Y. Controlling the False Discovery Rate: A Practical and Powerful Approach to Multiple Testing. Journal of the Royal Statistical Society. Series B (Methodological) 1995;57:289–300. [Google Scholar]
Associated Data
This section collects any data citations, data availability statements, or supplementary materials included in this article.
Supplementary Materials
Data Availability Statement
The datasets generated during and/or analyzed during the current study are available from the corresponding author on reasonable request.


