Abstract.
A standard growth chart is indispensable for evaluating an individual’s growth. In Japan, the cross-sectional growth chart from fiscal year 2000 is most commonly used in the clinical setting. However, when using the current standard growth chart to assess growth during puberty, two problems are encountered. First, the individual pubertal height trajectory does not fit the cross-sectional growth chart because the pubertal height curve of individuals rises more sharply than that indicated by the cross-sectional growth chart. Second, variations in the timing of an individuals’ growth spurt render it difficult or impossible to assess individual growth patterns using a single chart. To address these two issues, new growth charts were established using height measurements of 6744 boys and 6929 girls born between April 1975 and March 1976 in the Akita Prefecture. Individuals whose age at peak height velocity (agePHV) was 2 standard deviation greater or lesser than the mean were excluded, and the remaining participants were divided into three groups according to the first and third quartiles of agePHV. Finally, we established three longitudinal growth charts each for boys and girls based on a healthy Japanese population.
Keywords: longitudinal growth chart, pubertal timing, puberty, LMS method
Introduction
A standard growth chart is indispensable for evaluating an individual’s growth. A comparison of individual growth curves with the standard chart values can lead to the early identification of diseases or prediction of disease onset. In Japan, the standard for height based on cross-sectional data from fiscal year 2000 is most commonly used in the clinical setting (1). Moreover, there are disease-specific Japanese growth standards for Turner, Prader-Willi, Down, and Noonan syndromes using the cross-sectional method (2,3,4,5). A longitudinal standard for height published in 1992 referred to as Suwa’s chart is also available (6). Suwa’s chart is represented by a single curve because participants with average pubertal timing were drawn out.
Two problems are encountered when assessing growth during puberty using the current standard growth chart. First, the individual pubertal height trajectory does not fit the cross-sectional growth chart because the pubertal height curve of individuals rises more sharply than that indicated by the cross-sectional growth chart. Second, variations in the timing of an individuals’ growth spurt render it difficult or impossible to assess individual growth patterns using a single chart, even if it is longitudinal.
Recently, the LMS method was used in several studies to establish age-appropriate standard values (1, 2, 5, 7,8,9,10,11,12). This method normalizes raw data using the Box-Cox power transformation, as first proposed by Cole et al. in 1992 (13). L, M, and S values represent the skewness, median, and coefficient of variation, respectively, and these values are smoothed with cubic splines.
The present study aimed to formulate longitudinal standards for height and height velocity (HV) corresponding to pubertal timing using the LMS method to rectify the problems with the current height standards.
Participants and Method
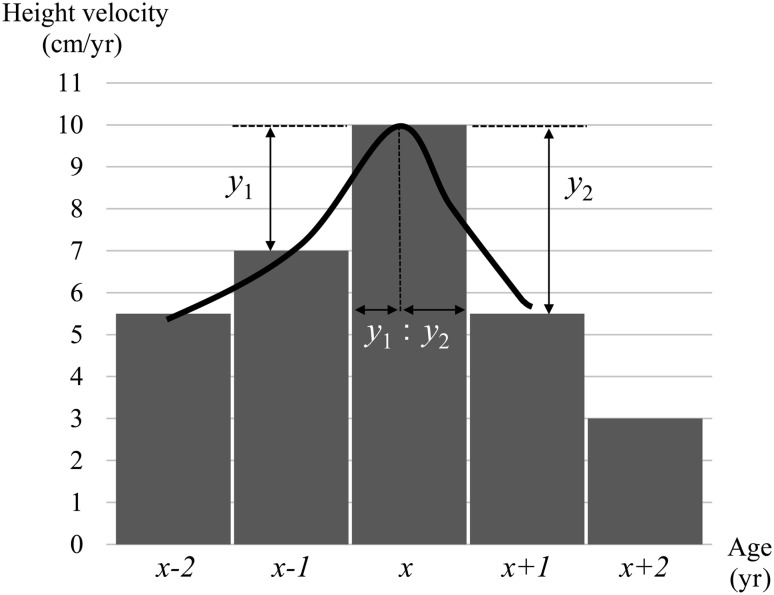
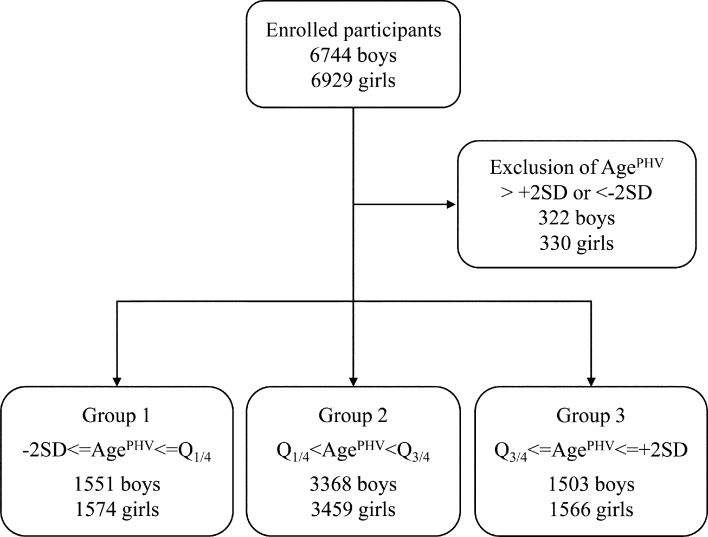
The new charts were established using the height measurements of 6744 boys and 6929 girls born between April 1975 and March 1976 in the Akita Prefecture. Each individual aged 6–18 measured at least 11 consecutive times. Height measurements were conducted annually in April. The difference in height between two age points, which are 1-yr apart, was calculated as HV, and peak HV (PHV) was defined as the maximum value of HV. Age at PHV (agePHV) was estimated based on the difference between PHV and HV in the 1 yr before/after the age at PHV. AgePHV was calculated using the formula x–[y2/(y1+y2)], where x, y1, and y2 are defined as the age at PHV, absolute value of the difference between PHV and HV at 1 yr before the age at PHV, and absolute value of the difference between PHV and HV at 1 yr after the age at PHV, respectively (Fig. 1). Individuals whose agePHV was 2 standard deviation (SD) greater or lesser than the mean were excluded. The remaining participants were divided into three groups according to the first (Q1/4) and third quartiles (Q3/4) of agePHV; group 1: –2SD <= agePHV <= Q1/4, group 2: Q1/4 < agePHV < Q3/4, group 3: Q3/4 <= agePHV <= +2SD. An individual’s agePHV was adjusted to the mean agePHV of each group to establish the standard curves.
Fig. 1.
Method of estimating each agePHV, which was calculated using the formula x–[y2/(y1+y2)]. The solid line represents the assumed curve of height velocity.
The LMSchartmaker Pro version 2.54 (Medical Research Council, London, the UK), which fits smooth centile curves to reference data using the LMS method, was used to obtain the centile curves. The LMS method normalizes raw data using the Box-Cox power transformation. The L, M, and S values represent the skewness, median and coefficient of variation, respectively, and the values are smoothed for each age and gender using cubic splines. Finally, the centile curves are obtained based on these three curves. The Z score of individual height and HV can be calculated with gender- and age-appropriate values for L, M, and S using the following equation: Z score = [(y/M)L–1]/(L×S), and if L = 0, Z score = ln(y/M)/S, where y is defined as individual height or HV.
Data cleaning was performed to establish the standards for height and HV. A scatter plot of age versus height and age versus HV was used to identify the outliers. With respect to HV, if a value was highly unlikely (more than 3 SD from the mean or higher negative values), the raw data were reviewed, and any descriptive errors were corrected. If there was no evidence on the descriptive errors, the points were deleted. Furthermore, we viewed the lower negative values after the agePHV (particularly after the growth reached a plateau) as “zero” to deal with the measurements in the software.
This study was approved by the ethical review board of the Japan Medical Association (management number : 29-9).
Statistics analysis
Height during the first year of elementary school and the third year of high school and the PHV for each group were expressed as mean and SD. Statistical analyses of these data were performed with the Bonferroni correction, and a p value < 0.01 was considered statistically significant. All statistical analyses were performed using the EZR software version 1.27 (Saitama Medical Center, Jichi Medical University, Saitama, Japan) (14).
Results
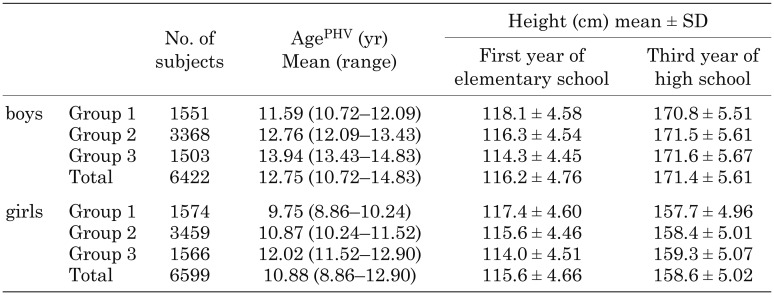
In total, 6744 boys and 6929 girls were included in the analysis. Of these participants, 322 boys and 330 girls, whose agePHV was 2 SD greater or lesser than the mean, were excluded from this analysis. The remaining 6422 boys and 6599 girls were divided into three group according to agePHV (group 1: –2SD <= agePHV <= Q1/4, group 2 : Q1/4 < agePHV < Q3/4, group 3 : Q3/4 <= agePHV <= +2SD, Fig. 2). Table 1 shows the number of participants, agePHV and mean height during the first year of elementary school and the third year of high school. A statistically significant difference was observed in the PHV and height during the first year of elementary school among the three groups of boys and girls (p < 0.01), as well as in height during the third year of high school among three groups of girls (p < 0.01). A statistically significant difference was observed in height during the third year of high school among the boys in groups 1 and 2, as well as in groups 1 and 3 (p < 0.01). However, no significant difference was observed among the boys in groups 2 and 3.
Fig. 2.
Study population diagram. Abbreviations: agePHV, age at peak height velocity; Q1/4, first quartile; and Q3/4, third quartile.
Table 1. Summary of participants.
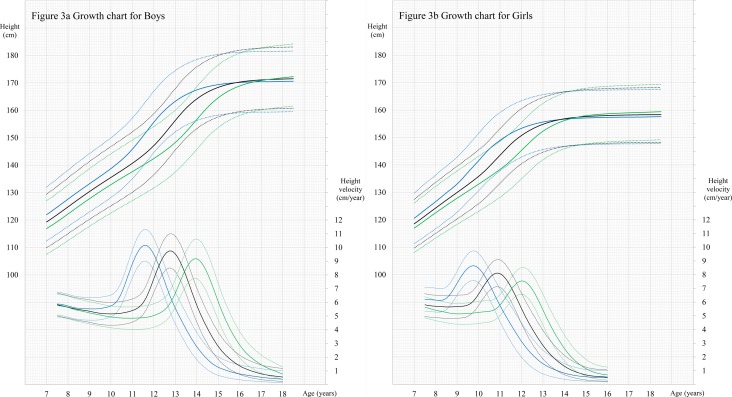
To establish the new standards for height, 18612, 48038, and 18011 measurements were used for the boys in groups 1, 2 and 3, respectively, and 18888, 41508, and 18789 measurements were used for the girls in groups 1, 2, and 3, respectively. For HV, 16587, 36884, and 16465 values were used for the boys in groups 1, 2 and 3, and 17168, 37814, and 17085 values were used for the girls in groups 1, 2 and 3, respectively. The L, M, and S values for each group are shown according to age in Supplementary Materials S1a and S1b (online only). The longitudinal growth charts were based on these L, M, and S values as seen in Figs. 3a and 3b. The equivalent degrees of freedom (EDF) in the height standards for L, M, and S with age rescaled were 4, 9, and 7, respectively, for the boys and 4, 8, and 6, respectively, for the girls, and EDF of HV standards for L, M, and S with age transformed were 4, 18, and 7, respectively, for the boys and 4, 15, and 8, respectively, for the girls.
Fig. 3.
a: Longitudinal growth charts for boys. The smoothing curves for groups 1, 2, and 3 are represented by blue, black and green lines, respectively. The solid lines represent a 0 z-score and the dotted lines represent a ± 2 z-score for height and ± 1 z-score for height velocity. b: Longitudinal growth charts for girls. The smoothing curves for groups 1, 2, and 3 are represented by blue, black and green lines, respectively. The solid lines represent a 0 z-score and the dotted lines represent a ± 2 z-score for height and ± 1 z-score for height velocity.
Discussion
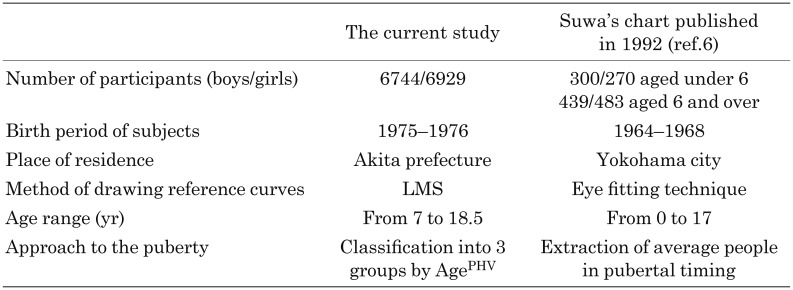
Some of the data of school children in the Akita Prefecture used in this study were previously utilized for the analysis of longitudinal growth in children and adults with short stature (15). We re-analyzed these data to establish three longitudinal growth charts each for boys and girls in a healthy Japanese population using the LMS method. Most of the growth charts were established based on cross-sectional data, and a few longitudinal charts showed a single standard curve even during puberty. Tanner et al. reported three different curves for pubertal maturation (16), as reported in the present study. Their standard curves for early and late maturing children were estimates, i.e., the curves were established with the estimated values for PHV, SD of age at PHV, and height difference between early and late maturing children based on other studies. To the best of our knowledge, this is the first study to mathematically establish different longitudinal growth charts based on pubertal timing. Table 2 shows the comparison of our chart with Suwa’s chart. In the present study, a larger number of participants were enrolled, and reference curves were established using mathematics. In Suwa’s chart, the reference curve was based on population data from birth to 17 yr old in a narrower geographical region. These two studies differed in terms of the approach to puberty. The participants were divided into three groups according to agePHV in our study, whereas the average individuals in pubertal timing was drawn out from the participants included in Suwa’s study. These current references would be more helpful for the evaluation of pubertal height and prediction of adult height.
Table 2. Comparison of the current study with the previous study (Suwa’s chart).
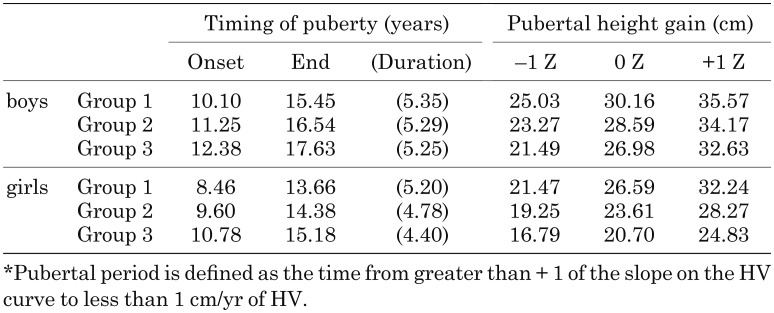
According to the annual School Basic Survey conducted by the Ministry of Education, Culture, Sports, Science and Technology, the national mean heights at age 6 yr were 115.9 ± 4.76 cm for boys and 115.2 ± 4.72 cm for girls, and the mean heights were 116.4 ± 4.90 cm for boys and 115.6 ± 4.87 cm for girls in the Akita Prefecture in fiscal year 1982. The national mean heights at age 17 yr were 170.7 ± 5.61 cm for boys and 158.0 ± 5.19 cm for girls, and the mean heights were 171.3 ± 5.73 cm for boys and 158.7 ± 4.92cm for girls in the Akita Prefecture in fiscal year 1993 (17, 18). The mean height of individuals in the Akita Prefecture were approximately 0.4–0.7 cm greater than the national mean for the same period. Our data were consistent with the findings of this national survey. The mean height during the first year of elementary school was ranked from highest to lowest (groups 1, 2, and 3), and that during the third year of high school was ranked in reverse order despite a prepubertal difference of 3.8 cm and 3.4 cm in the height of boys and girls in groups 1 and 3 of, respectively. Pubertal height gains for each group were calculated using the area under the curve of HV (Table 3). The pubertal period was defined as the time from greater than +1 of the slope of the HV curve to less than 1 cm/year of HV.
Table 3. Estimate of pubertal height gain with the area under the curve of height velocity*.
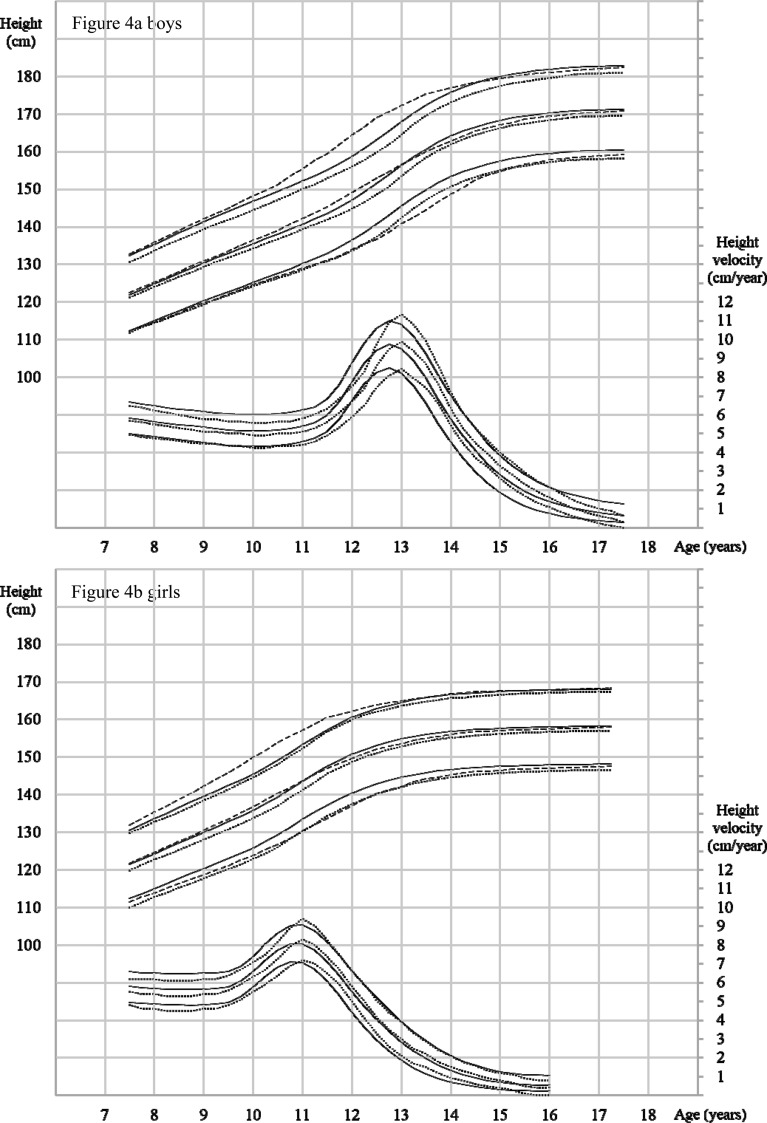
There are several ways, such as the use of the Preece-Baines model 1 or superimposition by translation and rotation model to estimate an individual’s agePHV, (19, 20). In this study, we adopted an easier method for estimating agePHV, as shown in Fig. 1. AgePHV in this study was normally distributed. A previous study reported that girls in the Akita Prefecture had an earlier onset of menarche than those in other prefectures (21). The annual School Basic Survey showed a higher frequency of obese children in the Tohoku and Hokkaido regions, which include the Akita Prefecture. AgePHV was earlier in the current study compared with that in Suwa’s chart (13.05 yr for boys and 11.05 yr for girls), and this result is consistent with these findings because a previous study reported that higher childhood BMI was associated with earlier occurrence of puberty (22). The modification of agePHV in our study was essential for avoiding producing “dull” curves. The mean height curve of a given population is less steep than that of an average individual due to differences in growth tempo, which is known as the Merrell bias (23). Figures 4a and 4b show the growth charts of group 2 in this study, those of the national cross-sectional data from fiscal year 2000, and those of Suwa’s chart. The slope of the height curve, which is based on longitudinal data, changed rapidly compared with that of the cross-sectional data, indicating that height SD with standard curves based on cross-sectional data is overestimated during the first half of puberty and underestimated during the second half.
Fig. 4.
Solid lines represent the height and height velocity curves of group 2 established in this study. The dashed lines represent the height curves based on national cross-sectional data from fiscal year 2000, and the dotted lines represent the height and height velocity curves in Suwa’s chart. Each middle line represents the median or mean height, and each top and bottom line represents a ± 2 SD or ± 2 z-score of height, and ± 1 SD or ± 1 z-score of height velocity.
This study had several limitations. First, these data were obtained from children born between 1975 and 1976. The strong secular trend for height was believed to have ended after the latter half of the 1970s. However, more recently, Morisaki et al. reported that Japanese individuals born between 1975 and 1983 had the highest mean adult height among all individuals born between 1969 and 1996 and that adult height started to decline in those born after 1980 due to the increase in the number of low-birth-weight infants (24). These facts argue strongly for the need to revise growth charts periodically. Second, the growth charts were established using a regional population in Japan. As mentioned previously, a height difference was observed between the mean height of individuals from the Akita Prefecture and that of individuals included in the nationwide research. Therefore, we emphasize that these current charts should be used as a reference. Third, these charts will not reflect an individual’s growth precisely due to the smoothing of growth curves in the population. Three kinds of curves were established to describe growth corresponding to pubertal timing, and this may be sufficient for establishing updated longitudinal growth charts.
Conclusion
New longitudinal growth charts for individuals in their puberty were established based on a healthy Japanese population. These references will be more helpful for evaluating pubertal height and predicting a child’s adult height in relation to pubertal timing.
Conflict of Interest
The authors have no conflict of interest to declare.
References
- 1.Isojima T, Kato N, Ito Y, Kanzaki S, Murata M. Growth standard charts for Japanese children with mean and standard deviation (SD) values based on the year 2000 national survey. Clin Pediatr Endocrinol 2016;25: 71–6. doi: 10.1297/cpe.25.71 [DOI] [PMC free article] [PubMed] [Google Scholar]
- 2.Isojima T, Yokoya S, Ito J, Naiki Y, Horikawa R, Tanaka T. Proposal of new auxological standards for Japanese girls with turner syndrome. Clin Pediatr Endocrinol 2010;19: 69–82. doi: 10.1297/cpe.19.69 [DOI] [PMC free article] [PubMed] [Google Scholar]
- 3.Nagai T, Matsuo N, Kayanuma Y, Tonoki H, Fukushima Y, Ohashi H, et al. Standard growth curves for Japanese patients with Prader-Willi syndrome. Am J Med Genet 2000;95: 130–4. doi: [DOI] [PubMed] [Google Scholar]
- 4.Kimura J, Tachibana K, Imaizumi K, Kurosawa K, Kuroki Y. Longitudinal growth and height velocity of Japanese children with Down’s syndrome. Acta Paediatr 2003;92: 1039–42. doi: 10.1111/j.1651-2227.2003.tb02573.x [DOI] [PubMed] [Google Scholar]
- 5.Isojima T, Sakazume S, Hasegawa T, Ogata T, Nakanishi T, Nagai T, et al. Growth references for Japanese individuals with Noonan syndrome. Pediatr Res 2016;79: 543–8. doi: 10.1038/pr.2015.254 [DOI] [PubMed] [Google Scholar]
- 6.Suwa S, Tachbana K, Maesaka H, Tanaka T, Yokoya S. Longitudinal standards for height and height velocity for Japanese children from birth to maturity. Clin Pediatr Endocrinol 1992;1: 5–13. doi: 10.1297/cpe.1.5 [DOI] [Google Scholar]
- 7.Kobayashi T, Fuse S, Sakamoto N, Mikami M, Ogawa S, Hamaoka K, et al. Z Score Project Investigators. A new Z score curve of the coronary arterial internal diameter using the Lambda-Mu-Sigma method in a pediatric population. J Am Soc Echocardiogr 2016;29: 794–801.e29. doi: 10.1016/j.echo.2016.03.017 [DOI] [PubMed] [Google Scholar]
- 8.Matsushita R, Isojima T, Takaya R, Satake E, Yamaguchi R, Kitsuda K, et al. Development of waist circumference percentiles for Japanese children and an examination of their screening utility for childhood metabolic syndrome: a population-based cross-sectional study. BMC Public Health 2015;15: 1121. doi: 10.1186/s12889-015-2447-1 [DOI] [PMC free article] [PubMed] [Google Scholar]
- 9.Ishii T, Matsuo N, Inokuchi M, Hasegawa T. A cross-sectional growth reference and chart of stretched penile length for Japanese boys aged 0-7 years. Horm Res Paediatr 2014;82: 388–93. doi: 10.1159/000368965 [DOI] [PubMed] [Google Scholar]
- 10.Hagiwara S, Mochizuki H, Muramatsu R, Koyama H, Yagi H, Nishida Y, et al. Reference values for Japanese children’s respiratory resistance using the LMS method. Allergol Int 2014;63: 113–9. doi: 10.2332/allergolint.13-OA-0591 [DOI] [PubMed] [Google Scholar]
- 11.Tatsumi Y, Ohno Y, Morimoto A, Nishigaki Y, Mizuno S, Watanabe S. BMI percentile curves for Japanese men and women aged 20-79 years who underwent a health check-up in 1980 and 2005. Obes Res Clin Pract 2013;7: e401–6. doi: 10.1016/j.orcp.2012.05.004 [DOI] [PubMed] [Google Scholar]
- 12.Isojima T, Shimatsu A, Yokoya S, Chihara K, Tanaka T, Hizuka N, et al. Standardized centile curves and reference intervals of serum insulin-like growth factor-I (IGF-I) levels in a normal Japanese population using the LMS method. Endocr J 2012;59: 771–80. doi: 10.1507/endocrj.EJ12-0110 [DOI] [PubMed] [Google Scholar]
- 13.Cole TJ, Green PJ. Smoothing reference centile curves: the LMS method and penalized likelihood. Stat Med 1992;11: 1305–19. doi: 10.1002/sim.4780111005 [DOI] [PubMed] [Google Scholar]
- 14.Kanda Y. Investigation of the freely available easy-to-use software ‘EZR’ for medical statistics. Bone Marrow Transplant 2013;48: 452–8. doi: 10.1038/bmt.2012.244 [DOI] [PMC free article] [PubMed] [Google Scholar]
- 15.Kojima K, Okumura T, Takada G, Miyashita M, Ohno T, Tanaka T. Analysis of natural growth of children with short stature at prepuberty or at final height. Follow up of healthy children at Akita prefecture. J Jpn Pediatr Soc 1997;101: 610–6(In Japanese). [Google Scholar]
- 16.Tanner JM, Davies PS. Clinical longitudinal standards for height and height velocity for North American children. J Pediatr 1985;107: 317–29. doi: 10.1016/S0022-3476(85)80501-1 [DOI] [PubMed] [Google Scholar]
- 17.Ministry of Education, Culture, Sports, Science and Technology. Report on the 1982. national surveillance of school health statistics in Japan.
- 18.Ministry of Education, Culture, Sports, Science and Technology. Report on the 1993. national surveillance of school health statistics in Japan.
- 19.Preece MA, Baines MJ. A new family of mathematical models describing the human growth curve. Ann Hum Biol 1978;5: 1–24. doi: 10.1080/03014467800002601 [DOI] [PubMed] [Google Scholar]
- 20.Cole TJ, Donaldson MD, Ben-Shlomo Y. SITAR—a useful instrument for growth curve analysis. Int J Epidemiol 2010;39: 1558–66. doi: 10.1093/ije/dyq115 [DOI] [PMC free article] [PubMed] [Google Scholar]
- 21.Hinobayashi T. Secular trend of menarche age in Japan from nationwide menarche survey. Obstetrical and Gynecological Practice 1992;41: 939–44(In Japanese). [Google Scholar]
- 22.Holmgren A, Niklasson A, Nierop AF, Gelander L, Aronson AS, Sjöberg A, et al. Pubertal height gain is inversely related to peak BMI in childhood. Pediatr Res 2017;81: 448–54. doi: 10.1038/pr.2016.253 [DOI] [PubMed] [Google Scholar]
- 23.Cole TJ, Cortina-Borja M, Sandhu J, Kelly FP, Pan H. Nonlinear growth generates age changes in the moments of the frequency distribution: the example of height in puberty. Biostatistics 2008;9: 159–71. doi: 10.1093/biostatistics/kxm020 [DOI] [PubMed] [Google Scholar]
- 24.Morisaki N, Urayama KY, Yoshii K, Subramanian SV, Yokoya S. Ecological analysis of secular trends in low birth weight births and adult height in Japan. J Epidemiol Community Health 2017;71: 1014–8. doi: 10.1136/jech-2017-209266 [DOI] [PubMed] [Google Scholar]


