Abstract
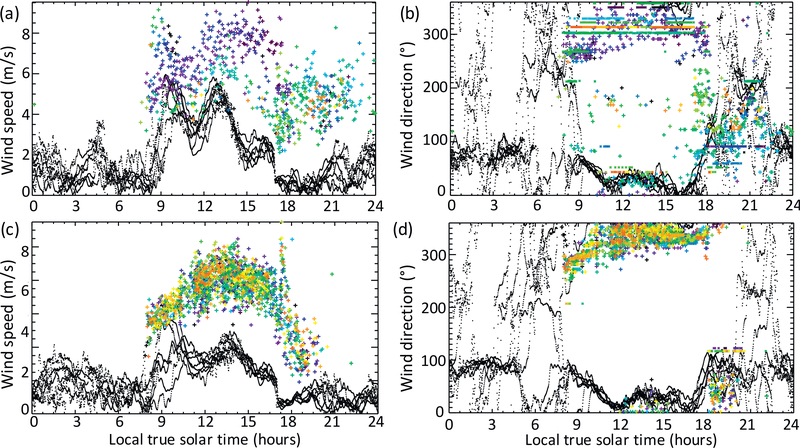
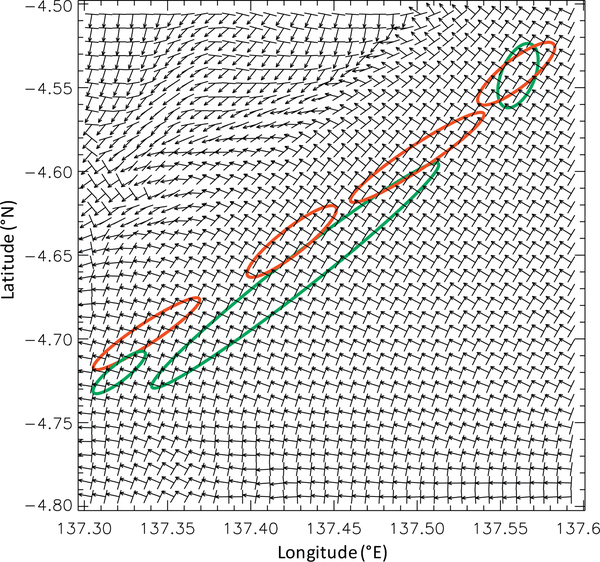
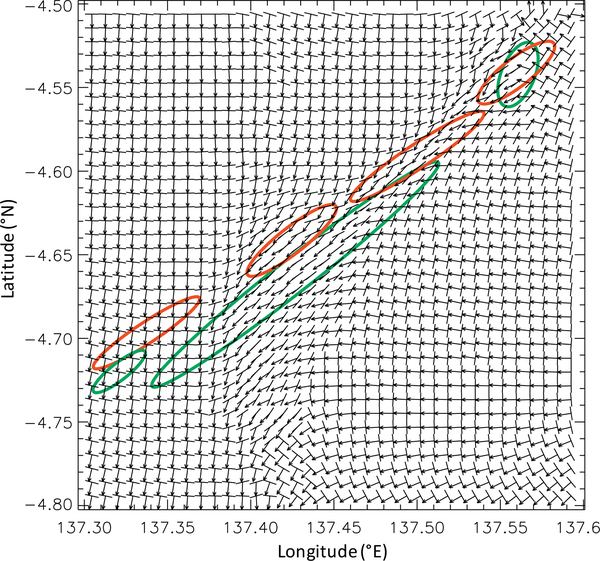
A high density of REMS wind measurements were collected in three science investigations during MSL’s Bagnold Dunes Campaign, which took place over ~80 sols around southern winter solstice (Ls~90°) and constituted the first in situ analysis of the environmental conditions, morphology, structure, and composition of an active dune field on Mars. The Wind Characterization Investigation was designed to Available online 14 December 2016 fully characterize the near-surface wind field just outside the dunes and confirmed the primarily upslope/downslope flow expected from theory and modeling of the circulation on the slopes of Aeolis Mons in this season. The basic pattern of winds is ‘upslope’ (from the northwest, heading up Aeolis Mons) during the daytime (~09:00–17:00 or 18:00) and ‘downslope’ (from the southeast, heading down Aeolis Mons) at night (~20:00 to some time before 08:00). Between these times the wind rotates largely clockwise, giving generally westerly winds mid-morning and easterly winds in the early evening. The timings of these direction changes are relatively consistent from sol to sol; however, the wind direction and speed at any given time shows considerable intersol variability. This pattern and timing is similar to predictions from the MarsWRF numerical model, run at a resolution of ~490 m in this region, although the model predicts the upslope winds to have a stronger component from the E than the W, misses a wind speed peak at ~09:00, and under-predicts the strength of daytime wind speeds by ~2–4 m/s. The Namib Dune Lee Investigation reveals ‘blocking’ of northerly winds by the dune, leaving primarily a westerly component to the daytime winds, and also shows a broadening of the 1 Hz wind speed distribution likely associated with lee turbulence. The Namib Dune Side Investigation measured primarily daytime winds at the side of the same dune, in support of aeolian change detection experiments designed to put limits on the saltation threshold, and also appears to show the influence of the dune body on the local flow, though less clearly than in the lee. Using a vertical grid with lower resolution near the surface reduces the relative strength of nighttime winds predicted by MarsWRF and produces a peak in wind speed at ~09:00, improving the match to the observed diurnal variation of wind speed, albeit with an offset in magnitude. The annual wind field predicted using this grid also provides a far better match to observations of aeolian dune morphology and motion in the Bagnold Dunes. However, the lower overall wind speeds than observed and disagreement with the observed wind direction at ~09:00 suggest that the problem has not been solved and that alternative boundary layer mixing schemes should be explored which may result in more mixing of momentum down to the near-surface from higher layers. These results demonstrate a strong need for in situ wind data to constrain the setup and assumptions used in numerical models, so that they may be used with more confidence to predict the circulation at other times and locations on Mars.
1. Introduction
The Mars Science Laboratory (MSL) rover’s Bagnold Dunes Campaign is the first in situ investigation of a dune field on Mars, and the Bagnold Dunes are the largest aeolian features that MSL will encounter during its mission. Aeolian dunes are produced by the time-integrated effect of surface wind stress over a wide range of timescales, from seasons to potentially tens of thousands of years. Orbital observations indicate that much of the Bagnold Dune field is currently active, with some dunes/ripples observed to move about a meter per Mars year (e.g. Silvestro et al., 2013). Measuring the wind field for present day conditions is thus extremely valuable for understanding how the dunes formed and continue to evolve. The measured wind field can also be compared to shorter timescale measurements of particle or dune movement, and the measured wind speed required for such movement to occur can be used to estimate the threshold for saltation (e.g. Bagnold, 1941), which has never been measured reliably on the martian surface. Results from ‘change detection experiments,’ in which an upper (lower) limit on the saltation threshold may be inferred by measuring the fastest wind speed between two images of the surface showing (or not showing) grain motion, will be presented in a future paper. In situ measurements are also vital for improving and validating atmospheric models, as described in this paper. Such atmospheric models can then be used with far greater certainty to provide wind predictions for other times of year. In combination, the estimated saltation threshold and modeled annual wind field may be used to predict and understand the observed dune characteristics, such as transport direction and morphology. The goals of the MSL rover’s Bagnold Dunes Campaign therefore included a desire to measure the wind field in the vicinity of the Bagnold Dunes.
More generally, MSL is the first mission to land in a region of strong local topography - a crater with a large central mound (Aeolis Mons). Prior landed missions with wind sensors have flown to relatively flat plains (Viking Landers 1 and 2, Mars Pathfinder, and Phoenix), yet Mars’s surface is covered with extreme topographic slopes. Slopes likely have a significant impact on the circulation, for example by being the location of enhanced winds that raise and mix dust more effectively (e.g. Michaels et al., 2006; Spiga and Lewis, 2010). By returning the first in situ measurements of slope-induced circulations on Mars, MSL’s wind sensor has provided vital new ground truth data for understanding winds, transport, and the dust cycle on Mars, and for constraining atmospheric models that have not previously been tested for such conditions.
The Rover Environmental Monitoring Station (REMS) wind sensor on the MSL rover is described in detail in Dominguez et al. (2008) and Gomez-Elvira et al. (2012). The wind sensor was found to be only partially operable when tested after MSL’s landing, with Boom 1 largely non-functional, as described in Gómez-Elvira et al. (2014) and Section 2.2. This required modifications to the monitoring of winds in Gale Crater, as described in describes how REMS wind measurements are impacted by Section 2.3. Due to the importance of winds to the Dunes Campaign goals, wind monitoring was prioritized in three Wind Investigations (described in Section 2.6) at different locations in or near the dune field (shown in Fig. 1), during which conditions were optimized to provide an unprecedented set of REMS wind data. This paper describes the methods used to obtain this dataset, the dataset itself, and its impact on understanding the circulation affecting the dunes and in Gale Crater overall.
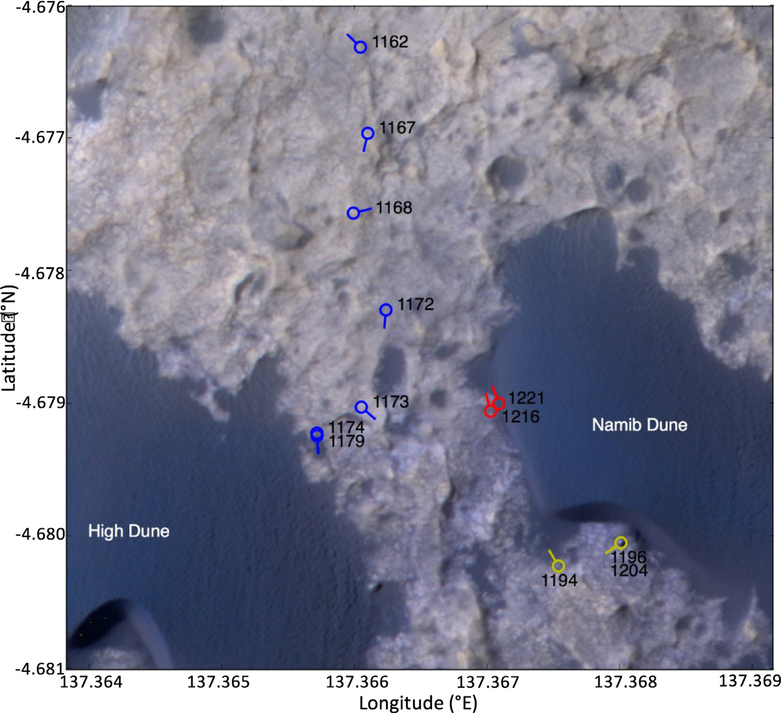
Fig. 1.
Rover location and sols during the Bagnold Dunes Campaign, relative to the location of the dunes investigated. Colored circles indicate the final rover position following a drive on the sol shown, while the line sticking out from the circle indicates the rover heading and hence the orientation of the working REMS wind sensor on Boom 2. The periods shown are (1) the Wind Characterization Investigation during the drive to High Dune (sols 1162 to 1179, shown in blue); (2) the Namib Dune Lee Investigation (sols 1194 to 1215, shown in yellow); and (3) the Namib Dune Side Investigation (sols 1216 to 1243, shown in red). (For interpretation of the references to color in this figure legend, the reader is referred to the web version of this article.)
To date, several papers have been published that present and interpret atmospheric results from the REMS instrument but do not compare these results with mesoscale model predictions. These papers largely focus on the ground temperature sensors (e.g. Hamilton et al., 2014; Martínez et al., 2016), the relative humidity sensor (e.g. Harri et al., 2014,a; Martínez et al., 2016), the pressure sensor (e.g. Haberle et al., 2014; Harri et al. 2014,b; Guzewich et al., 2016), and the UV sensors (e.g. Smith et al., 2016). Although several modeling studies of Gale Crater have been published, most focus on either predictions of the circulation in Gale prior to landing or comparisons with the pressure data measured by REMS (e.g. Tyler and Barnes, 2013; Haberle et al., 2013; Kahanpaa et al., 2016; Richardson and Newman, 2017). By contrast, Pla-Garcia et al. (2016) and Rafkin et al. (2016) show results from the REMS dataset at different seasons and use a comparison with output from the MRAMS mesoscale model to understand and interpret these observations, although they only compare with variables in their lowest model layer (centered at ~15 m) rather than at the height of the REMS sensors (at ~1.5 m). In particular, they note the special nature of the local summer season (Ls~270°), when the intra-crater circulation is most affected by regional scale winds, which penetrate to the location of the rover, and the planetary boundary layer (PBL) inside the crater is largest. These findings are also consistent with observations of the PBL in different seasons made via MSL’s cameras (Moores et al., 2015).
This work is novel in that it presents results from the unusually dense REMS wind dataset returned during the Bagnold Dunes Campaign. This study also provides the first detailed exploration of REMS wind data, including discussion of observational difficulties and solutions, and the various biases that may be present in the results. In addition, the first detailed comparison between REMS wind data and mesoscale model predictions is made possible by targeting modeling on the specific seasons of the Campaign and extrapolating model winds to the height of the REMS sensors. This comparison is then used to assess and improve the realism of mesoscale results produced by the MarsWRF model. In general, this work points to unexplored sensitivities in current models and supports the need for further in situ measurements of winds on Mars in order to better constrain mesoscale and Large Eddy Simulation (LES) models.
Section 2 describes how REMS wind measurements are impacted by the loss of Boom 1, provides details of REMS scheduling, wind retrievals, and wind data averaging pertinent to this work, and describes the steps taken to prioritize wind monitoring during the Bagnold Dunes Campaign. Section 3 presents the wind measurements made during three Wind Investigations carried out with optimum rover headings during the Campaign. Section 4 describes the MarsWRF atmospheric model, while Section 5 compares REMS data with model predictions and discusses these results in the context of better understanding the circulation inside Gale Crater in the region of the Bagnold Dunes. Section 6 demonstrates the value of the in situ REMS wind dataset for constraining and improving atmospheric models, while Section 7 summarizes and concludes.
2. REMS measurements
2.1. Timings conventions used in this paper
Local Mean Solar Time (LMST) is the reference frame used for all MSL planning, hence all Figures and text pertaining to the scheduling of REMS blocks use LMST. However, Local True Solar Time (LTST) is a more physically meaningful quantity, thus all times of sol shown in results plots have been converted to LTST. It is straightforward to convert from LMST to LTST (e.g. Allison and McEwen, 20 00) and this conversion is also provided in the REMS data files archived in the Planetary Data System (PDS). All sols are given in MSL sols, with sol 0 being the sol (starting at midnight local time) at the landing site at the time of landing, at Ls = 151°. Ls is planetocentric solar longitude, a measure of Mars’s position around its orbit of the Sun, and Ls = 0° is northern spring equinox, Ls = 90° is northern summer solstice, etc. Hours and minutes are in Mars-centric units, i.e., an hour = 1/24th of a Mars sol and a minute = 1/1440th of a Mars sol, but the REMS measurement frequency of 1 Hz (i.e., one per second) is in S.I. units.
2.2. Degradation of the REMS wind sensor and impact on wind retrievals
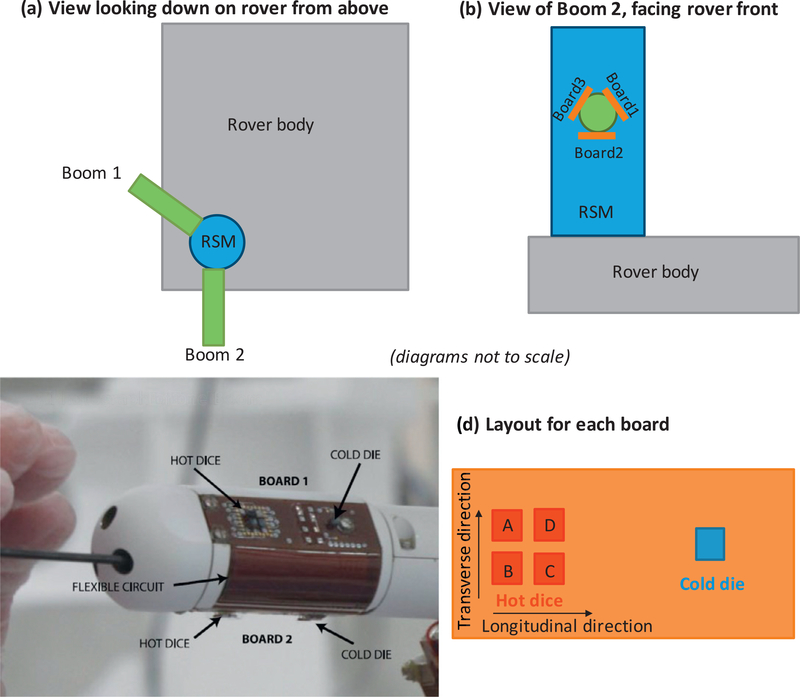
Fig. 2a shows the placement of the two REMS wind sensor booms on the remote sensing mast (RSM). Boom 1 points out to the right and slightly to the rear of the rover, at 120° to Boom 2, which points out to the front of the rover. Fig. 2b shows the position of the sensor boards on Boom 2. Each boom carries three boards, two on the sides and one on the bottom, angled at 120° to each other, as shown in Fig. 2b and c.
Fig. 2.
(a) The placement of the two REMS wind sensor booms on the remote sensing mast (RSM). (b) The position of the sensor boards on Boom 2. (c) A photo of one Boom. (d) The layout of hot and cold dice on each board.
2.2.1. Measurements made by each REMS wind sensor board
Fig. 2 d shows the layout for each of the six boards, each of which acts as a bi-directional hot film anemometer. On each board, four hot dice are maintained at a constant warmer temperature than one cold die, and the power needed to maintain this temperature for each hot die is recorded. This power equals the conductive and radiative losses plus the power lost by convection to the ambient air flow. As described in Dominguez et al. (2008), this means that each die consists of a silicon chip with its own temperature sensor and (for the hot dice only) heating element, which is isolated from the board on which it sits by four pillars with a low thermal conductance. As demonstrated in Dominguez et al. (2008), the thermal plume around each hot die depends on the wind direction and speed, and depends on the incident wind direction and speed, both of which affect the hot die over which the air passes first and the relative amount of heat lost. This means that the pattern of convective power losses can be used to infer the local flow field in that plane. In practice, difference estimators are used to cancel out (to first order) conduction losses to the structure. The longitudinal wind is thus related to (C + D) −(A + B), where the letter refers to the power needed by that hot die to maintain its temperature, while the transverse wind is related to (A+D) -(B+C). These are converted to thermal conductances, respectively Gl ong and Gt rans, which are then used in the wind retrieval scheme described below. As with all REMS sensors, the measurement frequency is 1 Hz.
2.2.2. The REMS wind sensor retrieval: original and modified scheme
As discussed in Gomez-Elvira et al. (2012), for any incoming wind direction, one of the booms experiences more disturbed flow than the other. For example, if the ambient wind direction comes from the rear of the rover, Boom 2 will be in the RSM’s wake, whereas Boom 1 should experience largely unaffected flow. For this reason, the first step of the original retrieval scheme was to determine which boom sat the most in ‘free air,’ after which data would be used from that boom only. The measured Gl ong and G trans values for each of that boom’s three boards would then be compared with a calibration dataset, consisting of values measured in a wind tunnel on Earth for different ambient wind directions and Reynolds numbers, allowing the ambient wind direction and Reynolds number on Mars to be retrieved. Finally, the wind speed would be obtained from the Reynolds number using . Here v is the wind speed, L a representative length scale (set equal to the boom diameter, 30 mm), p the atmospheric density (derived from the REMS pressure and air temperature measurements), and μ the dynamic viscosity (which varies with air temperature according to the Sutherland law).
After landing, however, most of the Boom 1 wind sensor and one wind sensor board on Boom 2 were found to have failed, possibly due to the impact of small rocks thrown up during landing, although this cannot be confirmed. This made the original retrieval scheme impossible to use, thus it has instead been modified to use data from only Boards 2 and 3 on Boom 2. Since the retrieval must rely entirely on data from Boom 2, which sits in the RSM wake for winds from the hemisphere to the rover’s rear, it is not possible to properly retrieve ambient wind directions or speeds if the incoming wind direction relative to the rover is between 90° and 270° For such ‘rear’ winds, wind speed is not retrieved at all, while the only direction information is whether the wind came from the quadrant over the rover’s right or left ‘shoulder.’ Rear winds are identified by a negative value of Gl ong on Boom 2 Board 2, with the sign of Gt rans giving the quadrant.
For ‘front’ winds, however - i.e., winds coming from the hemisphere in front of the rover - both wind direction and wind speed can be retrieved. The uncertainty on each second-by-second measurement is 15° for wind direction and 20% for speed. Note that this is the uncertainty in retrieving the local wind direction or speed as it reaches the wind sensor boom, and does not take into account the possible impact of the rover body or heat source in physically or thermally perturbing the true ambient wind. However, this is likely to be minimal, since only winds coming from the hemisphere in front of the rover (which will have had little to no interaction with rover elements or the rover heat plume) are retrieved. Averaging (taking the mean or mode) over 5 min intervals should reduce the uncertainty below the values stated above, but it is difficult to estimate by how much, particularly as the number of points included in each 5 min period may vary considerably due to e.g. rear winds and noisy measurements being rejected (see below).
2.2.3. Nighttime sensor noise
The wind data from each boom is passed to rover memory using Application-Specific Integrated Circuit (ASIC)-based Sensor Front-End electronics, with one ASIC located on each boom. Unfortunately, the ASIC for Boom 2 experiences significant electronic noise during cold periods which prevents the sensors that use this ASIC (the Boom 2 wind and air temperature sensors) returning useful data for a portion of each night. Note that the air temperature sensor and the remaining wind sensor board on Boom 1 return low noise data throughout the night, demonstrating that this is purely an electronics issue. Around local summer solstice (Ls ~270°) the nighttime temperatures are warmest and hence the period lost is shortest, only about 4 h from ~02:00 until around dawn. Around local winter solstice (Ls ~90°), however, the period lost is longer, about 12 h from ~20:00 until ~08:00. The Bagnold Dunes Wind Campaign took place between Ls ~67 and 104°, so most of the nighttime winds were lost, although late evening winds were able to be measured, particularly earlier in the Campaign (see Section 2.6).
2.3. The rover heading and wind measurements
Despite the problems detailed above, good REMS wind retrievals remain possible for daytime and evening winds coming from the hemisphere in front of the rover. This makes the rover heading crucially important, as it determines whether the wind comes from the front or ‘rear’ of the rover. The rover heading is defined as the direction in which the rover faces, with positive or negative headings indicating respectively a clockwise or anticlockwise rotation relative to due north. E.g., a heading of +90° indicates the rover faces due E, while a heading of −90° indicates it faces due W.
The directional limitation of REMS could be overcome by selecting a rover heading after each drive that is optimal for the expected wind distribution, but in practice this is difficult. The most efficient practice is to face the rover in the direction of the ongoing traverse, to avoid extra turns (which require time and incur extra wear on the rover’s wheels) and to assure that images in the direction of travel are unoccluded by other parts of the rover. Further, some combinations of rover tilt and orientation are prohibited in order to assure clear line-of-sight communications with the relay orbiters. During the Bagnold Dunes Campaign, which took place in local late fall and early winter, most south-facing headings were good for communications for all surface tilts, whereas only a few north-facing headings were possible and then only for low tilts. Science requirements also determine the rover heading in many sols, with the rover needing to be parked such that a study region is in the workspace of the instruments and/or arm, or with a certain range of headings being optimal to provide good lighting of a target.
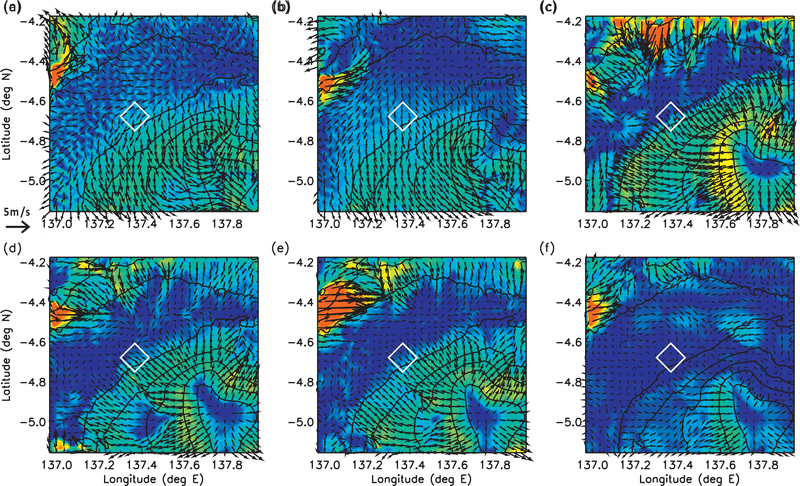
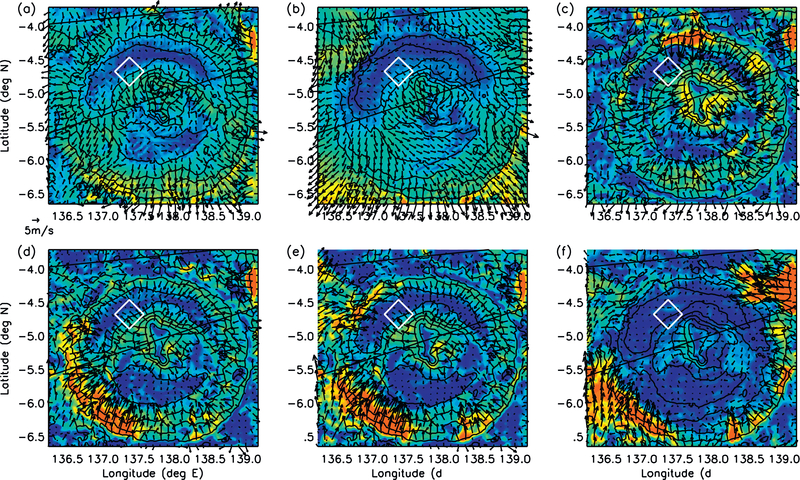
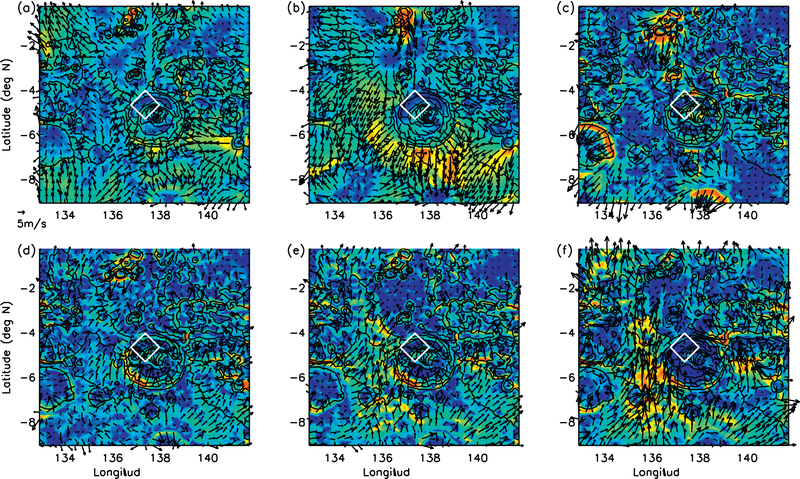
Fig. 3 shows the diurnal cycle of winds on the NW flanks of Aeolis Mons that is predicted by the MarsWRF atmospheric model at Ls~63° (near the start of the Bagnold Dunes Campaign). More details on the MarsWRF model and a detailed comparison with REMS data are provided in Sections 4 and 5, but the Figure provides a general picture of winds in the Bagnold Dunes Campaign study area (at the center of the white diamond) which is generally confirmed by the REMS results. At night, the model predicts winds that blow down the slopes of Aeolis Mons and are southeasterlies (from the SE), while during the day it predicts winds that blow up the slopes of Aeolis Mons and are northerlies or northeasterlies.
Fig. 3.
MarsWRF predictions for Ls = 60°, showing the whole of domain 6. The Bagnold Dunes Campaign was conducted at the center of the white diamond. (a)=noon at rover location, (b) =16:00, (c) =20:00, (d)=midnight, (e) =04:00, (f) =08:00. Topography is shown by black contours (contour spacing is 1 km), colored shading indicates wind magnitude, and black arrows are wind vectors indicating the direction in which the wind is blowing. The magnitude of the wind vectors are indicated by the length of the 5 m/s arrow at the lower left of plot (a). (For interpretation of the references to color in this figure legend, the reader is referred to the web version of this article.)
Over the 50 sols prior to arriving at the Bagnold Dune Field on around sol 1162, the rover heading was never more than 47° from due S, with the result that winds coming from directions between −43° and 50° (i.e., northwesterlies through northeasterlies) were never in the hemisphere to the front of the rover. This resulted in the loss of most wind data, due to either the non-ideal rover heading during most of the day (when winds typically came from the rear) or the cold temperatures at night. By contrast, optimum headings for wind measurements were prioritized during the Bagnold Dunes Campaign, due to their importance for better understanding the aeolian processes responsible for forming the dunes, and for supporting change detection and other aeolian experiments (see Section 1).
2.4. REMS Extended Blocks and their nominal cadence
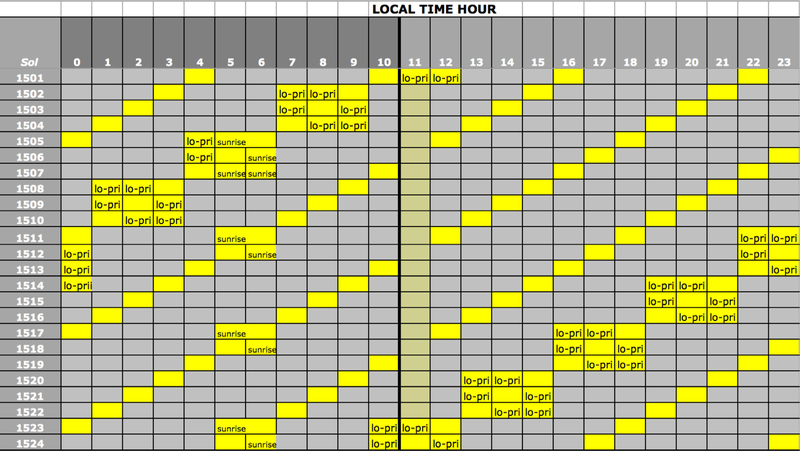
All REMS sensors routinely measure for 5 min at the start of every Mars hour, where a Mars hour is defined in the reference frame of LMST. In addition to these hourly 5 min measurements, up to 14 (but usually 8 or 9) additional 1 h Extended Blocks (EBs) of REMS may be added into each sol’s plan. The regular REMS cadence of EBs is shown in Fig. 4. EBs are placed every 6 h, shifting 1 h earlier each sol, thus covering the complete diurnal cycle in 6 sols. Additional EBs are also regularly added around sunrise (to capture the rapid change in temperature and relative humidity), around noon (to monitor the time of peak solar radiation and search for signs of convective vortices in the pressure dataset), and to support other investigations (such as joint observations with other instruments on MSL or on orbiting spacecraft). If power and memory permits, 3 h-long measurements are also performed for 3 consecutive sols, shifting 3 h earlier every 3 sols, the intention being to cover the complete diurnal cycle with these ‘3 × 3′ blocks in 24 sols.
Fig. 4.
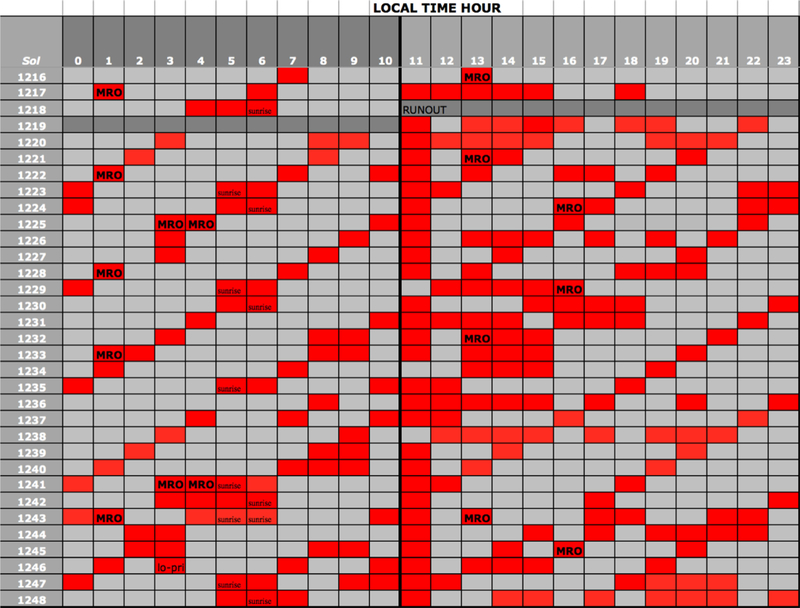
Adapted from the MSL science team’s spreadsheet, demonstrating the standard cadence (in operation since sol 1133) of REMS wind measurements over each 24-sol period. Local time is shown in LMST. Each colored rectangle indicates a REMS Extended Block (EB, an observation lasting 1 h). The main cadence has EBs spaced 6 h apart, shifting 1 h earlier each sol. ‘lo-pri’ indicates lower priority EBs that are added to monitor 3 h periods for 3 sols each, shifting 3 h earlier every 3 sols. These are removed first (if necessary) to meet power or data restrictions. ‘sunrise’ indicates extra EBs added to measure the sharp changes (in water vapor, temperature, etc.) around sunrise. The 11-noon sand-colored EBs are added when possible to consistently cover local noon (the time of peak solar insolation) in this season.
Note that REMS cannot measure through an entire diurnal cycle for three primary reasons. (i) The REMS memory buffer only holds up to 63 five-minute blocks of REMS data before it must be downloaded to rover memory. This procedure (called a GetData) takes ~30 min to complete and no REMS measurements can be taken during this time. In practice, this limits the number of consecutive 1 h EBs to a maximum of 5 in a row, with GetDatas needed shortly before and after the 5 h measurement period. (ii) To conserve rover power, GetDatas must typically be placed when the rover is already awake for other activities, which restricts the number of EBs that can be added, particularly at night and during winter (when more power is needed for heating and thus the rover ‘sleeps’ more frequently). (iii) REMS data have to share the downlink bandwidth with all other rover engineering and science data, so the number of EBs per sol is limited unless circumstances are such that few other data are being taken (e.g. during holiday periods when no targeted science is possible).
2.5. Sampling and time-averaging of the REMS wind dataset
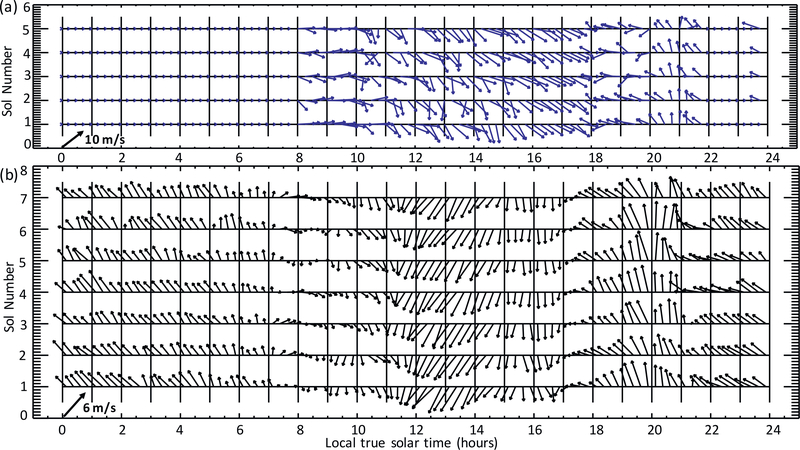
Although REMS wind measurements are made every second, and the retrieval scheme operates on this 1 Hz dataset, the wind dataset provided in the PDS is a 5 min average of the wind speed and direction, calculated as follows. The 1 Hz wind retrievals in each 5 min period are first sorted into 5°-wide direction bins (for front winds) or into one of two 90°-wide rear wind bins. If the number of occurrences in either rear wind bin is greater than that in any individual front wind bin, the wind direction is assigned to the center of the rear wind bin that has the greater number of occurrences. No wind speed is assigned, and in REMS wind vector plots presented in this paper (e.g. Figs. 8–10) the direction into which the wind blows is shown by a red arrow with a uniform length, pointing out from the center of the rear wind quadrant. Otherwise, the wind direction is assigned to the center of the front wind bin with the greatest number of occurrences. The wind speed is given by the average speed of all front winds during this 5 min period, and in Figs. 8–10 the wind vector is shown by a blue arrow, with its length indicating speed and pointing in the direction into which the wind blows. Note that the combining of all wind data points in each 5 min bin should greatly improve the accuracy of the retrieved wind direction and speed relative to the 1 Hz accuracies given in Section 2.3. This will be discussed in more detail in a future paper by the REMS wind sensor team.
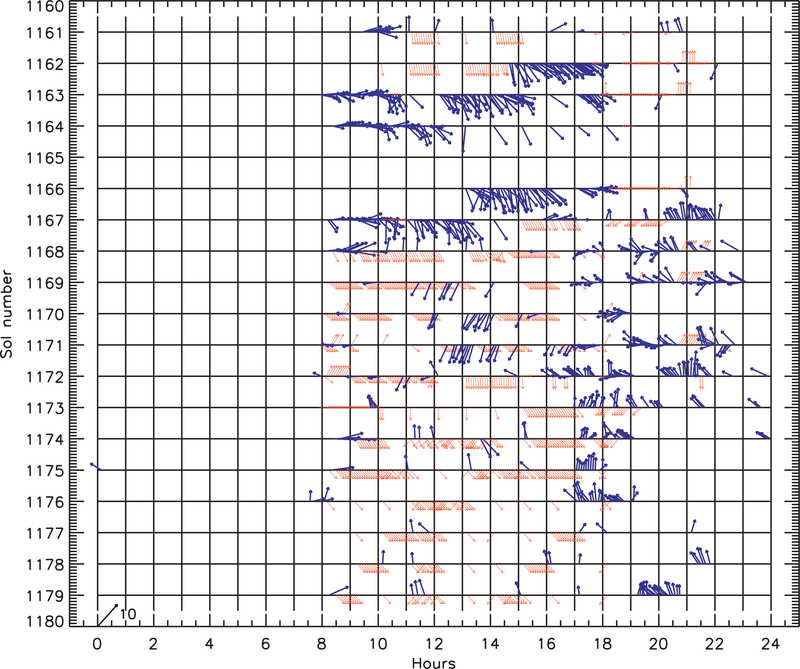
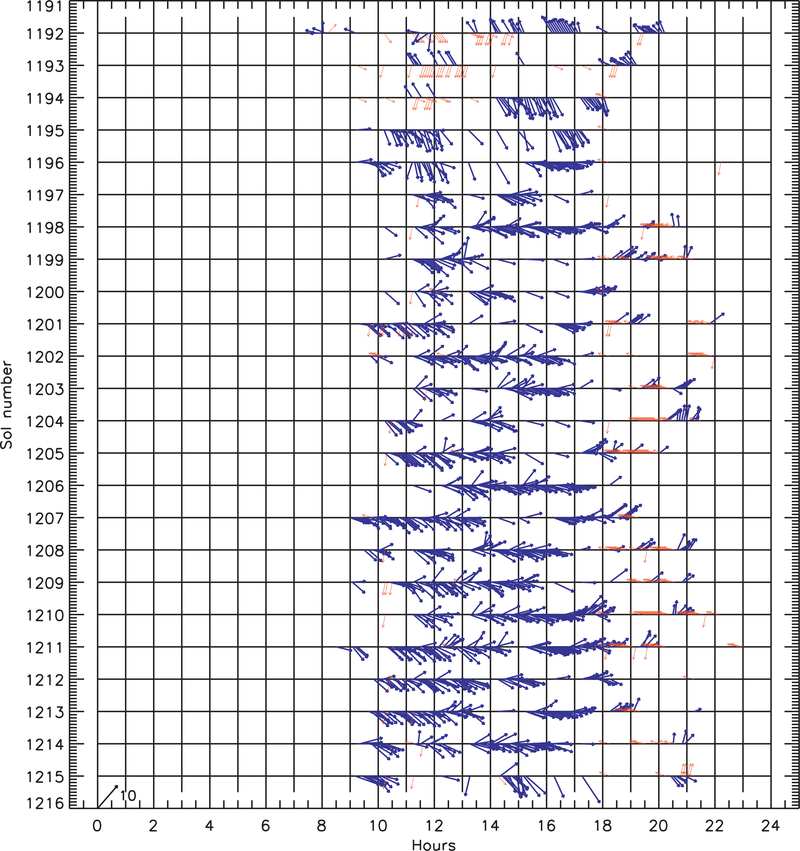
Fig. 8.
REMS wind retrievals during the Wind Characterization Investigation (sols 1162 to 1179). See Section 2.5 for details of the assignment of winds to ‘front’ or ‘rear’ and how averaging of front wind directions is done. Blue arrows point in the 5 min-average wind direction for front winds and their length provides the average wind speed in m/s, scaled by the black arrow at the lower left of the plot. An arrow pointing up the page indicates wind blowing toward the north (wind direction 0°) while an arrow pointing toward the right of the plot indicates wind blowing toward the east (wind direction 90°). Red arrows indicate times with primarily rear winds and the red arrow points to the middle of the quadrant into which the wind blew. Hence red arrows have only two possible orientations over any period with a constant rover heading. No wind speeds are retrieved for rear winds, hence all red arrow lengths are equal and do not indicate speed. (For interpretation of the references to color in this figure legend, the reader is referred to the web version of this article.)
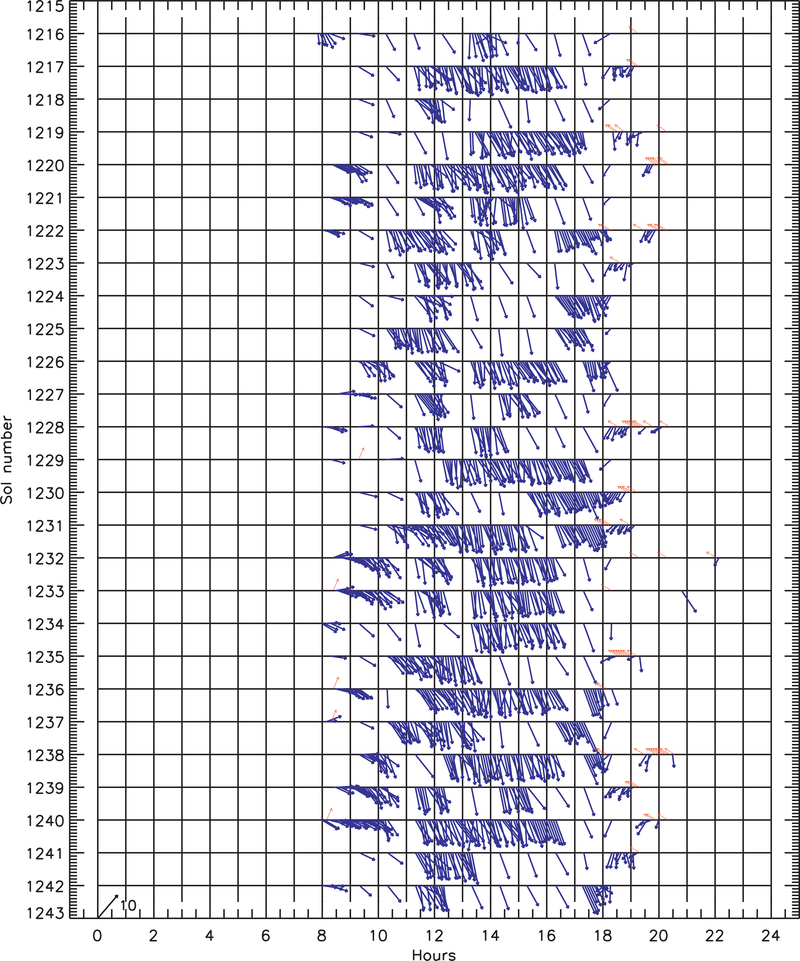
Fig. 10.
As in Fig. 8 but for but for sols 1216 to 1242, covering most of the Namib Dune Side Investigation. (For interpretation of the references to color in this figure legend, the reader is referred to the web version of this article.)
2.6. REMS during the three Bagnold Dunes Campaign Wind Investigations
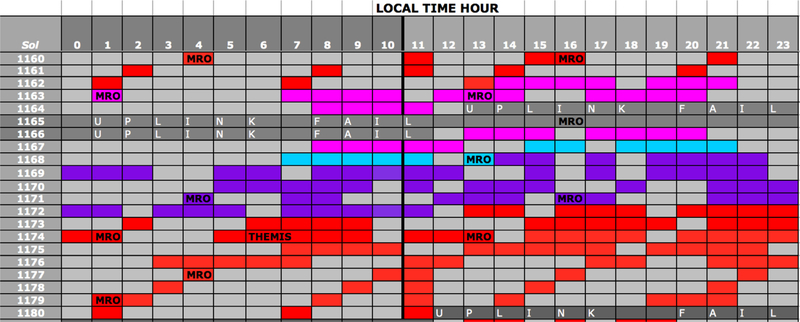
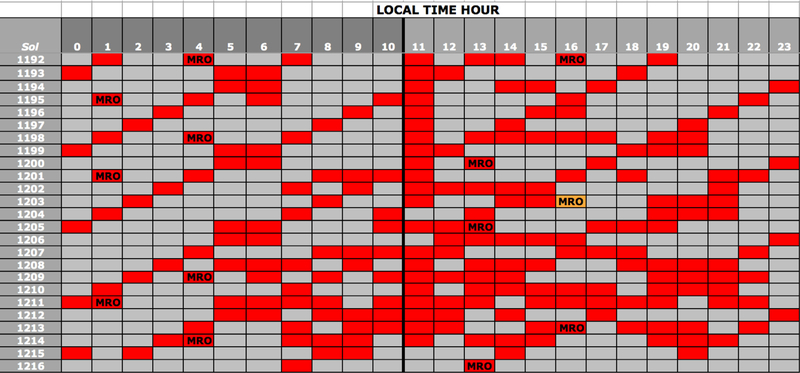
Due to the issues discussed in Section 1, the timings of the REMS EBs during the Wind Investigations were chosen carefully by the MSL Science Team to maximize the benefits of each rover heading. In other words, EBs were prioritized at times of sol when the winds were expected to come from in front of the rover, given the rover heading on that sol. Figs. 5, 6 and 7 show the timing of EBs for the sols involved in each of the three Investigations. Throughout the Campaign, MSL team members worked to provide advantageous rover headings for winds that were also safe for the rover and supported other mission and science objectives.
Fig. 5.
As in Fig. 4, but showing the actual REMS wind measurements made during the Wind Characterization Investigation (sols 1162 to 1179). Pink EBs indicate a rover heading of ~NW, cyan EBs a heading of ~SSW, and purple EBs a heading of ~ENE. The red EBs before sol 1163 had roughly a SW heading while the red EBs after sol 1171 had headings between ~S and SE. See Table 1 for details. Some data at the ~NW heading were lost due to a Deep Space Network uplink failure. ‘MRO’ or ‘THEMIS’ indicate times at which a spacecraft instrument was also observing Gale Crater. If REMS EBs do not already cover these times, extra EBs are added to provide simultaneous ground truth measurements. (For interpretation of the references to color in this figure legend, the reader is referred to the web version of this article.)
Fig. 6.
As in Fig. 4 but showing the actual REMS wind measurements made during the Namib Dune Lee Investigation (sols 1192 to 1216). The orange MRO EB indicates only 20 min of REMS was scheduled to cover the spacecraft joint observation (due to lack of space in memory prior to the next GetData).
Fig. 7.
As in Fig. 4 but showing the actual REMS wind measurements made during the Namib Dune Side Investigation (sols 1216 to 1248). ‘RUNOUT’ indicates a period when the REMS sensors went into runout mode and only the 5 min at the top of each hour were measured.
The team also prioritized times of sol with warmer temperatures, when the ASIC electronic noise was likely to be low enough that wind retrievals could still be performed. Figs. 15, 17 and 18 (see Section 3) show the diurnal variation of air temperature and wind retrievals during each Investigation. In all three periods, wind sensor data were consistently too noisy for winds to be retrieved at times of sol when air temperatures were below about 200 K, but retrievals were possible at times with higher air temperatures. The only exception was the middle period, in the lee of Namib Dune, when winds were also too noisy between 07:00 and 08:00 despite a regular ‘bump’ in air temperatures to well above 200 K every sol; this may suggest a different source of noise, such as strong natural thermal turbulence which may also be responsible for the raised morning temperatures themselves. Mean daily air temperatures generally decreased over the Campaign (which occurred in the lead up to, and just after, local winter solstice, Ls = 90°), although morning daytime air temperatures may have been increased due to the rover sitting over lower thermal inertia sand during the final investigation period. Overall, the longest daily time window for low-noise wind measurements occurred in the initial investigation (Ls = 67–75°), with useful wind data taken from ~07:30 to midnight, while the two later investigations (Ls = 82–91° and Ls = 92–104°) had useful wind measurements from only ~09:00 to 23:00 and ~08:00 to 22:00, respectively.
Fig. 15.
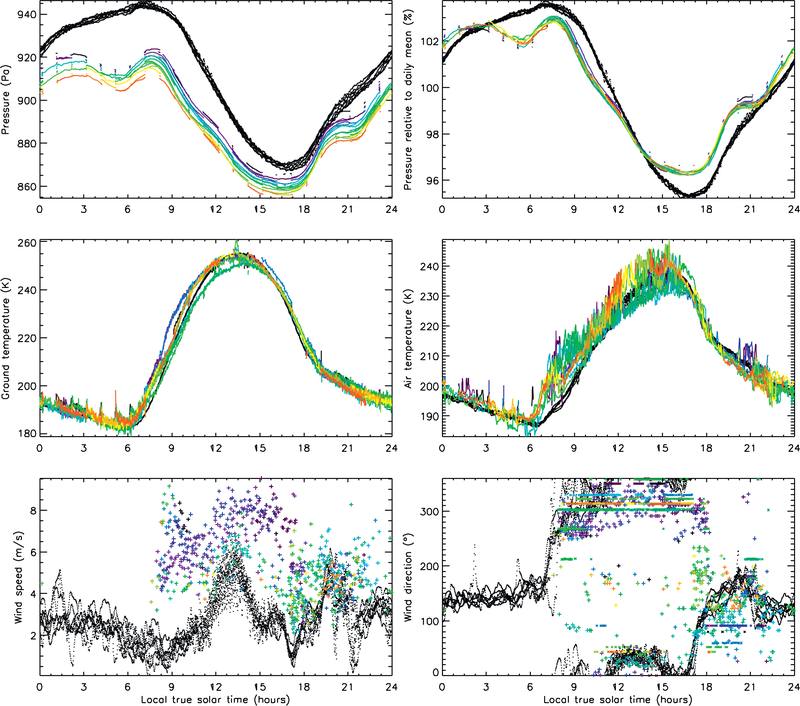
Comparison between REMS data (colors indicate different sols, from purple [sol 1162] to red [sol 1179]) and MarsWRF domain 6 predictions at the same time and location (black) for all sols during the Wind Characterization Campaign. The top row shows (left) surface pressure in Pa and (right) surface pressure relative to the daily mean in %. The middle row shows (left) ground temperature and (right) air temperature in K. The bottom row shows (left) wind speed in m/s and (right) wind direction (direction from which the wind blows) in ° relative to N (i.e., northerly winds have a direction of 0°, westerlies a direction of 270°, etc.). Rear wind directions are plotted as the midpoint of the quadrant from which the wind blows, and appear as horizontal lines. This is because the two quadrant midpoints are +/− 135° relative to the rover heading, hence are constant while the rover is parked in one heading. (For interpretation of the references to color in this figure legend, the reader is referred to the web version of this article.)
Fig. 17.
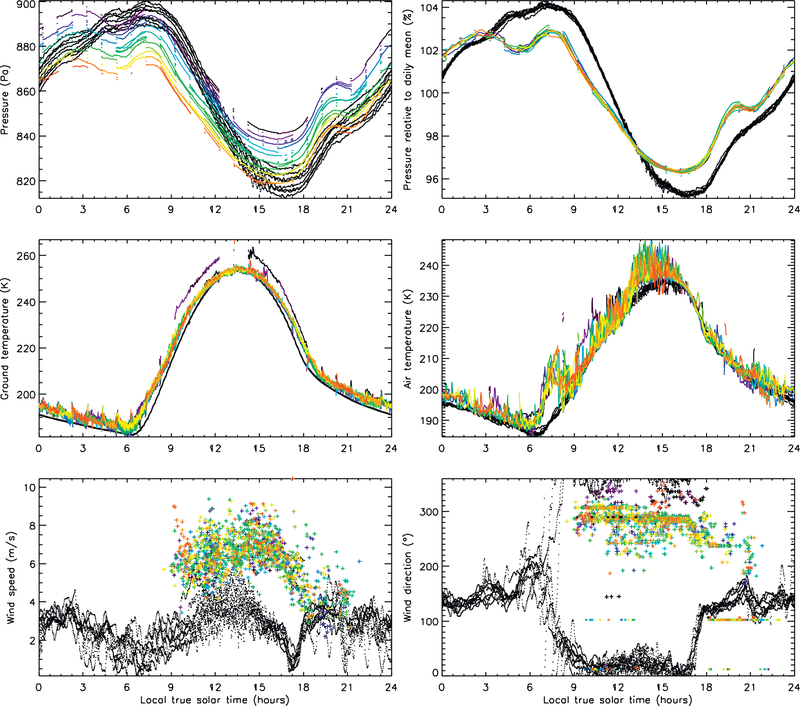
As in Fig. 15 but now showing REMS data from the Namib Dune Lee Investigation and MarsWRF domain 6 results for Ls~90°
Fig. 18.
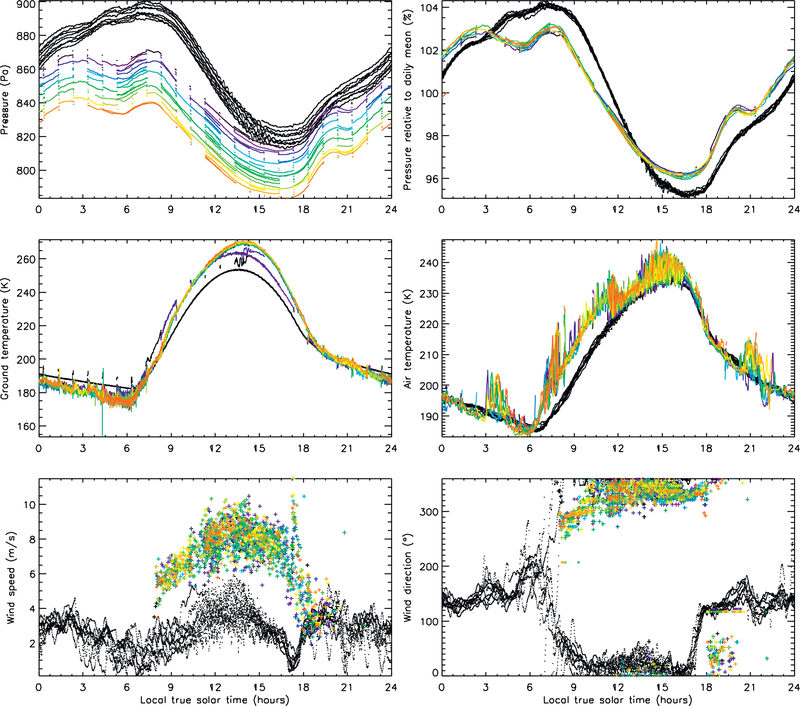
As in Fig. 15 but now showing REMS data from the Namib Dune Side Investigation and MarsWRF domain 6 results for Ls~90°
2.6.1. REMS during the Wind Characterization Investigation, MSL sols 1162–1179 (Ls~67–75°)
The Wind Characterization Investigation was designed to characterize the wind field just outside the dunes, along the path shown by the blue symbols in Fig. 1. The rover elevation increased monotonically along this path as it drove up the slope of Aeolis Mons, with a total elevation change of ~7.5 m over this period (see Table 1). In addition to gathering more data in some ‘typical’ rover headings with a large south-facing component (ranging from ~131° to −167°), MSL was turned to face two unusual headings, optimized to measure good daytime winds, for several sols each. The REMS EB measurement density was also increased over this 18-sol period. Table 1 shows the rover location and heading in the sols leading up to, during, and after this investigation, while Fig. 5 shows the REMS EBs over the same sols.
Table 1.
End-of-drive rover locations and headings (the direction in which the rover faced, clockwise relative to N) prior to and during the Wind Characterization Investigation (sols 1162 to 1179).
| MSL sol | Ls (°) | Latitude (°N) | Longitude (°E) | Elevation (m) | Rover heading (°) |
|---|---|---|---|---|---|
| 1153 | 63.7 | −4.67389 | 137.36825 | −4434.438 | −149 |
| 1155 | 64.6 | −4.67439 | 137.36784 | −4433.240 | −133 |
| 1158 | 65.9 | −4.67520 | 137.36712 | −4432.230 | −135 |
| 1160 | 66.8 | −4.67579 | 137.36643 | −4433.830 | −147 |
| 1162 | 67.6 | −4.67631 | 137.36605 | −4432.318 | −46 |
| 1167 | 69.8 | −4.67696 | 137.36611 | −4429.297 | −167 |
| 1168 | 70.2 | −4.67756 | 137.36600 | −4427.443 | 76 |
| 1172 | 72 | −4.67829 | 137.36625 | −4425.727 | 131 |
| 1173 | 72.4 | −4.67902 | 137.36606 | −4424.946 | −175 |
| 1174 | 72.9 | −4.67922 | 137.36572 | −4424.908 | 177 |
| 1179 | 75 | −4.67924 | 137.36573 | −4424.848 | 176 |
The results from this period are shown in Fig. 8 and discussed in Section 3.1. Wherever EBs are shown for a given hour in Fig. 5 but no wind results appear in Fig. 8, this indicates that there was too much electronic noise for the wind data to be useable. In some cases, only one or two 5 min periods in a given 1 h EB produced useful wind results, while in others no useful results were obtained at all. For example, out of the 19 sols shown in Fig. 8, only 4 sols have any useable wind data between 23:05 and 07:30, and then only within a single hour each. And although 29 1-hr EBs were scheduled between 21:00 and midnight, only 9 of those hours produced more than 20 min of noise-free wind data.
2.6.2. REMS during the Namib Dune Lee Investigation, MSL sols 1194–1215 (Ls ~82–91°)
The Namib Dune Lee Investigation examined the change to the wind pattern in the lee of a large dune. Table 2 shows the rover location and heading during this period, while Fig. 6 shows REMS EBs over the same sol range. Rover positions in the lee of the dune (post-drive on sol 1194 to pre-drive on sol 1215) are shown by the yellow symbols in Fig. 1. At the end of the sol 1194 drive, the rover was at the lower left corner of the dune, only just into its lee (see Fig. 1), with a NNW heading (−31°). However, for 20 sols from the end of the sol 1196 drive until the drive on sol 1215, the rover was fully in the lee of the dune with a SW heading (~ −125°). Such a heading would not have been optimal for measuring daytime winds outside the lee of the dune, since it precludes measuring winds from the N or NE, but it proved to be ideal for winds in the lee of the dune due to their more westerly direction, as described in Section 3.2.
Table 2.
End-of-drive rover locations and headings during the Namib Dune Lee Investigation.
| MSL sol | Ls (°) | Latitude (°N) | Longitude (°E) | Elevation (m) | Rover heading (°) |
|---|---|---|---|---|---|
| 1192 | 81.2 | −4.67959 | 137.36717 | −4421.85 | 152 |
| 1194 | 82 | −4.68022 | 137.36755 | −4419.62 | −31 |
| 1196 | 82.9 | −4.68005 | 137.36802 | −4419.91 | −125 |
| 1204 | 86.4 | −4.68004 | 137.36802 | −4419.91 | −125 |
| 1215 | 91.3 | −4.67967 | 137.36721 | −4421.91 | −30 |
2.6.3. Namib Dune Side Investigation, MSL sols 1216–1243 (Ls~92–104°)
Table 3 shows the rover location and heading during the Namib Dune Side Investigation, while Fig. 7 shows the REMS EBs over the same sol range. From the drive on sol 1216 until the drive on sol 1243 (locations shown as red symbols in Fig. 1), the rover was parked just onto the western side of Namib Dune, facing a heading of either −14° or −20° These NNW headings were ideal for several reasons: to monitor daytime winds; to place the field-of-view of the REMS Ground Temperature Sensor (which points out toward the right and slightly toward the back of the rover) over deep dune sand; and to provide good lighting angles for imaging the dune. Measuring daytime wind speeds was vital to support the aeolian ‘change detection’ experiments described in Section 1. These headings were also good for relay orbiter communications. To achieve all of this it was necessary to drive the rover fully onto the dune and then turn in place with all six wheels on sand, in order to put dune sand in the arm’s workspace and enable various instrument investigations. The results from this period are discussed in Section 3.3.
Table 3.
End-of-drive rover locations and headings during the Namib Dune Side Investigation.
| MSL sol | Ls (°) | Latitude (°N) | Longitude (°E) | Elevation (m) | Rover heading (°) |
|---|---|---|---|---|---|
| 1216 | 91.7 | −4.67905253 | 137.3670338 | −4424.15 | −14 |
| 1221 | 94.4 | −4.67899471 | 137.3670962 | −4423.76 | −20 |
| 1243 | 104.2 | −4.67906369 | 137.3671141 | −4423.52 | −128 |
3. Wind Investigations during the Bagnold Dunes Campaign
The following sections present REMS wind measurements made during the Wind Investigations described in Section 2.6. Note that these results do not represent all of the wind data taken during the Bagnold Dunes Campaign, but rather focus on these three periods of particular interest.
3.1. Wind Characterization Investigation on approach to the Bagnold Dunes, MSL sols 1162–1179 (Ls~67–75°)
The Wind Characterization Investigation was designed to characterize the wind field just outside the dunes, along the path shown by the blue symbols in Fig. 1. Fig. 8 shows the wind directions and speeds over this period. The SW to SE rover headings prior to the drive on sol 1162 enabled early morning westerlies and evening easterlies/southerlies to be measured well, as indicated by the blue arrows in the top row of Fig. 8 indicating ‘front’ winds. However, the wind was predominantly from the ‘rear’ (shown by red arrows) from ~10:00 to 17:00 or 18:00. The rover was therefore turned to face NW at the end of its drive on sol 1162, and remained at this heading until the drive on sol 1167, although 2 sols were largely lost due to an uplink failure. This heading was chosen to optimize daytime wind measurements, and Fig. 8 clearly shows the impact: good wind direction and speed data were obtained throughout these sols from about 08:00 to 18:00, providing a much clearer picture of the daytime wind pattern near the dunes. Morning westerly winds turn to become predominantly northwesterlies around 10:00, with the occasional northerly wind too, and with the strongest winds occurring in the early afternoon between about noon and 15:00 (although strong winds are also measured briefly at around 09:00). Finally at around 18:00 the wind direction changes to come from somewhere to the rear of the rover, and the red arrows return.
After the drive on sol 1168 the rover was turned to face another atypical direction, this time ENE, remaining in this heading until the drive on sol 1172. This heading was optimized for measurements of evening winds, which typically turn between 17:00 and 18:00 to become easterly, northeasterly, or southeasterly winds, and are increasingly southeasterly to southerly after ~20:00 (Fig. 8). Despite the fixed location of the rover while it was at this heading, the results over these 4 sols demonstrate considerable sol-to-sol variability in wind direction, with e.g. easterly winds still occurring as late as 23:00 on some sols. A detailed correlation with temperature variations may provide insight into the source of this variability, but is beyond the scope of this paper. For example, a correlation between large temperature fluctuations and altered wind directions may suggest a shift in the downslope circulation, affecting both dynamical heating and winds.
The Wind Characterization Investigation also included several sols with more ‘typical’ headings of between SW and SE. This was vital to capture ‘front’ winds for those headings at the current location and season, and at the higher measurement density permitted during the Campaign. The rover faced SW between the sol 1167 and 1168 drives, SE between the sol 1172 and 1173 drives, and S following the sol 1173 drive. These headings were ideal for measuring late evening downslope winds with a large southerly component. Unfortunately, many of the late evening (hence colder) measurement periods were lost due to noise. Despite this, the same trend is again observed as for the previous heading: lots of sol-to-sol variability after 17:00 or 18:00, with more easterly winds in some sols and more southerly winds at the same time in others. Predominantly southeasterly and southerly winds, with occasional south southwesterly winds, then occur until the latest time observed (about midnight). Peak 5 min averaged wind speeds are slower than during the daytime, although it is possible that stronger winds occurred (but were not measured due to sensor noise) later at night. Note that the previous heading (ENE) provided more accurate information for easterly winds, whereas these more typical (S) headings provided more accurate information for southerly winds. Thus, in combination, wind speed and accurate wind directions were obtained for both easterly and southerly winds in the mid to late evening.
The timing of the early evening ‘wind reversal’ (from northerly to southerly winds) appears from Fig. 8 to shift earlier (from about 18:00 to 17:00) over the course of this investigation, with the period of easterly winds also reduced in later sols. These changes could be associated with the rover moving closer to the dune topography over this period, as shown in Fig. 1. However, in addition to blue front wind arrows, these later sols also have red (rear) wind arrows in some 5 min periods after 17:00, 18:00, or even (in sol 1173) 19:00. Considering the S rover heading for these sols and examining the range of wind directions implied by the red arrow orientations (westerlies through northerlies from 17:00 to 18:00, and northerlies through easterlies after 19:00), this is consistent with the pattern of northwesterlies turning to easterlies found earlier. In addition, the red arrows at about 18:00 in sols 1170 and 1171 indicate at least some southerly winds in the early evening in those sols. So the alteration in the wind pattern is likely more muted than appears at first glance.
In summary: at Ls ~67–75°, on approach to the Bagnold Dunes, the 1.5 m wind direction at MSL shifts from westerlies before ~10:00 to northwesterlies with occasional northerlies, with peak 1.5 m wind speeds in the early afternoon. At around 17:00 or 18:00 the wind direction changes again to easterlies then to predominantly southeasterlies/southerlies, although the timing of the wind reversal and the duration of the easterlies varies greatly from sol to sol. There is generally clockwise turning of the wind direction between the upslope/downslope periods, particularly in the morning. The loss of many EBs to noise makes it impossible to form a complete picture of the overall circulation, particularly the strength and direction of downslope nighttime winds, for this location and season. However, the ~08:00 to midnight dataset is extremely useful for comparison with mesoscale model predictions, and well-validated models may be used to fill in the missing nighttime period (see Sections 5 and 6).
3.2. Namib Dune Lee Investigation, MSL sols H94-I2I5 (Ls~82–91°)
The Namib Dune Lee Investigation examined the change to the wind pattern in the lee of a large dune, at the locations shown as yellow symbols in Fig. 1. The top of Namib Dune (just above the slip face) sits about 3.5 m above the surface upon which the rover sat whilst in the lee of the dune (just next to the slip face). By comparison, the REMS wind sensor is at about 1.5 m height. Fig. 9 shows the entire wind dataset at these locations. Prior to fully entering the lee of the dune, the wind pattern is similar to that observed during the earlier wind characterization investigation (Section 3.1), with westerlies before about 10:00 and north-westerlies/northerlies until at least 18:00. After the sol 1196 drive, however, the wind pattern changes noticeably. Instead of the westerlies turning to north-northwesterlies around 10:00, the wind continues to have a large westerly component until about 18:00, coming from primarily the northwest and west, and even coming from the southwest about a fifth of the time. This pattern continues until the rover drives back out of the lee of the dune on sol 1215.
Fig. 9.
As in Fig. 8 but for but for sols 1192 to 1216, covering the Namib Dune Lee Investigation. (For interpretation of the references to color in this figure legend, the reader is referred to the web version of this article.)
The significant change in the wind pattern supports the idea that near-surface daytime winds approaching the dune from the north are ‘blocked’ from reaching the lee by the dune itself, instead being forced to come around the dune from the west, with some winds so diverted that they have a strong southerly component by the time they reach the rover. The change to the wind speed distribution in the dune’s lee is also very significant, as shown in Section 3.4.
3.3. Namib Dune Side Investigation, MSL sols 1216–1243 (Ls~92–104°)
The Namib Dune Side Investigation was designed to measure daytime winds at the side of the same dune, at the locations shown by red symbols in Fig. 1, largely in support of aeolian change detection experiments (see Section 1). Fig. 10 shows the entire wind dataset at these locations. Due to cold temperatures, wind retrievals are not available prior to ~08:00 and there are few measurements after ~20:00, although since headings were optimized for daytime ‘upslope’ wind directions the wind often comes from a ‘rear’ direction after ~18:00 anyway. However, these sols provided an excellent opportunity to assess the extent of sol-to-sol variability in daytime winds, in addition to identifying the basic circulation within the dune field over roughly half of the diurnal cycle. In particular, wind directions between ~18:00 and 21:00 appear to be somewhat variable, with REMS sometimes measuring front winds (northeasterlies) but more often measuring rear winds (which could be anything from southerlies to easterlies), increasingly so as the evening progresses. The timings of the main shifts in wind direction appear very repeatable, however, occurring soon after 10:00 and soon after 18:00 in almost every sol.
Comparing Figs. 8 and 10 reveal mainly similarities between the daytime winds during the two periods (the Wind Characterization and Namib Dune Side Investigations) when the rover was not in the lee of the dune. The main difference is the reduced westerly component of the upslope winds during the latter period, with more north-northwesterly than northwesterly winds. Peak 5 min-average wind speeds on the side of the dune are also higher than those measured during the Wind Characterization Investigation. It is unclear from the REMS data alone whether these differences are due to the later season (Ls~92–104° versus 67–75°) of the Namib Dune Side Investigation or the location of the rover on the side of a large dune, which may have affected the local wind flow. This is discussed further in Section 5.1.2.
3.4. Changes to the wind speed distribution in the three Campaigns
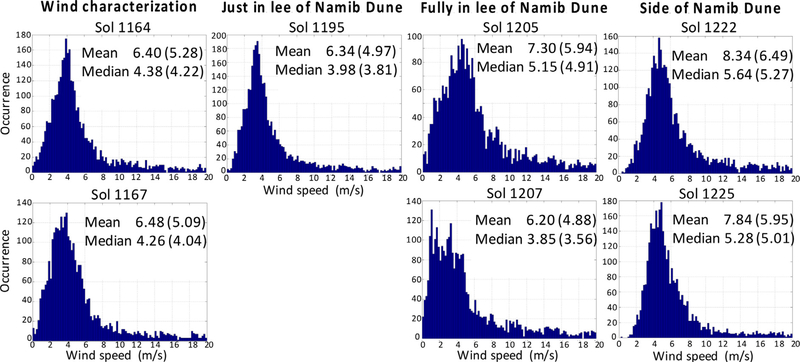
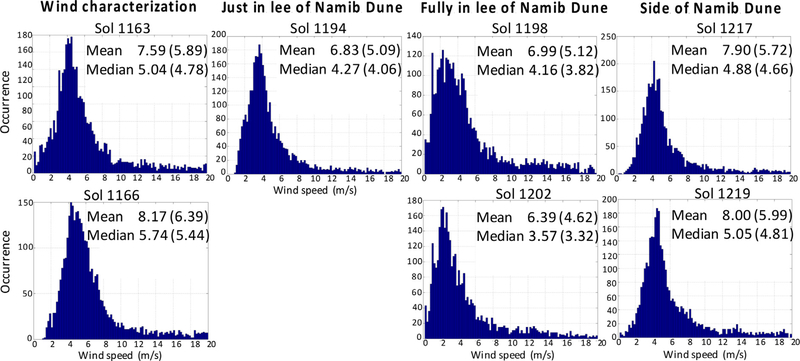
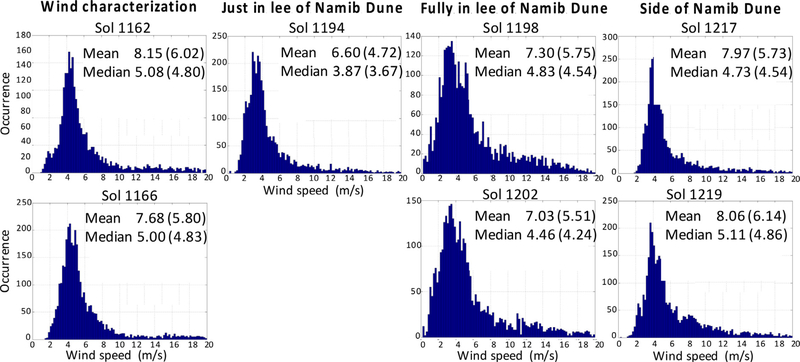
The Figures shown previously used the 5 min averaged wind speed data available in the PDS. By contrast, Figs. 11, 12 and 13 show histograms of the 1 Hz wind speed data (not currently available in the PDS) from 11:0 0-noon, 14:00–15:0 0, and 15:0 0–16:0 0 LMST, respectively, for sols that are representative of different portions of the Campaign: the Wind Characterization Investigation; the 2 sols just in the lee of Namib Dune; the 20 sols fully in the lee of Namib Dune; and the Namib Dune Side Investigation. The hour-long periods were chosen to be those in which front winds dominate (i.e., the wind vectors are all blue in Figs. 8, 9 and 10), so that the wind speeds are representative of the dominant wind at those times. This means that the sols used in each Figure may differ, but the corresponding plots are still representative of the same portion of the Campaign. 1 Hz wind speeds greater than 20 m/s are not shown in the histograms, due to increased uncertainty above this speed in the present retrieval algorithm. Work on improving the algorithm is underway so that the higher end of the wind speed spectrum can be studied with more confidence, allowing these results to be used to e.g. investigate the threshold wind stress for sand motion, as described in Section 1.
Fig. 11.
Second-by-second wind speeds between 11:00 and noon for seven sols spanning the first part of the Bagnold Dunes Campaign. Wind speeds higher than 20 m/s are not shown due to increased uncertainty above this speed in the present retrieval algorithm. Note that the sols shown for each period in Figs. 11, 12 and 13 are chosen for the number of good, front wind observations, thus different sols are sometimes used depending on the REMS measurement cadence, rover heading, noise, etc. The mean and median wind speeds (in m/s) are also shown. Numbers in parentheses give the mean and median over only the wind speed range shown (i.e., from 0–20 m/s).
Fig. 12.
As in Fig. 11 but now for winds between 14:00 and 15:00.
Fig. 13.
As in Fig. 11 but now for winds between 15:00 and 16:00. The same sols are shown as in Fig. 12, except for the upper left plot which shows sol 1162 rather than 1163.
The main features of all three Figures is the broadening of the wind speed distribution for the location fully in the lee of Namib Dune compared to the rest of the Campaign. This effect is consistent with an increase in wind variance in the dune’s lee, resulting from the development of turbulent structures, as noted in Large Eddy Simulations of dunes on Earth and Mars (Omidyeganeh et al., 2013; Jackson et al., 2015). As a part of this broadening, the lee is one of the few locations where a significant wind fraction with speeds below 2 m/s is observed, particularly in the 15:0 0–16:0 0 period when almost no winds this weak are found elsewhere. Similarly, the lee wind distributions show a larger fraction of winds at higher wind speed values. It should be noted that a broadening effect is not seen when the rover sits barely in the dune’s lee at its SW tip, nor do the winds change to westerlies there, suggesting that it is only further into the lee of the dune that blocking occurs.
4. The MarsWRF model
MarsWRF is the Mars version of the planetary Weather Research and Forecasting (WRF) model (planetWRF), which is based upon the terrestrial WRF model developed by the National Center for Atmospheric Research (NCAR) ( Skamarock et al., 2008 ). Richardson et al., (2007) provides details of the dynamical framework and grid setup, which includes a Runga–Kutta solver on an Arakawa C-grid, as well as discussing the model’s conservation properties and basic setup for Mars. Richardson et al. (2007) also describes the vertical mixing scheme used here (referred to in thatpaper as the MRF PBL scheme; Hong and Pan (1996) ) and the model’s CO 2 scheme which allows a portion of the CO 2 atmosphere to freeze out onto the surface if any point in the vertical column becomes supersaturated and allows CO 2 to sublime back into the atmosphere if the near-surface atmosphere over CO 2 ice becomes sub-saturated.
Mischna et al. (2012) provides details of the radiative transfer scheme used here, while Toigo et al. (2012) provides details of the prescribed atmospheric dust distribution seen by the radiative transfer scheme (the Mars Climate Database’s ‘MGS’ dust distribution; Montmessin et al. (2004)), and of the surface properties (albedo, emissivity, thermal inertia, topography, and roughness, derived from Mars Global Surveyor [MGS] Thermal Emission Spectrometer [TES] and Mars Orbiter Laser Altimeter [MOLA] datasets) used in the simulations presented here.
4.1. Setup of MarsWRF for these simulations
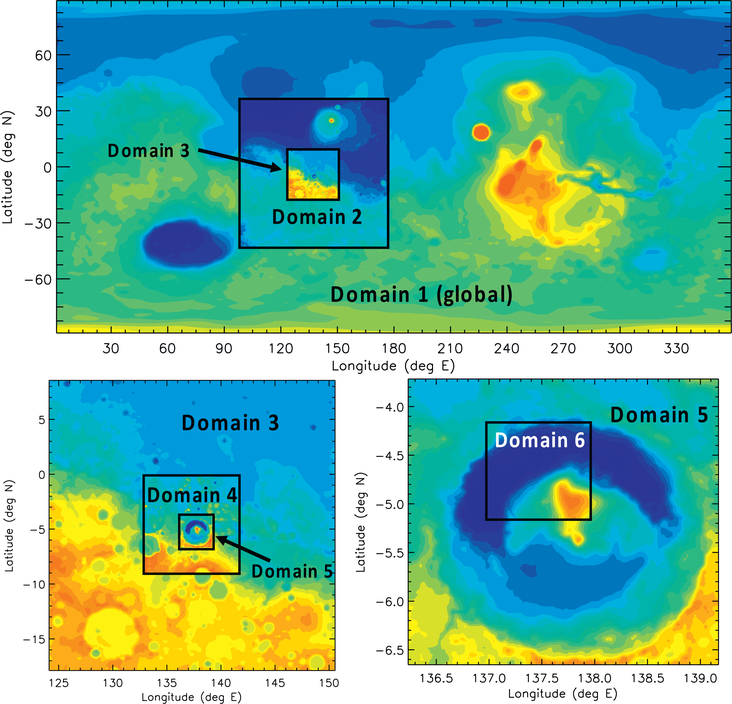
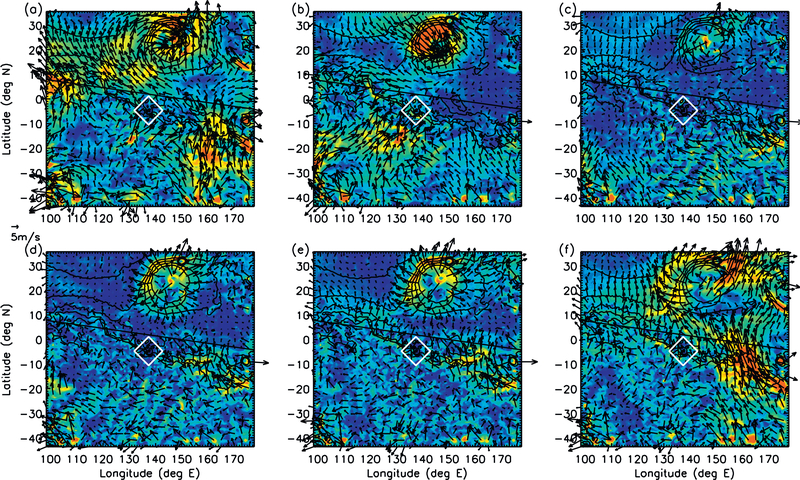
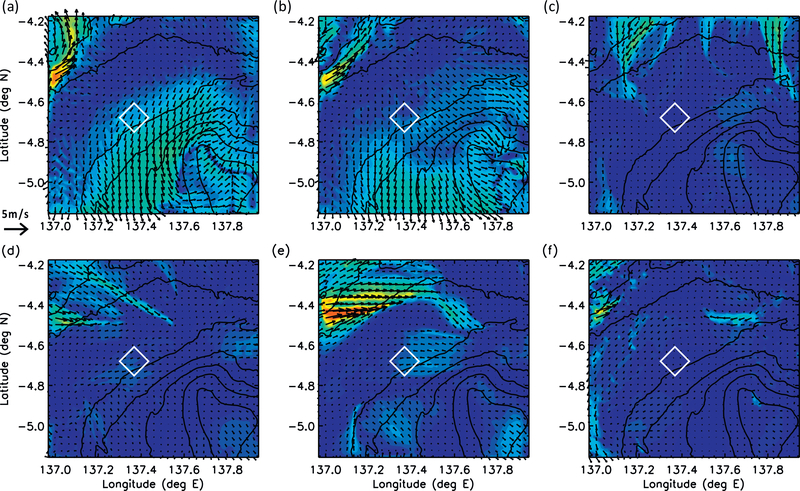
MarsWRF was run here as a 2° horizontal resolution global model with five embedded higher-resolution domains or ‘nests,’ as shown in Fig. 14. Each child domain sits inside its parent and covers a smaller area at three times higher resolution, resulting in a horizontal resolution of ~490 m in the innermost nest (domain 6), which sits inside Gale Crater covering the Bagnold dune field. The nests are ‘2-way’ meaning that the parent not only forces the child domain, but changes to the child domain also influence the parent. The global domain (domain 1) has a dynamical solver time step of 60 s, with domains 2–6 having time steps of 20 s, 3.3 s, 1.1 s, 0.37 s and 0.12 s, respectively. The radiative transfer code is called every 15 min in every domain. The model outputs surface pressure and temperature, and wind and air temperature at 1.5 m above the surface (roughly the height of the REMS wind sensor booms; see Section 4.2), every minute from domains 5 and 6. Topography from the High Resolution Stereo Camera (HRSC) on Mars Express was used in the two highest resolution nests, domains 5 and 6 (Gwinner et al., 2010). In each simulation, the vertical grid spacing is the same across all domains (see Table 4).
Fig. 14.
The topography in each of the MarsWRF domains used in these simulations. Domain 1 is global and has a horizontal resolution of 2° (~119 km) in longitude and latitude. Domains 2 through 5 are centered over Gale Crater and ‘nested’ inside each other, with a threefold increase in resolution from the parent to child next, giving them resolutions of ~39.5 km,~13.2 km, ~4.39 km, and ~1.46 km, respectively. Domain 6 is centered over the Bagnold Dunes and has a resolution of ~490 m.
Table 4.
Height above surface of the center (midpoint) of MarsWRF vertical layers at the location of Namib Dune for the two vertical grids used in this work. Grid A heights correspond to equal mass layers (layers with constant spacing in pressure, here 0.025 Pa) for layers 5 through 43, with the mass in the lowest 4 layers approximately halved in each consecutive layer below layer 5, to increase the vertical resolution near the surface. Grid B heights correspond to 42 equal mass layers, now with a constant pressure spacing of 0.0238 Pa in all layers. See Section 4.3.3 for more discussion of vertical grids A and B.
| Layer | Height at center (m) |
Layer | Height at center (km) |
Layer | Height at center (km) |
|||
|---|---|---|---|---|---|---|---|---|
| Grid A | Grid B | Grid A | Grid B | Grid A | Grid B | |||
| 1 | 10.1 | 145.3 | 16 | 4.4789 | 5.4925 | 31 | 13.6276 | 15.1255 |
| 2 | 40.3 | 439.2 | 17 | 4.9170 | 5.9454 | 32 | 14.5741 | 16.1511 |
| 3 | 101.0 | 740.1 | 18 | 5.3710 | 6.4155 | 33 | 15.6024 | 17.2743 |
| 4 | 223.4 | 1048.4 | 19 | 5.8422 | 6.9041 | 34 | 16.7284 | 18.5162 |
| 5 | 461.6 | 1364.5 | 20 | 6.3321 | 7.4129 | 35 | 17.9734 | 19.9059 |
| 6 | 778.4 | 1688.3 | 21 | 6.8421 | 7.9436 | 36 | 19.3666 | 21.4851 |
| 7 | 1103.2 | 2020.9 | 22 | 7.3742 | 8.4982 | 37 | 20.9498 | 23.3160 |
| 8 | 1436.6 | 2362.4 | 23 | 7.9303 | 9.0792 | 38 | 22.7852 | 25.4987 |
| 9 | 1779.0 | 2713.5 | 24 | 8.5127 | 9.6892 | 39 | 24.9735 | 28.2101 |
| 10 | 2131.0 | 3074.7 | 25 | 9.1242 | 10.3313 | 40 | 27.6918 | 31.8134 |
| 11 | 2493.0 | 3446.5 | 26 | 9.7680 | 11.0093 | 41 | 31.3041 | 37.2873 |
| 12 | 2865.9 | 3829.8 | 27 | 10.4476 | 11.7275 | 42 | 36.7918 | 50.2749 |
| 13 | 3250.1 | 4225.2 | 28 | 11.1676 | 12.4911 | 43 | 49.8123 | |
| 14 | 3646.4 | 4633.5 | 29 | 11.9331 | 13.3064 | |||
| 15 | 4055.7 | 5055.6 | 30 | 12.7505 | 14.1813 | |||
Note that for all simulation results presented in this paper the global model was first initialized with a pre-set total (global) amount of atmospheric CO 2 and then ‘spun up’ by being run for at least one Mars year until the CO2 cycle had stabilized (i.e., some of the atmosphere freezing out to form seasonal caps) and a repeatable annual pressure cycle been established. Unlike other mesoscale models, MarsWRF is able to evolve and fully treat the CO2 cycle and global thermal tides due to having a global domain 1. Guo et al. (2009) describes how polar cap properties can be adjusted in the global model to provide an exact match to any observed annual pressure cycle dataset. Although this tuning was not done for the specific simulations shown here, as matching the annual pressure cycle exactly was not the goal of this work, the match in this season is still very close (as shown in e.g. Fig. 15a, the diurnal mean pressure is off by only ~15 Pa). Only then were the mesoscale simulations performed, with each subsequent domain begun 6 h after its parent. The model was then run for multiple sols, with the first sol of data from domain 6 not used, to avoid any concern over spin-up issues.
4.2. Extrapolating to find winds at the height of the REMS wind sensor
Unlike some mesoscale model results that have been presented for comparison with the REMS dataset (e.g. Pla-Garcia et al., 2016), all results shown in this paper are extrapolated down to the approximate height of the REMS wind sensors, ~1.5 m above the surface. Note that placing a model level at ~1.5 m to prognostically determine the winds here would violate the assumptions inherent in the PBL scheme (see Section 4.3.2). The extrapolation of the wind vector below the lowest prognostic layer follows the well-known log-wind profile, as modified for applicability to stable, neutral, and unstable conditions (e.g. Stull, 1988; Stensrud, 2007). This profile is semi-empirical and is assumed to be valid over the depth of the surface layer; a further assumption is that the REMS measurement height is always within the surface layer. The extrapolated wind velocity is derived from the definition of the frictional velocity as used in the WRF MRF and YSU boundary layer schemes (following Zhang and Anthes (1982) and Hong et al. (2006)):
where u* is the frictional velocity, k is the von Karman constant (0.4), za is the height of the lowest prognostic level, Va is the total wind speed at the lowest prognostic level, z0 is the roughness length scale, and m is the similarity function profile for momentum as calculated in the boundary layer scheme(where m = 0 for a purely neutral atmosphere). The stability function is a function of depth and thus the wind speed (V1 ) at any depth (z1 ) in the surface layer can be found from:
Finally, it is assumed that the horizontal wind vector components at height z1 (u1, v1) scale in the same away as the total wind speed:
4.3. Potential sensitivity of the predicted circulation to model setup
The mesoscale simulations with MarsWRF are likely sensitive to several aspects of the model setup and forcing. Sensitivity to model forcing, related to the specification of aerosol heating (dust and water ice) and cap properties (which dominate the CO 2 cycle and hence the seasonal evolution of surface pressure) discussed in Section 4.1, is not examined in this work as it likely does not strongly impact the near-surface circulation.
This section describes three areas in which the model setup may affect the near-surface circulation predicted by the model. The first is the choice of horizontal resolution and its relationship to the assumptions built into parameterized PBL schemes; the second is the choice of PBL scheme and more generally the issue of how to represent vertical mixing in models down to the resolutions obtained in current mesoscale models (e.g. domain 6 at 490 m horizontal and 10 m vertical grid spacing close to the surface); and the third is the sensitivity to the choice of vertical grid structure / resolution.
Section 6 demonstrates how the REMS wind dataset and other observations can be used to better constrain these setup choices, and presents results from one sensitivity study. It is important to note that the ‘correct’ choice is typically not known a priori and most of these topics represent ongoing areas of study in the fields of terrestrial and planetary science. Also, in some cases what is needed to increase realism in one respect causes problems elsewhere, thus the best ‘solution’ is sometimes to find the compromise that provides the best match to observations.
4.3.1. Horizontal resolution and the ‘Terra Incognita’ problem
Traditional modeling assumes a scale break between the meso- and micro-scales. Specifically, most traditional PBL schemes assume that the full ensemble of eddy scales are treated within a given single horizontal grid cell (e.g. Stensrud, 2007) and that none of the eddy field is explicitly resolved. In the real atmosphere, the largest eddies occur during the daytime with depths of a few kilometers to well over 10 km, depending on location. Horizontal-to-vertical aspect ratios of large eddies typically vary from 1–4, so the assumption that eddies are being properly statistically sampled within a given grid box starts to break down at domain 3 (~12 km grid spacing) for the MarsWRF setup described here, and becomes highly questionable by domain 6 (~490 m grid spacing). Note that this is a widespread problem and these domain resolutions are comparable with other Mars mesoscale models (e.g. Pla-Garcia et al., 2016).
The transition regime of resolution, where there is both decreasingly validity of the PBL scheme and the increasing tendency for the higher resolution domains to begin expressing explicit (and likely aliased) convection, is known in the terrestrial literature as the “Terra Incognita” (e.g. Wyngaard et al., 2004). For terrestrial atmospheres, the concern over partial eddy spectrum resolution is leading to increased emphasis on “scale aware” parameterization schemes that partition convective representation between resolved dynamics and subgrid scale schemes. This need is highlighted for Mars since important topographic (and thermophysical) variations occur on scales that demand model resolution at scales already deeply within the martian Terra Incognita. However, this development is beyond the scope of the current paper.
4.3.2. Choice of sub-grid scale parameterizations of vertical mixing
The representation of vertical mixing available within MarsWRF ranges from 2 and 2.5 level (1 and 1.5 order, respectively) closure methods, which are appropriate for use in non-eddy resolving simulations (e.g. Hu et al., 2010), to isotropic and non-isotropic schemes designed for use in eddy-resolving models (e.g. Kirkilet al., 2012). WRF’s MRF scheme (Hong and Pan, 1996) is an example of a 2 level closure method (calculation of closure terms from the non-eddy variables), while WRF’s Mellor-Yamada-Janjic (MYJ) scheme (Janjić, 2001) is an example of a 2.5 level (calculation of closure using a prognostic turbulence kinetic energy variable) closure method. The MRF scheme used in this work assumes that the meteorologically-defined surface layer is contained entirely within the lowest model layer and thus very high vertical resolution is unwarranted (indeed, violates an assumption of the scheme). As mentioned in the prior subsection, the scheme is also built on the assumption that the full statistical population of convective eddies is contained laterally within a grid cell. Similar assumptions apply to 2.5 level closure methods, such as that used in the MYJ scheme.
Note that this work only uses the MRF scheme (akin to the MRF scheme used in the Oregon State University Mars version of the NCAR Mesoscale Model version 5 (Tyler and Barnes, 2013)), while most Mars GCMs and the MRAMS mesoscale model use schemes based on the MYJ method. The sensitivity to PBL scheme has not been addressed in the martian literature, nor have the implications of partial (and likely aliased) large eddy resolution. Such studies will require calibration of mesoscale simulations against carefully designed LES experiments, but are beyond the scope of the current paper.
4.3.3. Vertical grids used in this work
There are three major areas of concern in the choice of vertical resolution: first, whether the model has sufficient resolution to properly represent potential shallow flows such as drainage (true cold buoyancy slope) flows; second, whether the lowest layers of the model are resolved in a manner consistent with the representation of the meteorologically defined surface layer; and third, whether there is sufficient resolution near the top of the boundary layer to properly represent entrainment and growth. The default vertical grid used in this study is very similar to those used in other models, with the lowest layer centered at about 10 m (grid A, Table 4). However, this may provide over-resolution of the surface layer during the daytime - while the PBL scheme is based on an assumption that the surface layer is always within the lowest model layer, the daytime surface layer is likely several model layers deep using grid A. To examine the sensitivity of the model to resolution of the surface layer, results using another grid with its lowest layer at about 145 m (grid B, Table 4) are examined in Section 6.
5. Combining REMS winds and modeling to understand the circulation at the Bagnold Dunes
This section compares the REMS wind data with predictions from the MarsWRF atmospheric model (Richardson et al., 2007; Toigo et al., 2012) to further demonstrate the power of this dataset in understanding circulations in Gale Crater and improving Mars mesoscale modeling overall. Comparing mesoscale model wind predictions with in situ circulation data enables the model’s performance to be tested, with areas of disagreement pointing to errors or omissions in the model’s dynamics or physics schemes that can be improved until the model predictions match the observations available. Once a model has been ‘validated’ in this manner, it can be used with more confidence to provide better predictions of near-surface winds for times and locations where they were not measured.
5.1. Comparison between MarsWRF predictions and REMS observations
The results shown below come from simulations run at Ls ~60° and Ls ~90° to span the behavior over the three Wind Investigations. While domain 6 resolves topography and other horizontal surface variations at scales of ~490 m, this is too low to resolve individual dunes in the horizontal direction. Thus the model cannot fully capture the change in wind speed and direction as a function of precise location in and around the dune field, or the impact of being in the lee of Namib Dune. Similarly, these domains will not resolve the full turbulent spectrum of wind speeds measured by REMS. Instead, they provide more of a spatial average over the area of a grid cell, with peak wind speeds that will be lower than the peak wind gusts measured by REMS.
The following Figures show MarsWRF domain 6 instantaneous winds extrapolated to 1.5 m height (see Section 4.2), output from the model every minute. Due to the relatively low resolution of the model grid compared to smaller scale turbulence, more frequent output provides only a smooth variation with time, and would provide no additional information in terms of peak wind speeds, turbulence statistics, etc. In addition, although the REMS wind data are measured every second, all Figures show only the 5 min-averaged REMS wind data (from the PDS), unless otherwise noted. These observations should thus be appropriate for comparison with the model output. Overall, with the above caveats, it should be reasonable to compare the MarsWRF mesoscale model domain 6 wind predictions with the general pattern of wind direction and speed as it evolves over a sol, except where very fine scale topography is expected to dominate (such as in the lee of a large dune).
5.1.1. During the Wind Characterization Investigation
Fig. 3 shows the diurnal cycle of winds in the region of Gale Crater surrounding the location of the Bagnold Dunes Campaign, for Ls~60° (late southern fall). Also shown is topography, with the region dominated by the N rim of the crater (top of each plot) and the roughly NW-facing slope of Aeolis Mons, which has its peak in the Crater’s center (near the bottom right of each plot). The Bagnold Dunes Campaign took place in the center of the white diamond, on the NW slope of Aeolis Mons. In these snapshots, winds on this slope are broadly upslope during the day, either northerlies or northeasterlies, as shown in the plots for noon and 16:00. Conversely, winds are downslope (southeasterlies) at night, as shown in the plots for 20:00, midnight, and 04:00. The plot at 08:00 has the weakest winds of all the times shown, with winds that are neither strongly upslope or downslope, and the result for 17:00 (not shown) is similar.
Fig. 15 shows a comparison between REMS observations during the Wind Characterization investigation (Ls~67–75°) and eight sols of MarsWRF predictions at the same location and approximate time of year (Ls~60–64°), now showing the full diurnal cycle of results. As well as wind speed and direction, a comparison between simulated and observed pressure, ground temperature, and air temperature diurnal cycles are also shown. The broad shape and amplitude of the diurnal pressure cycle is captured fairly well by MarsWRF, although the mean pressure is very slightly higher than observed (see Section 4.1) and the model only shows a hint of the local minima at ~06:00 and 22:00 due to the model not fully replicating the strength of the semi-diurnal tide in this area (Guzewich et al., 2016). This is most likely due to the vertical distribution of low-latitude dust being incorrect and its interaction with solar forcing thus not producing exactly the observed combination of tidal amplitudes, rather than local influences of topography etc. on the pressure cycle. Ground temperatures match very well to those measured by REMS, as do air temperatures overall. The MarsWRF predictions do not produce the same degree of air temperature fluctuations as measured, however, and are slightly lower than observed in the hours following dawn.
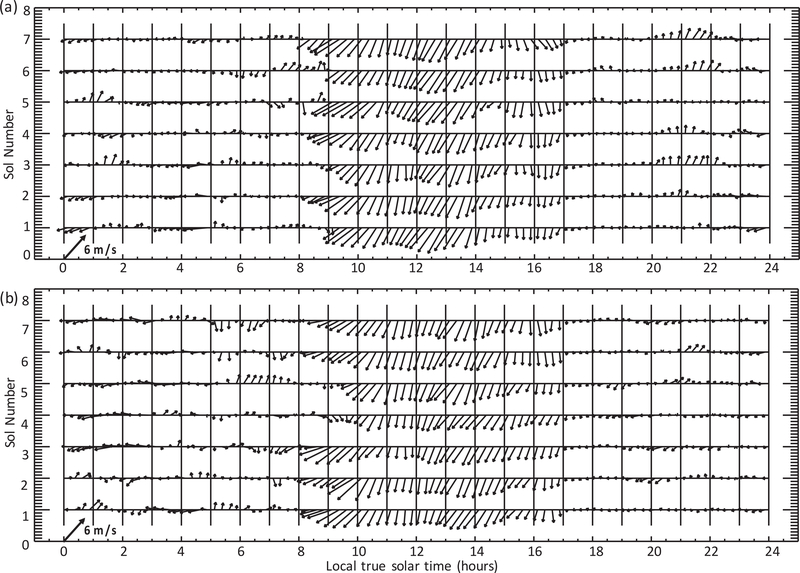
The bottom row of Fig. 15 shows a comparison between the predicted and measured wind speeds and directions separately, while Fig. 16 provides a comparison of predicted and measured wind vectors. Fig. 16 includes both a composite plot (top) showing 5 sols of good REMS wind data and a plot showing 8 sols of MarsWRF predictions (bottom), all averaged over 15 min periods. The composite REMS data plot was produced by retaining only complete hours with no rear winds observations (or more precisely, no 5 min periods in which rear winds dominated), to make sure that the front wind observations were representative rather than anomalous, and then looping through sols until either the end of the investigation period was reached or five front wind observations had been obtained in every 15 min period. For some times of sol (e.g. from midnight until 08:00) there were no such ‘representative’ front wind observations, whereas at a few times of sol they existed in fewer than 5 sols out of the 19 sols total (e.g. at 23:45). However, at least 5 sols of good wind data were available for nearly every 15 min period between 08:00 and 22:00.
Fig. 16.
Wind vectors as in Fig. 8 but now showing (a) a composite 5 sols for the Wind Characterization Investigation and (b) 7 sols of the MarsWRF domain 6 simulation at Ls~60° at the location at the midpoint of the Investigation. The composite plot was produced as described in Section 5.1.1.
The model captures the overall trend in wind speed variations between ~11:00 and midnight, including the observed rapid large decrease in wind speed shortly before 18:00, which coincides with a rapid change in wind direction. However, the modeled daytime wind speeds are generally ~2–4 m/s weaker than observed, the wind speed also shows a drop not seen in the observations between ~13:30 and 15:00, and the model does not capture the short-lived but rather repeatable increase in wind speed at around 09:00. Note that wind speeds in the lowest model layer are several m/s stronger than the extrapolated wind speeds at 1.5 m (see Section 4.2), and would have been comparable in magnitude (cf. the stronger wind speeds shown in Pla-Garcia et al. (2016), taken from the center of their lowest model layer at~15 m). However, the extrapolation method uses the same vertical profile of mixing used to mix momentum within the PBL inside the model, thus comparing with the extrapolated 1.5 m winds is far more consistent and appropriate.
MarsWRF-predicted wind directions show quite good agreement overall with those measured by REMS. In particular, the model predicts winds from a northern direction through much of the daytime, and captures the turning of winds to upslope at around 10:00 and to easterlies/southeasterlies between 17:00 and 18:00, although this seems to occur slightly earlier in the model. The downslope wind directions (primarily southeasterlies in the early evening turning to more southerlies later) are particularly well captured by the model. The model also predicts clockwise rotation of wind vectors between the upslope/downslope periods, which predominantly occurs in the REMS measurements. The main discrepancies are in the exact direction of the peak daytime winds, with the model predicting primarily north-northeasterly winds until ~15:00, whereas REMS measured winds from the northwest over this period. This may be due in part to the influence of small-scale topography, which cannot be resolved by the model.
5.1.2. During the Namib Dune Investigations
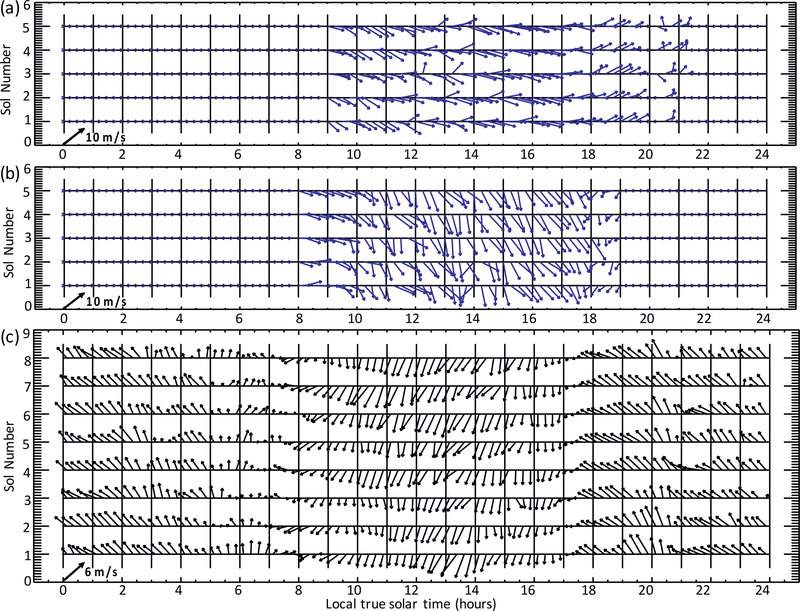
Figs. 17 and 18 show a comparison between REMS observations made during the Namib Dune Lee Investigation (Ls~82–91°) and the Namib Dune Side Investigation (Ls 92–104°), respectively, and MarsWRF predictions for Ls~90–94° Note that the MarsWRF results are the same in both plots, since the difference in location is too small to make a difference in a ~490 m resolution model. Fig. 19 shows a 5-sol composite plot of wind arrows for both the Namib Lee and Side Investigations as well as 7 sols of MarsWRF predictions, again for Ls~90–94° Although the Wind Characterization Investigation REMS composite plot was constructed using only complete hours with no rear wind observations, the Namib Dune REMS composite plots were constructed using some evening hours with rear wind observations, but only if the majority of wind observations showed winds from the front. This relaxation of the original requirement was necessary due to the smaller evening wind dataset available at the slightly colder season of the Namib Dune Investigations (see Section 2.6).
Fig. 19.
As in Fig. 16 but now showing (a) a composite 5 sols for the Namib Dune Lee Investigation, (b) a composite 5 sols for the Namib Dune Side Investigation, and (c) 8 sols of the MarsWRF domain 5 simulation at Ls~90° at the location of the Namib Dune Side Investigation. The composite plots were produced as described in section 5.1.2.
For the Namib Dune Lee Investigation, the overall MarsWRF simulation of the pressure and temperature cycles is comparable in quality to that during the Wind Characterization investigation. The biggest outlier in temperature in this period is the increase in observed daytime ground temperatures during the first sols shown (colored dark purple and purple), which corresponds to when the rover sat at the edge of Namib dune (only just into its lee). This may be due to different surface properties at that location (e.g. a lower thermal inertia) compared to the later position of the rover, fully into the lee of the dune.
For the Namib Dune Side Investigation, both ground and air temperature show less agreement with the model predictions. This is most likely due to the placement of the rover fully on sand during this period, with the ground temperature sensor’s field of view completely over dune sand which would be expected to have a lower thermal inertia than the adjacent sand-free surface. This would result in a greater amplitude in the diurnal cycle of ground temperatures, since sand heats more during the daytime and cools more at night. Indeed, a rapid increase in the daytime peak in ground temperature is very noticeable in the dark purple curve that shows sol 1216, when the drive took the rover onto sand at around 14:00. The observed morning air temperatures are also warmer than predicted by the model from shortly after dawn until ~noon in all sols shown.
The other notable differences between the Namib Lee and Namib Side results are the wind speeds and directions, as discussed in Section 3. The 5 min averaged wind speeds in the lee of the dune (Fig. 17) are suppressed by about 1 m/s in the middle of the day compared to those at the side of the dune (Fig. 18), and this is not captured at the resolution of the model used for these simulations. However, the smooth mid-afternoon peak in wind speed, and the dip in wind speed (coincident with a rapid change in wind direction) within about an hour of 18:00, appear similar in both cases and are largely captured by the model. Also, the model again predicts daytime wind speeds ~2–4 m/s slower than observed.
Since the MarsWRF simulations do not resolve the dune topography, a far better match is produced between MarsWRF predictions and observed daytime wind directions on the side of the dune than in its lee, where dominant daytime northerly or northwesterly winds are blocked by the dune and turned to westerlies (see Section 3.2). However, whereas the Namib Side observations show a reduced westerly component to the daytime winds and a delay in turning from upslope to downslope winds in the evening, compared to the Wind Characterization Investigation, this is not reflected in the MarsWRF predictions. Comparing Figs. 16 and 19 shows very similar modeled winds for Ls~60–64° (closer to the Wind Characterization Investigation) and for Ls ~90–94° (closer to the timing of the Namib Dune Investigations). This suggests that most of the observed changes between the Characterization and Namib Side Investigations may be due to the presence of the dune rather than the evolving season. I.e., the continuation of winds with a northerly component until later into the evening on the side of Namib Dune may be due to the dune body itself blocking winds from the southeast, leaving only less frequent winds from the north or northeast - or incoming southeasterly winds that are deflected to flow around the dune to the east - able to reach the wind sensor.
5.1.3. Daytime-evening wind speed differences
One notable difference is the relative speed of the daytime versus evening winds in the model compared to those measured by REMS. As discussed in Section 2.6, the duration of noise-free wind data in the evening was reduced as the Bagnold Dunes Campaign progressed, due to colder air temperatures as Gale passed into local winter. Also, the Namib Lee and Side Campaign had primarily rover headings that were optimal for daytime rather than evening winds. For these reasons, any comparison between model predictions and observed wind strengths should be focused on the Wind Characterization investigation results shown in Figs. 15 and 16.
While the measured wind speeds decline rapidly at around 17:00 and remain lower for the rest of the evening, the modeled wind speeds decline at the same time but then pick up again and remain fairly comparable to daytime wind speeds overnight. The result is that, whereas MarsWRF typically underestimates daytime wind speeds (less so around noon, but by a factor of as much as four at ~09:00 and as much as three midafternoon), the predicted evening wind speeds are far more similar to those measured by REMS. This is discussed in more detail in Section 6.
5.2. Winds in regional context
Figs. 20, 21 and 22 show 1.5 m wind vectors and wind magnitudes at Ls~60° at 6 times of sol for the whole of MarsWRF domains 5, 4, and 2, respectively. The relative coverage of each nested domain is shown in Fig. 14. Clearly evident in Fig. 20 is the dominance of daytime upslope flows and nighttime downslope flows, both on the slopes of Aeolis Mons and the crater rim. Conversely, weak winds are present throughout the sol in the portions of the ‘trough’ surrounding Aeolis Mons that are furthest from the slopes. Another noticeable feature is the abrupt change in surface wind pattern at the edge of the crater rim for incoming winds, in particular the moderately strong northerly and north-northwesterly winds arriving at the NW of the crater at 16:00 (plot b), which may be resisted by the upslope crater rim winds here and do not penetrate further in. This suggests that around local winter solstice the interior of Gale Crater is largely cut off from outside regional circulations and dominated by topographically-driven flows.
Fig. 20.
As in Fig. 3 but showing the whole of domain 5.
Fig. 21.
As in Fig. 3 but showing the whole of domain 4.
Fig. 22.
As in Fig. 3 but showing the whole of domain 2.
Fig. 21 further demonstrates the lack of connection between near-surface winds inside Gale Crater and the regional flows that dominate in this region around local winter. The hemispheric dichotomy boundary runs nearly diagonally across domain 4, with lower regions to the upper right and higher regions to the lower left of each plot. Regional winds are dominated by daytime upslope winds (peaking in the 16:00 plot, b) and nighttime downs-lope winds (peaking in the 04:00 plot, e), but the near-surface winds in Gale Crater (in the center of the domain) appear unaffected by these flows. The strong southerly flow in Fig. 21 f is in fact part of a larger scale circulation: the south-to-north ‘return’ flow of the Hadley circulation for this time of year approaching northern summer solstice. The global mean solsticial circulation consists of rising motion in northern mid-latitudes, motion at upper levels across the equator from north to south, descent in southern midlatitudes, and return flow across the equator from south to north. As shown in Fig. 22, there is clearly net strong flow from the south overall in the larger region surrounding Gale (domain 2). Yet it is highly location dependent (showing up most clearly in the zonal mean, not shown) and does not appear to determine the direction of flow right by the dichotomy boundary, where slope flows dominate (e.g. in plot b, incoming southwesterlies appear to be ‘stopped’ by the daytime upslope flows seen more clearly in close-up in Fig. 21b). And as discussed above, this global scale flow does not appear to influence near-surface winds in Gale at all at this season.
Modeling that removes all regional and global scale influences - such as LES modeling of Gale Crater with no imposed background winds - would be needed to definitively show that the results predicted by mesoscale modeling are due entirely to the crater topography, however. It is also possible that the model underpredicts the amount of mixing between upper and lower layers and the penetration of flows into the crater, and so over-restricts the influence of external circulations (see discussion in Section 6.3).
Finally, it is important to note that these observations and results are for a single season around local winter solstice, and are likely not representative of all times of years. Indeed, as shown in modeling by Pla-Garcia et al. (2016) and Rafkin et al. (2016), external flows are predicted to penetrate into the crater and influence the circulation measured by REMS far more in local summer (starting at Ls = 270°), when the PBL is greatly expanded and there is more interaction between the crater interior and outside flows. In local summer, the global circulation results in very strong ~northerly near-surface winds at low latitudes in general. During the daytime, these may act to reinforce the regional hemispheric dichotomy flow and the local upslope flow on the NW slopes of Aeolis Mons, while at night they may reinforce downslope flows on the north crater rim, which may affect the location of MSL if they penetrate far enough into the crater floor. Thus local summer likely contains the strongest wind speeds, due to the greater influence of these external flows.
6. Using REMS winds and other observations to constrain the model setup
Section 4.3 discussed some of the assumptions and settings within the MarsWRF model that are not well-constrained a priori and in many cases represent ongoing areas of study in the fields of terrestrial and planetary science. This section investigates the sensitivity of results to the vertical resolution in the lowest atmospheric layers and the impact on the match to wind observations. It also shows the impact on the predicted characteristics of aeolian dunes and the match to those observed in Gale Crater, and notes the importance of in situ wind data to constrain models rather than relying entirely on less direct evidence for winds. Finally, it discusses the need for a different modeling approach (e.g. Large Eddy Simulations) that requires fewer sub-grid scale parameterizations and avoids most ‘Terra Incognita’ issues, although LES modeling would involve its own inconsistencies and issues.
6.1. Impact of reduced near-surface vertical resolution on the overall wind regime
The MarsWRF simulations described above were performed with vertical grid A shown in Table 4, which has three layers with their centers at 10, 45, and 101 m. By contrast, Fig. 23 through 25 show results from an otherwise identical simulation using vertical grid B, in which the lowest layer’s center is at 145 m. Fig. 23 shows the same results as Fig. 3 (domain 6 wind vectors and magnitudes at six times of sol at Ls~60°), using the same scaling as in Fig. 3, but now using grid B with its lower vertical resolution near the surface. The main difference is the relative strength of the nighttime versus daytime winds, with the former being far weaker than the latter when grid B is used. This is because with the new grid the model is unable to resolve the strong, near-surface nighttime drainage flows down the slope of Aeolis Mons that were predicted in the original simulation. However, it still simulates strong daytime upslope flows, which occur over a broader vertical region of the atmosphere.
Fig. 23.
As in Fig. 3 but showing results from a MarsWRF simulation using vertical grid B.
Fig. 25.
As in Fig. 16 but now showing 7 sols of MarsWRF domain 6 results at Ls~60° (top) and 90° (bottom) from a simulation using vertical grid B, for comparison with Figs. 16 and 19, respectively.
Fig. 24 shows the impact of using vertical grid B on the match to REMS observations during the Wind Characterization (top) and Namib Side (bottom) Investigations, and can be compared with the results using grid A shown at the bottom of Figs. 15 and 18, respectively. Similarly, Fig. 25 shows wind vectors predicted at Ls~60–64° (top) and 90–94° (bottom) using vertical grid B, and can be compared with the observed and previously predicted (using grid A) wind vectors shown in Figs. 16 and 19. In the case of the Wind Characterization Investigation, the daytime winds are very similar using either grid between ~11:00 and 17:00. However, using grid B the model predicts an initial strong peak in wind speed at 09:00, which matches the peak observed. Also, as measured by REMS, the modeled wind speeds remain relatively low during the evening and overnight after their sharp drop at around 17:00, whereas using grid A the model predicts an increase in evening wind speeds back to almost midday values. The new grid does not improve the match to observations overall, however. Although the simulated wind speed at 09:00 is a better match to observations if using grid B, the match to the observed wind directions is worse. This suggests that the better match in wind speed may be produced by the wrong circulation element. More significantly, although the day-night difference in wind speed is more like that measured, this is because the predicted nighttime wind speeds are now far lower than observed, not because the predicted daytime wind speeds are higher.
Fig. 24.
Wind speeds and directions observed by REMS (color) during the Wind Characterization (top) and Namib Side (bottom) Investigations, compared with MarsWRF domain 6 results (black) at Ls~60° and 90° using results from a simulation using vertical grid B. The top row should be compared with the bottom row of Fig. 15, and the bottom row compared with the bottom row of Fig. 18.
This work does not, therefore, necessarily point to grid A producing an over-estimation of the strength of nighttime downslope drainage flows, although that may be occurring to some extent. Nor does it provide a solution to why the modeled daytime winds are generally far weaker than observed, which may be due rather to the PBL scheme used insufficiently mixing momentum down from upper layers during the daytime, for example. This work does, however, point to the importance of closely examining the details of the model setup and assessing the sensitivity to different elements before relying on the results of any simulation.
6.2. Impact of reduced near-surface vertical resolution on aeolian dune characteristics
The morphology and movement of dunes is dependent on sand transport fluxes, and it is possible to combine wind predictions over the full Mars year with aeolian theory (e.g. Rubin and Hunter, 1987; Courrech et al., 2014) to predict the expected sand transport direction, orientation, and type of dune. Predictions using winds from MarsWRF simulations using vertical grids A and B are shown in Figs. 26 and 27, respectively. In each case, the winds came from twelve simulations (each lasting 8 sols with only the final 7 sols used) equally spaced through the Mars year. Minute-by-minute sand fluxes were estimated by assuming the Lettau and Lettau (also known as the Fryberger) sand flux formulation (Lettau and Lettau, 1978; Fryberger et al., 1979) and a saltation threshold of 0.01 Pa (Ayoub et al., 2014). The dune directions of motion (black arrows) were then given by the direction of net sand flux over the year, while the dune orientations (black lines) were found using the Gross Bedform-Normal Transport hypothesis (Rubin and Hunter, 1987). Note that the Fingering Mode hypothesis of Courrech du Pont et al. (2014) is another viable mechanism for the formation of these dunes, and will be considered in a future paper. The regions of long linear dunes and Barchan/Barchanoid dunes are also marked in green and red, respectively.
Fig. 26.
Predicted dune motion directions (black arrows) and dune orientations using the Gross Bedform-Normal Transport hypothesis with a threshold of 0.01 Pa (black lines) based on MarsWRF winds predicted using vertical grid A. The green ovals indicate general regions of long linear dunes and the red ovals general regions of transverse Barchan / Barchanoid dunes, based on the mapping of Day and Kocurek (2016). (For interpretation of the references to color in this figure legend, the reader is referred to the web version of this article.)
Fig. 27.
As in Fig. 26 but showing dune predictions based on MarsWRF winds predicted using vertical grid B. (For interpretation of the references to color in this figure legend, the reader is referred to the web version of this article.)
The results using grid A winds suggest that sand transport from the ~SE should dominate in the region of the dunes, and that most dunes in this region should be morphodynamically ‘transverse’ (i.e., that the transport direction and dune orientation should be close to perpendicular (Kocurek, 1996)). Dune orientations are also roughly 45° (i.e., ~SW-NE) over most of the region. However, al-though the long linear dunes in the Bagnold Dune Field have a similar orientation to this, they are not transverse dunes, and the main transverse dunes in the region (Barchans / Barchanoid dunes) typically have more ~W to E orientations. Finally, the morphology of the Barchans and also observations of dune motion (e.g. Silvestro et al., 2013) indicate dominant sand transport from the ~NE rather than the SE.
By contrast, the results using grid B suggest that sand transport from the ~NE should dominate across the Bagnold Dune Field, and predict longitudinal dunes in roughly the region of the observed long linear dunes, with increasingly transverse dunes to the north (close to where the observed transverse Barchan / Barchanoid dunes sit). These results also predict ~SW to NE dune orientations (though with a more W-E component), becoming increasingly WE in the region of the Barchan / Barchanoid dunes, which is again more consistent with observations.
Although the match to observed dune characteristics is still not perfect, the predictions based on wind results using vertical grid B are far superior to those using grid A. This is due in part to generally weaker nighttime downslope winds off Aeolis Mons, but is largely the result of greater penetration into the crater floor of strong nighttime northerly flows from the north crater rim in southern summer (Ls~270–360°) when using grid B.
6.3. Discussion
In the absence of in situ data, the comparison between observed and predicted aeolian features shown in Section 6.2 might have suggested that grid A - despite its better vertical resolution near the surface - does a poorer job of representing reality, perhaps because the finer grid resolution is inconsistent with the assumptions inherent in the PBL scheme used (see Section 4.3.2). The results shown in Section 6.1, however, suggest that even though grid B appears to provide a better match to some circulation aspects at Ls~60–90°, it under-predicts the strength of winds at all times of sol, and does a poorer job of matching observed wind directions at some times of sol. While it is possible that grid B is more appropriate overall, and that another factor is responsible for suppressing wind strength in general in MarsWRF - e.g., unrealistically low downward mixing of momentum by the PBL scheme used - grid B alone clearly does not solve every problem. This work therefore points to the need for high quality in situ wind data that can be used - as shown here - to constrain the model’s assumptions, rather than relying on observations that merely depend on wind in some manner, thus risking getting the ‘right’ result for the wrong reason.
Further examination of in situ wind data at different seasons should provide more constraints on the setup used in mesoscale simulations, from the horizontal and vertical grid spacing to the surface and boundary layer schemes and parameters used. However, as discussed in Section 4.3.1, these simulations are hampered by sitting inside the Terra Incognita, i.e., by being run at resolutions where many basic assumptions of sub-grid scale parameterizations do not hold. Yet running the simulations at lower resolutions would not allow them to capture variations in topography and other surface properties at the scales required to properly represent the circulation inside Gale Crater.
One alternative would be to run a Large Eddy Simulation across the whole of Gale Crater at much higher resolution - say 100 m, at which the smallest eddy that could be resolved would be ~300 m across. In such a simulation, the sub-grid scale parameterizations would be completely switched off, and it would rely on the model atmosphere to explicitly capture motions at most important scales. Such a LES could be driven by the output of a mesoscale model further out of the Terra Incognita range (e.g. domain 4, run at ~4 km grid spacing) using one-way forcing to capture the effects of large-scale flows, and would also do a better job of resolving the fine scale topography, approaching the scale of the dunes themselves. Results from such simulations, and their implications for mesoscale modeling, will be presented in a future paper.
7. Summary and conclusions
REMS wind observations are presented for late local fall and early winter, in the area of the Bagnold Dunes reached by MSL in late 2015 during the Bagnold Dunes Campaign. These observations demonstrate that valuable information on wind speeds and directions can be obtained when the rover (and hence the functional REMS wind sensor boom) is facing into the hemisphere from which the wind blows and the air temperature is above ~200 K (reducing electronic noise). These conditions were met most broadly during an initial “Wind Characterization Investigation” centered at Ls~70° (late local fall), which included diverse and atypical rover headings to capture winds at all times of sol, and was early enough in the season that a greater number of ‘cold’ (early morning or late evening) winds could be measured. The basic pattern of winds was ‘upslope’ (northwesterlies heading up Aeolis Mons) during the daytime (~09:00 to 17:00 or 18:00) and ‘downslope’ (southeasterlies heading down Aeolis Mons) at night (~20:00 to some time before 08:00). Between these times, the wind rotated generally clockwise to turn from one primary direction to the other, giving roughly westerlies mid-morning and roughly easterlies in the early evening. The timings of these direction changes were relatively consistent from sol to sol; however, the wind direction and wind speed at any given time showed considerable intersol variability.
Close to Ls~90° (local winter solstice), MSL spent several sols in the lee of Namib Dune. During the Namib Dune Lee Investigation the dominant local daytime winds (northerlies or northwesterlies) were largely blocked by the dune. Winds instead flowed around the dune to the west before reaching the rover, resulting in more westerly winds throughout the day. REMS also measured a broadening of the 1 Hz wind speed distribution in the lee of the dune. Although the 5 min-average wind speeds were slightly lower than those measured shortly thereafter at the side of the dune, with far more second-by-second winds below 2 m/s, there was also an increase in the high wind speed tail of the 1 Hz distribution. This suggests an increase in wind variance in the dune’s lee due to the creation of turbulent structures (Omidyeganeh et al., 2013).
After Ls~90°, MSL spent tens of sols at the side of Namib Dune. During the Namib Dune Side Investigation, winds were obtained in basically only one rover heading (NNW), which resulted in good daytime wind speed and direction measurements. Northeasterlies were measured well into the evening and appeared to represent at least a significant fraction of the total wind field, although there was evidence for downslope southeasterly winds (off Aeolis Mons), too. This may suggest that dune-scale flows partially overcame the larger-scale topographically-driven crater flows on the side of the dune.
MarsWRF ~490 m resolution model predictions at the same times and locations show quite good agreement with the REMS results and are able to fill in some of the missing times of sol, particularly between ~20:00 and 08:00. The model predicts roughly the same patterns in 1.5 m wind speed and direction, and generally captures the timing of the transition from downslope to up-slope winds in the morning, the dip in wind speed and turn in wind direction as the wind transitions from upslope to downslope in the early evening, and the predominantly clockwise rotation between upslope/downslope directions. Evening wind speeds are also comparable to those measured by REMS.
One area of disagreement is the main daytime (~10:00–17:0 0 or 18:00) wind direction: the model predicts northerly through northeasterly winds whereas REMS measured winds with a greater westerly than easterly component. Another area of disagreement is the relative magnitude of daytime versus nighttime wind speeds, with MarsWRF underpredicting the strength of daytime winds measured by REMS by ~2–4 m/s. The model also fails to capture the peak in wind speed at ~09:00 during the Wind Characterization Campaign.
A simulation using a vertical grid with lower near-surface resolution captures the wind speed peak at 09:00 and also has weaker nighttime versus daytime winds in the season of the Bagnold Dunes Campaign. Over the entire year, this vertical grid also predicts a dominant wind (and sand transport) direction that is far more consistent with the characteristics and motion of dunes in this region. However, the predicted wind directions at 09:00 do not agree as well with those observed, and although the day-night balance is more realistic this is due to the model predicting overly weak winds at night (due to not resolving the shallow drainage flow down Aeolis Mons) rather than predicting stronger winds during the day. It therefore appears that more work is needed to find the most realistic model setup, such as using a higher order turbulence closure scheme to parameterize sub-grid scale boundary layer mixing, which may result in greater daytime mixing of momentum down from upper layers. In addition, the horizontal grid spacing of the highest resolution domains used in this work - needed to capture fine details of topography in Gale Crater - place these results inside the “Terra Incognita,” where eddies are partially resolved even as their effects are being parameterized by horizontal and vertical mixing schemes. This issue, combined with largely unexplored sensitivities to the sub-grid scale parameterizations used, motivate a need for carefully designed Large Eddy Simulation experiments, the results of which can be used to calibrate parameterization schemes.
Although the dataset is missing much of the overnight REMS winds, the overall wind pattern around local winter solstice - both in the observations and the model - appears to be largely dominated by the upslope-downslope flow on the slopes of Aeolis Mons. Winds from the north (from northwesterlies to northeasterlies) dominate during the daytime, while southeasterly winds dominate after dark. Regional and global circulation components - such as the global Hadley circulation return flow (from ~south to north at this time) or the larger-scale slope flow across the topographic dichotomy boundary that passes through Gale (which flows from ~NE to SW during the day and ~SW to NE at night) - do not appear to significantly affect the near-surface winds in Gale Crater in this season. Modeling of these circulations shows them ending abruptly before entering Gale, although as discussed by Rafkin et al. (2016) this is not true in all seasons, and regional circulations likely have a far greater influence in local summer (Ls~270°). Overall, these REMS wind sensor data suggest that Gale is largely separated from its surroundings around local winter solstice, and that slope flows dominate then in the vicinity of the Bagnold Dunes.
In addition to the missing nighttime wind data, due to electronic noise below a temperature of ~200 K, there are seasonal gaps in even the daytime REMS wind dataset (not shown). This is due to long periods over which the rover drove in or faced one direction almost continuously. This includes the period around Ls~270° and much of the period around Ls~180° in both Mars years measured to date. Although there are many logistical difficulties and safety concerns in turning the rover purely to obtain better wind measurements, the importance to the Mars community of characterizing the seasonally evolving wind field as MSL explores Gale Crater is recognized by the MSL science team. Thus, in addition to measurements made opportunistically at atypical rover headings, a future regular activity was planned in which the rover would be turned to face an atypical direction for several sols within ~15° of both equinoxes and solstices (i.e., Ls = 0, 90, 180, and 270°), in order to obtain front wind measurements at any times of sol that were lost repeatedly in the previous few tens of sols. The first of these activities was carried out between sols 1398 and 1417, at Ls~180° Unfortunately, since that time there has been deterioration of the remaining wind sensor boards, possibly due to impacts by lofted particles during high wind events, although the cause has not yet been confirmed. Work to investigate these issues is ongoing, however this greatly reduces the likelihood of successful future REMS wind retrievals.
Nevertheless, the existing REMS wind speed and direction dataset is an invaluable resource for studying the circulation inside a large martian crater and understanding aeolian processes active in Gale Crater today. Speeds can be related to thresholds for saltation to occur, while directions and speeds relate to the orientation, shape, and movement of active aeolian features. These data are also vital for refining, improving, and validating numerical models, particularly in regions of significant topography for which in situ data were not available prior to MSL. Once properly constrained, these models should provide a realistic description of the wind field that avoids the data gaps and biases inherent in the original REMS dataset. They can then be applied to present day aeolian issues, and adapted with more confidence to questions involving the past climate, weather, and aeolian environment of Gale Crater and Mars as a whole. As of December 2016, the 5 min-averaged wind dataset through sol 1417 is already available in the PDS, with further deliveries scheduled for the future. Eventually the 1 Hz dataset will also be added to the PDS release, facilitating additional studies.
Acknowledgments
This work was funded by NASA Mars Fundamental Research Program grant number NNX11AF59G and Mars Science Laboratory grant number 1449994. All MarsWRF simulations were performed on NASA’s High End Computing Pleiades cluster at NASA Ames. The REMS wind dataset shown here would not have been obtained without the efforts of this paper’s co-authors plus numerous other MSL team members, in particular the ENV STL-KOPs who were on duty during the Bagnold Dunes Campaign (Christina Smith, Jake Kloos, Casey Moore, Emily Mason, Raymond Francis, Tim McConnochie, and Michael Mischna), the REMS PULs (who have to work late into the night in Spain on almost every planning day), and Carrie Bridge and all of the terrific Rover Planners up at JPL. We also thank Michael Smith and Aymeric Spiga for their thoughtful and detailed reviews.
References
- Allison M, McEwen M, 2000. A post-Pathfinder evaluation of areocentric solar co-ordinates with improved timing recipes for Mars seasonal/diurnal climate studies. Planet. Space Sci. 48, 215–235. [Google Scholar]
- Ayoub F, Avouac J-P, Newman CE, Richardson MI, Lucas A, Leprince S, Bridges NT, 2014. Threshold for sand mobility on Mars calibrated from seasonal variations of sand flux. Nat. Commun. 5, 5096. doi: 10.1038/ncomms6096. [DOI] [PubMed] [Google Scholar]
- Bagnold RA, 1941. The Physics of Blown Sand and Desert Dunes. Methuen, New York, [Google Scholar]
- Courrech du Pont S, Narteau C, Gao X, 2014. Two modes for dune orientation. Geology 42 (9), 743–746, [Google Scholar]
- Day M, Kocurek G, 2016. Observations of an aeolian landscape: from surface to orbit in Gale Crater. Icarus 280, 37–71. doi: 10.1016/j.icarus.2015.09.042. [DOI] [Google Scholar]
- Domínguez M, Jiménez V, Ricart J, Kowalski L, Torres J, Navarro S, Romeral J, Castañera L, 2008. A hot film anemometer for the Martian atmosphere. Planet. Space Sci. 56, 1169–1179. doi: 10.1016/j.pss.2008.02.013. [DOI] [Google Scholar]
- Fryberger SG, 1979. Dune forms and wind regime In: McKee ED (Ed.), A Study of Global Sand Seas, USGS Professional Paper vol. 1052, US Geological Survey and United States National Aeronautics and Space Administration; Washington, DC, pp. 137–169. [Google Scholar]
- Gómez-Elvira J 38 co-authors, 2012. REMS: the environmental sensor suite for the Mars Science Laboratory rover. Space Sci. Rev 170, 583–640. [Google Scholar]
- Gómez-Elvira J 33 co-authors, 2014. Curiosity’s rover environmental monitoring station: overview of the first 100 sols. J. Geophys. Res. Planets 119, 1680–1688. doi: 10.1002/2013JE004576. [DOI] [Google Scholar]
- Guo X, Lawson WG, Richardson MI, Toigo AD, 2009. Fitting the Viking lander surface pressure cycle with a Mars General Circulation Model. J. Geophys. Res 114, E07006. doi: 10.1029/2008JE003302. [DOI] [Google Scholar]
- Guzewich SD, Newman CE, de la Torre Juarez M, Wilson RJ, Lemmon M, Smith MD, Kahanpää H, Harri A-Mthe REMS Science Team and MSL Science Team, 2016. Atmospheric tides in Gale Crater, Mars. Icarus 268, 37–49. doi: 10.1016/j.icarus.2015.12.028. [DOI] [Google Scholar]
- Gwinner K, Scholten F, Preusker F, Elgner S, Roatsch T, Spiegel M, Schmidt R, Oberst J, Jaumann R, Heipke C, 2010. Topography of Mars from global mapping by HRSC high-resolution digital terrain models and orthoimages: characteristics and performance. Earth Planet. Sci. Lett. 294 (3–4), 506–519. [Google Scholar]
- Haberle RM, Gomez-Elvira J, Atlaskin E, Barnes JR, De La Torre Suarez M, Hollingsworth JL, Kahre MA, Kauhanen J, Martin-Torres J, Mischna M, Newman CE, Paz Zorzano M, Rafkin SCR, Renno N, Richardson MI, Savijärvi H, Tyler D, Vasavada AR. the REMS Team, 2013. Meteorological predictions for the REMS experiment on MSL. accepted by Mars J April.
- Haberle RM, Gómez-Elvira J, de la Torre Juárez M, Harri A-M, Hollingsworth JL, Kahanpää H, Kahre MA, Lemmon M, Martín-Torres FJ, Mischna M, Moores JE, Newman C, Rafkin SCR, Rennó N, Richardson MI, Rodríguez-Manfredi JA, Vasavada AR, Zorzano-Mier M-P, REMS/MSL Science Teams, 2014. Preliminary interpretation of the REMS pressure data from the first 100 sols of the MSL mission. J. Geophys. Res. Planets 119 (3), 440–453. doi: 10.1002/2013JE004488. [DOI] [Google Scholar]
- Hamilton VE, Vasavada AR, Sebastián E, de la Torre Juárez M, Ramos M, Armiens C, Arvidson RE, Carrasco I, Christensen PR, de Pablo MA, Goetz W, Gómez-Elvira J, Lemmon MT, Madsen MB, Martín-Torres FJ, Martínez-Frías J, Molina A, Palucis MC, Rafkin SCR, Richardson MI, Yingst RA, Zorzano M-P, 2014. Observations and preliminary science results from the first 100 sols of MSL Rover Environmental Monitoring Station ground temperature sensor measurements at Gale Crater. J. Geophys. Res. Planets 119 (4), 745–770. doi: 10.1002/2013JE004520. [DOI] [Google Scholar]
- Harri A-M, Genzer M, Kemppinen O, Gomez-Elvira J, Haberle R, Polkko J, Savijärvi H, Rennó N, Rodriguez-Manfredi JA, Schmidt W, Richardson M, Siili T, Paton M, de la Torre-Juarez M, Mäkinen T, Newman C, Rafkin S, Mischna M, Merikallio S, Haukka H, Martin-Torres J, Komu M, Zorzano M-P, Peinado V, Vazquez L, Urqui R, 2014. Mars Science Laboratory relative humidity observations: initial results. J. Geophys. Res. Planets 119 (9), 2132–2147. doi: 10.1002/2013JE004514. [DOI] [PMC free article] [PubMed] [Google Scholar]
- Harri A-M, Genzer M, Kemppinen O, Kahnapää H, Gomez-Elvira J, Rodriguez-Manfredi JA, Haberle R, Polkko J, Schmidt W, Savijärvi H, Kauhanen J, Atlaskin E, Richardson M, Siili T, Paton M, de La TorreJuarez M, Newman C, Rafkin S, Lemmon MT, Mischna M, Merikallio S, Haukka H, Martin-Torres J, Zorzano M-P, Peinado V, Urqui R, Lepinette A, Scodary A, Mäkinen T, Vazquez L, Rennó N the REMS/MSL Science Team, 2014. Pressure observations by the Curiosity rover: initial results. J. Geophys. Res. Planets 119 (1), 82–92. doi: 10.1002/2013JE004423. [DOI] [PMC free article] [PubMed] [Google Scholar]
- Hong S-Y, Pan H-L, 1996. Nonlocal boundary layer vertical diffusion in a medium-range forecast model. Mon. Weather Rev 124, 2322–2339. [Google Scholar]
- Hong S-Y, Noh Y, Dudhia J, 2006. A new vertical diffusion package with an explicit treatment of entrainment processes. Mon. Weather Rev 134, 2318–2341. [Google Scholar]
- Hu X-M, Nielsen-Gammon JW, Zhang F, 2010. Evaluation of three planetary boundary layer schemes in the WRF model. J. App. Met. Climate 49, 1831–1844. doi: 10.1175/2010JAMC2432.1. [DOI] [Google Scholar]
- Jackson DWT, Bourke MC, Smyth TAG, 2015. The dune effect on sandtransporting winds on Mars. Nat. Commun 6, 8796. doi: 10.1038/ncomms9796. [DOI] [PMC free article] [PubMed] [Google Scholar]
- Janjic ZI, 2001. Nonsingular implementation of the Mellor-Yamada level 2.5 scheme in the NCEP Meso model. Natl. Centers Environ. Prediction Office 1–61 Note #437. [Google Scholar]
- Kahanpää H, Newman CE, Moores J, Zorzano M-P, Martín-Torres J, Navarro S, Lepinette A, Cantor B, Lemmon MT, Valentín-Serrano P, Ullán A, Schmidt W, 2016. Convective vortices and dust devils at the MSL landing site: annual variability. J. Geophys. Res. Planets 121, 1514–1549. doi: 10.1002/2016JE005027. [DOI] [Google Scholar]
- Kirkil G, Mirocha J, Bou-Zeid E, Katopodes Chow F, Kosovic B, 2012. Implementation and evaluation of dynamic subfilter-scale stress models for largeeddy simulation using WRF. Mon. Weather Rev. 140, 266–284. doi: 10.1175/MWR-D-11-00037.1. [DOI] [Google Scholar]
- Kocurek GA, 1996. Desert aeolian systems In: Reading HG (Ed.), “Sedimentary Environments: Processes, Facies and Stratigraphy,”, 3rd ed.. Wiley-Blackwell. [Google Scholar]
- Lettau K, Lettau HH, 1978. Experimental and micro-meteorological field studies of dune migration In: Lettau HH, Lettau K (Eds.). In: Exploring the World’s Driest Climate, 101 University of Wisconsin-Madison, Institute for Environmental studies, pp. 110–147. IES report. [Google Scholar]
- Martínez GM, Fischer E, Rennó NO, Sebastián E, Kemppinen O, Bridges N, Borlina CS, Meslin PY, Genzer M, Harri A-H, Vicente-Retortillo A, Ramos M, de la Torre Juárez M, Gómez F, Gómez-Elvira J the REMS Team, 2016. Likely frost events at Gale crater: analysis from MSL/REMS measurements. Icarus 280, 93–102. doi: 10.1016/j.icarus.2015.12.004. [DOI] [Google Scholar]
- Michaels TI, Colaprete A, Rafkin SCR, 2006. Significant vertical water transport by mountain-induced circulations on Mars. Geophys. Res. Lett 33, L16201. doi: 10.1029/2006GL026562. [DOI] [Google Scholar]
- Mischna MA, Lee C, Richardson MI, 2012. Development of a fast, accurate radiative transfer model for the Martian atmosphere, past and present. J. Geophys. Res 117, E10 0 09. doi: 10.1029/2012JE004110. [DOI] [Google Scholar]
- Montmessin F, Forget F, Rannou P, Cabane M, Haberle RM, 2004. Origin and role of water ice clouds in the Martian water cycle as inferred from a general circulation model. J. Geophys. Res 109, E10004. doi: 10.1029/2004JE002284. [DOI] [Google Scholar]
- Moores JE. 2015. Observational evidence of a suppressed planetary boundary layer in northern Gale Crater, Mars as seen by the Navcam instrument onboard the Mars Science Laboratory rover. Icarus 249, 129–142. [Google Scholar]
- Omidyeganeh M, Piomelli U, Christensen KT, Best JL, 2013. Large eddy simulation of interacting barchan dunes in a steady, unidirectional flow. J. Geophys. Res. Earth Surf 118, 2089–2104. doi: 10.1002/jgrf.20149. [DOI] [Google Scholar]
- Pla-Garcia J, Rafkin SCR, Kahre M, Gomez-Elvira J, Hamilton VE, Navarro S, Torres J, Marín M, Vasavada AR, 2016. The meteorology of Gale crater as determined from rover environmental monitoring station observations and numerical modeling. Part I: Comparison of model simulations with observations. Icarus 280, 103–113. doi: 10.1016/j.icarus.2016.03.013. [DOI] [Google Scholar]
- Rafkin SCR, Pla-Garcia J, Kahre M, Gomez-Elvira J, Hamilton VE, Marín M, Navarro S, Torres J, Vasavada AR, 2016. The meteorology of Gale Crater as determined from Rover Environmental Monitoring Station observations and numerical modeling. Part II: Interpretation. Icarus 280, 114–138. doi: 10.1016/j.icarus.2016.01.031. [DOI] [Google Scholar]
- Richardson MI, Toigo AD, Newman CE, 2007. PlanetWRF: a general purpose, local to global numerical model for planetary atmospheric and climate dynamics. J. Geophys. Res. (Planets) 112, E09001. doi: 10.1029/2006JE002825. [DOI] [Google Scholar]
- Richardson MI. Newman CE. 2017. Why the Diurnal Pressure Range at Gale Crater is So Large. Planet. Space Sci, accepted. [Google Scholar]
- Rubin DM, Hunter RE, 1987. Bedform alignment in directionally varying flows. Science 237 (4812), 276–278. [DOI] [PubMed] [Google Scholar]
- Skamarock WC co-authors, 2008. A Description of the Advanced Research WRF Version 3 NCAR Tech. Rep. TN-4751STR, 113 pp.
- Toigo AD, Lee C, Newman CE, Richardson MI, 2012. The impact of resolution on the dynamics of the martian global atmosphere: varying resolution studies with the MarsWRF GCM. Icarus 221 (1), 276–288. doi: 10.1016/j.icarus.2012.07.020. [DOI] [Google Scholar]
- Tyler D Jr., Barnes JR, 2013. Mesoscale modeling of the circulation in the Gale crater Region: an investigation into the complex forcing of convective boundary layer depths. MARS J. 8, 58–77. doi: 10.1555/mars.2013.0003. [DOI] [Google Scholar]
- Silvestro S, Vaz DA, Ewing RC, Rossi AP, Fenton LK, Michaels TI, Flahaut J, Geissler PE, 2013. Pervasive aeolian activity along rover Curiosity’s traverse in Gale Crater, Mars. Geology doi: 10.1130/G34162.1. [DOI] [Google Scholar]
- Smith MD, Zorzano M-P, Lemmon M, Martín-Torres J, Mendaza de Cal T, 2016. Aerosol optical depth as observed by the Mars Science Laboratory REMS UV photodiodes. Icarus 280, 234–248. doi: 10.1016/j.icarus.2016.07.012. [DOI] [Google Scholar]
- Spiga A, Lewis SR, 2010. Martian mesoscale and microscale wind variability of relevance for dust lifting. Mars 5, 146–158. doi: 10.1555/mars.2010.0006. [DOI] [Google Scholar]
- Stensrud DJ, 2007. Parameterization Schemes: Keys to Understanding Numerical Weather Prediction Models. Cambridge Univ Press. [Google Scholar]
- Stull RB, 1988. An Introduction to Boundary Layer Meteorology. Kluwer Acad., Norwell, Mass. [Google Scholar]
- Wyngaard JC. 2004. Toward numerical modeling in the “Terra Incognita. J. Atmos. Sci 61, 1816–1826. [Google Scholar]
- Zhang D, Anthes R, 1982. A high-resolution model of the planetary boundary layer: sensitivity tests and comparisons with SESAME-79 data. J. Appl. Meteorol. 21, 1594–1609. [Google Scholar]


