

Abstract
Background
Travel restrictions were implemented on an unprecedented scale in 2015 in Sierra Leone to contain and eliminate Ebola virus disease. However, the impact of epidemic travel restrictions on mobility itself remains difficult to measure with traditional methods. New ‘big data’ approaches using mobile phone data can provide, in near real-time, the type of information needed to guide and evaluate control measures.
Methods
We analysed anonymous mobile phone call detail records (CDRs) from a leading operator in Sierra Leone between 20 March and 1 July in 2015. We used an anomaly detection algorithm to assess changes in travel during a national ‘stay at home’ lockdown from 27 to 29 March. To measure the magnitude of these changes and to assess effect modification by region and historical Ebola burden, we performed a time series analysis and a crossover analysis.
Results
Routinely collected mobile phone data revealed a dramatic reduction in human mobility during a 3-day lockdown in Sierra Leone. The number of individuals relocating between chiefdoms decreased by 31% within 15 km, by 46% for 15–30 km and by 76% for distances greater than 30 km. This effect was highly heterogeneous in space, with higher impact in regions with higher Ebola incidence. Travel quickly returned to normal patterns after the restrictions were lifted.
Conclusions
The effects of travel restrictions on mobility can be large, targeted and measurable in near real-time. With appropriate anonymization protocols, mobile phone data should play a central role in guiding and monitoring interventions for epidemic containment.
Keywords: Ebola epidemic, travel restrictions, quarantine, mobile phone data, big data, human mobility, population mobility, Sierra Leone
Key Messages
Although there have been multiple modelling studies of the impact of travel restrictions, the empirical evidence base for this key class of epidemic intervention is weak.
Mobile phone call detail records (CDRs) hold potential for measuring the mobility impact of travel restrictions, lockdowns and regional quarantines in near real-time during epidemics.
We reveal that the 2015 lockdown in Sierra Leone in particular had a large, and easily measurable, impact on human mobility during this key phase of Ebola elimination.
Novel data sources such as mobile phone data can, at minimum cost, provide key information needed for monitoring and evaluating travel restrictions with respect to the possible benefits (e.g. on disease transmission, spatial spread and progress towards eradication) and harms (e.g. to human rights and commerce).
Introduction
Travel restrictions are some of the oldest, yet most controversial, approaches for epidemic control. This class of intervention ranges from ancient restrictions of the free association of people with leprosy1 to maritime quarantines in 13th century Venice2 and international air travel restrictions in the highly interconnected world of the 21st century.3 The ultimate goals of travel restrictions (e.g. geographical containment and transmission interruption) depend first and fundamentally on the impact of travel restrictions on changes to human travel behaviour.
Previous attempts to empirically measure the impact of travel restrictions have met limited success. Surveys have shown decreases in self-reported travel during outbreaks, but are qualified by recall, interviewer and social desirability biases.4,5 In a 2006 study, observed reductions in airline travel were correlated with delayed influenza spread,6 but important caveats7 remain for this approach which focuses only on airline travel—which may be in order of magnitude less frequent than local and regional travel.8 Specifically for travel bans and border closures during the 2014–15 Ebola epidemic, simulations assuming travel reductions exceeding 80% predicted limited impact on international disease diffusion;9 joining the call for quantification of previously unmeasured changes in mobility during the epidemic.10
Recently, mobile phone data have paved the way for new insights into human mobility dynamics. Researchers have previously used mobile phone CDRs to measure acute changes in human mobility patterns in response to events ranging from natural disasters to religious festivals.11–13 Although this new data source is accompanied by some known biases,14 CDRs can provide the necessary type of information for near real-time guidance, monitoring and evaluation of travel restrictions applied within a country. Members of the international community recognized the rich potential of these data and called for its responsible use during the epidemic of Ebola virus disease in West Africa.15,10
To demonstrate the utility of mobile phone CDRs for measuring the mobility impact of travel restrictions, we analyse the unprecedented travel restrictions implemented by the Government of Sierra Leone in an effort to eliminate Ebola in 2015. Much attention was given to the role of porous international borders in spreading the disease,16,17 but a recent comprehensive genomic analysis demonstrated that whereas international borders did provide some resistance to geographical spread, migration events within administrative areas were key drivers of disease spread.18 It follows that travel restrictions applied at a sub-national level may play a larger role in disease control than international travel restriction interventions, which were especially criticized by the international medical community as potentially ineffective9 and even counter-productive.19,20 In this paper, we aim to use routinely collected mobile phone data to measure changes in human mobility due to travel restrictions within Sierra Leone.
Methods
Data sources
We conducted a retrospective analysis of CDRs from over 1.6 million subscribers of a leading mobile phone operator in Sierra Leone between 20 March and 1 July 2015 (Figure 1). All identifiers were removed and subscribers were given a study-specific hashed ID that was not provided to the analysis team. Available data included the time-stamp of each call or short message service (SMS) event and the global positioning system (GPS) location of the tower that managed the request. Tower locations closely matched population density (Supplementary Figure 1, available as Supplementary data at IJE online).
Figure 1.
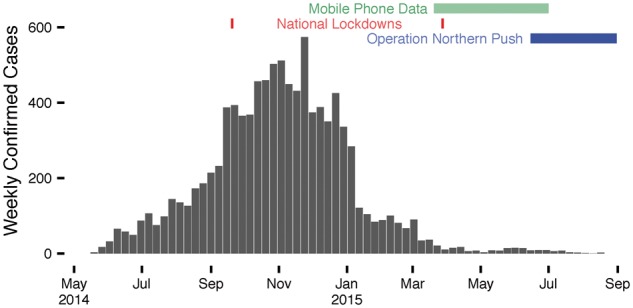
Temporality of Ebola virus disease, interventions, and available mobile phone data. The timespan of available mobile phone data (green) includes: the late stage of the national epidemic curve (bars); Operation Northern Push (blue); and one of the two national lockdowns (red).
During this 103-day window with mobile phone data, several travel restriction policies were implemented in an effort to eliminate Ebola from Sierra Leone. We compiled a list of travel restrictions deployed between May 2014 and September 2015, by searching academic literature, news media outlets, reliefweb [http://www.reliefweb.int/disaster/ep-2014–000041-gin], World Health Organization (WHO) situation reports [http://www.who.int/csr/disease/ebola/en] and National Ebola Response Centre (NERC) reports [www.nerc.sl]. The principal travel restrictions studied here are the 2015 national ‘stay at home’ lockdown and Operation Northern Push.
The 2015 national lockdown began at 06:00 on 27 March and ended at 18:00 on 29 March, with minimal breaks such as for Friday prayers and Palm Sunday church service. Essential workers were exempted, including health workers, fuel station workers and staff involved in the Zero Ebola Campaign.21 All other individuals were asked to stay at home, even those living in districts with no recent transmission.22
Operation Northern Push began on 16 June 2015 with a 21-day surge of interventions targeted at the two northern districts of Port Loko and Kambia, where the recent Ebola burden remained high.23 During Phase 1, for which we have some CDR coverage, curfews were instituted from 18:00 to 6:00 each night.
To assess effect modification by cumulative Ebola burden, we collected daily suspected, confirmed and total cases by chiefdom, compiled and made publicly available by Fang et al.24 For reference on districts and the chiefdom boundaries contained within, see Supplementary Figure 2, available as Supplementary data at IJE online.
Data preparation
In order to protect the privacy of subscribers, we defined the daily location of each unique subscriber as the chiefdom containing the towers that managed the majority of calls by that subscriber on that day. For time series analysis, we aggregated the number of anonymous subscribers relocating from chiefdom i on day t to chiefdom j on day t + 1 as the number of trips, Y(i,j),t. Thus, each directional chiefdom pair has a number of trips on each day from 20 March to 30 June 2015. A time-series of the data in Freetown, the capital city, and Magbema, the largest chiefdom in the northern district of Kambia, is shown as an example visualizing the data structure and travel restriction impacts for one chiefdom-pair including a northern chiefdom targeted by Operation Northern Push (Figure 2A). We adapted the time series panel data structure for the programming language R developed by Christopher Adolph.25 For each directional chiefdom pair (e.g. Supplementary Figure 4, available as Supplementary data at IJE online), we used the lagpanel function of the simcf package in R to generate lagged and differenced time series necessary to assess stationarity.26
Figure 2.
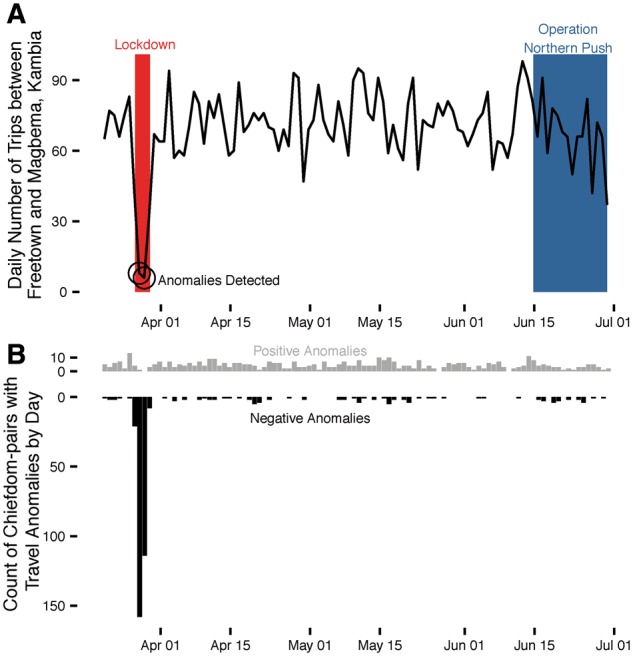
Travel anomalies during the elimination phase of Ebola in Sierra Leone. (A) The daily number of trips between Freetown and Magbema, the largest chiefdom in the northern district of Kambia, reveal significant negative anomalies during the 2015 national lockdown (light grey) and suggest a downward trend during Operation Northern Push (darker grey). (B) The daily number of positive (grey) and negative (black) travel anomalies detected between all chiefdom pairs with an average of at least 10 trips per day.
To prepare the data for crossover analysis, in which we assess whether travel behaviour was abnormal during the lockdown, we selected time periods to represent the intervention weekend (06:00 on 27 March to 18:00 on 29 March), a control period the preceding weekend (06:00 on 20 March to 18:00 on 22 March) and a control period the following weekend (06:00 on 3 April to 18:00 on 5 April). We recorded the sequence of towers visited by each subscriber in each of the three time periods, rather than a summary daily location for each user, as needed for the time series analysis data preparation. Therefore, only a small sample of the CDR data were considered for the crossover analysis—specifically the 3-day intervention period and a comparator period of the weekend before and/or the weekend after.
Data analysis
To observe anomalies in travel behaviour without pre-specified interventions, we use an agnostic anomaly detection algorithm for time series data [https://github.com/twitter/AnomalyDetection]. The method uses a generalized extreme studentized deviate many-outlier procedure27 to detect positive and negative deviants of statistically significant magnitude in the presence of periodic (in this application, weekly) and long-term trends. We applied this algorithm to the count of daily trips between each chiefdom pair in each direction. As compared with the expected trip count between given locations on a given day, we recorded each time that the observed trip count was above or below the critical anomaly threshold determined using an α-level of 0.05.
To measure the effect size of travel restrictions, we performed what is commonly referred to as ‘intervention analysis’.28 Following the framework of Cryer and Chan29, the time series Y(i,j),t of trips from chiefdom i to chiefdom j on day t is given by:
where is modelled as some autoregressive integrated moving-average (ARIMA) process for chiefdom pair (i, j) if there were no intervention; is the change in the log-transformed expected number of trips for pair (i, j) on day t by an exogenous intervention; and is a random intercept for each directional chiefdom pair to account for different degrees of average traffic between two chiefdoms, and is drawn from a normal distribution with mean zero. We used the auto.arima function in the forecast package in R (Hyndman and Khandakar30) to identify the best-fitting parameters for the periodicity of the time series, and the linear mixed effects lme function in the nlme package in R (Pinheeiro et al.31) to fit the time series model in the presence of the ARIMA process as well as intervention main effects and effect modification with cumulative Ebola burden in each chiefdom (Table 1) (see Supplementary data for more details, available at IJE online).
In our crossover analysis, we tested for differences in stationarity and distance travelled matched by subscriber. Subscribers were labelled ‘stationary’ during a time period if all towers used by that subscriber were within a 10 km radius of the first tower. This distance was reduced to 0 km and 3 km for sensitivity analysis in addition to adjustment for differences in call volume (see Supplementary data, available at IJE online). The primary metric used to measure distance travelled by non-stationary individuals is the sum of inter-tower distances. The distance between tower geolocations was calculated in kilometers using ArcGIS with the World Geographic Survey 1984 projection. Secondarily, we measured distance as the convex hull area using the sp package in R, whereby we functionally measure the area of a polygon that encloses the locations of all towers used by that individual (imagine a rubber band stretched around all towers used).32,33 We used McNemar’s test for changes in stationarity and the paired t-test of means for changes in distance travelled.
Results
Travel restrictions during the Ebola elimination phase in Sierra Leone had a substantial impact on travel patterns in the country. We detected anomalously low travel volume during the 2015 national lockdown using a simple, non-parametric method capable of real-time monitoring of travel restrictions and population displacement (Figure 2). Interestingly, few anomalies were detected during Phase 1 of Operation Northern Push, which began towards the end of the available CDR data. We focus our attention on the national lockdown for the following time-series and crossover analyses.
Using time-series intervention analysis, we record substantial decreases in travel during the lockdown, especially for long distance trips. The number of individuals relocating between chiefdoms decreased by 31% within 15 km, by 46% for 15–30 km and by 76% for distances greater than 30 km (Table 1; Supplementary Figure 3, available as Supplementary data at IJE online). Importantly, we measured no increase in travel during the days immediately following the lockdown, which suggests that individuals did not compensate for the lockdown by increasing travel later. The impact of the national lockdown was up to two times larger in populations that experienced higher Ebola burdens (Figure 3). Adding an interaction term between cumulative Ebola case reports and number of relocations, we measured a 28.7% boost in intervention effect size for each additional Ebola case reported in either chiefdom (per 1000 population).
Table 1.
Results of a mixed effects ARIMA(p = 1, q = 0, d = 2) model estimating the log-transformed trip count between chiefdom pairs
| Parameter | Effect size |
||
|---|---|---|---|
| Name | Definition | Value | P-value |
| National lockdown Distance (0-15 km) | 0.311 | <0.0001 | |
| National lockdown Distance (15-30 km) | 0.458 | <0.0001 | |
| National lockdown Distance (>30 km) | 0.761 | <0.0001 | |
| Cumulative Ebola incidence | 0.083 | 0.0181 | |
| Operation Northern Push (destination chiefdom) | 0.061 | 0.0043 | |
| Operation Northern Push (origin chiefdom) | 0.045 | 0.0447 | |
Model coefficient values are shown before exponentiation.
AIC = 39 386.11.
Figure 3.

District heterogeneity in lockdown impact. Reduction in travel by users from each district during the national lockdown ranges from over 70% (dark red) to nearly 30% (light red). Each dot represents 10 cumulative Ebola cases reported in each district between May 2014 and 26 March 2015, before the lockdown. Districts with larger Ebola case counts (italicized numbers adjoining to districts) tended to have larger changes in mobility during the lockdown. Dashed border outlines Magbema chiefdom, discussed in Figure 2a. Thick grey borders outline the districts targeted during Operation Northern Push.
A subscriber was substantially less likely to have travelled during the national lockdown as compared with control periods on the weekend before or after, (McNemar odds ratio 0.212 and 0.213, respectively; P < 0.0001) (Table 2). The average inter-tower distance of 3.3 km travelled during the lockdown was a significant decrease compared with the control periods before and after the lockdown, respectively 12.5 km and 12.7 km (paired t-tests P <0.0001) (Supplementary Table 1 and Supplementary Figure 3, available as Supplementary data at IJE online). This difference increases by up to 5-fold if we restrict our analysis to individuals who were mobile during one or both periods, or consider the convex-hull distance metric (Supplementary Table 2, available as Supplementary data at IJE online). Mobile phone data are commonly difficult to acquire for analysis, due to a variety of current challenges. The crossover analysis importantly can be performed in near real-time with only 1 week of pre- or post-intervention data.
Table 2.
The number of subscribers stationary or mobile in each period
| Intervention period |
|||||
|---|---|---|---|---|---|
| Stationary users | Mobile users | ||||
| Control (pre-) | Stationary users | 360 506 | 12 750 |
Control (pre-) |
|
| Mobile users | 60 229 | 14 233 | Stationary users | Mobile users | |
| Control (post-) | Stationary users | 305 871 | 11 060 | 346 449 | 42 703 |
| Mobile users | 51 875 | 12 607 | 45 426 | 31 712 | |
‘Intervention period’ is 27–29 March’ ‘Control (pre-)’ is 20–22 March’ ‘Control (post-)’ is 3–5 April.
Bolded values are used for McNemar’s test.
In addition to the national lockdown, another key intervention for Ebola elimination was Operational Northern Push, during which two northern districts of Sierra Leone with relatively high recent incidence were targeted with a range of interventions, including a 12-h curfew beginning at 18:00 each night.23 Using the same time-series model as before, we detect a decrease in travel into targeted chiefdoms (6.1%, 95% confidence interval: 1.9%–10%) and out of targeted chiefdoms (4.5%, 95% confidence interval: 0.1%–8.6%) (Table 1). Although the magnitude of these results are indistinguishable in this sample, this approach can distinguish the potentially asymmetrical nature of travel restrictions into and out of a targeted region.
Discussion
Through retrospective study of mobile phone CDR data towards the end of the Ebola epidemic in Sierra Leone, we documented a large, targetable, reversible mobility impact of a national lockdown, using methods that could be implemented in near real-time to guide an outbreak response. At a minimum cost, routinely collected CDRs can uniquely enable monitoring and evaluation of this poorly documented class of interventions within national boundaries. Analysis of these data using both time series and crossover methods, we present decreases in mobility of large magnitude during travel restrictions in Sierra Leone. Travel reductions were particularly large in areas with high recent burden of Ebola and for travel over longer distances. During the lockdown, trips longer than 30 km decreased by a remarkable 76%. Future qualitative or mixed-methods approaches may reveal what fraction of this decrease is due to travel eliminated altogether, and what fraction is to due a reduction in travel distance, which may partially account for the smaller impacts observed for the number of shorter trips. Whereas 6.8% of users still recorded travel of at least 10 km during the national lockdown [as compared with approximately 17% during the control periods (Supplementary Table 7, available as Supplementary data at IJE online)], compliance with the voluntary travel restriction resulted in decreases in distance travelled and did not result in a subsequent increase in travel after the travel restriction was lifted.
With the capacity to measure the impact of travel restrictions on human mobility, there is now an opportunity to re-evaluate travel restrictions with respect to the possible benefits (e.g. on disease transmission, spread and eradication) and harms (e.g. to human rights and commerce34). Estimating these second-level consequences of travel restrictions requires additional assumptions and data that are outside the scope of this paper, such as the role of density-dependent transmission in settings where restrictions may increase or decrease close congregation, the role of long distance travel on spatial epidemic expansion,18 isolating the changes in travel for burials attributable to restrictions (which may account for highly local super-spreading events)35 and the infection and susceptibility status of observed travellers. In each of these important examples, a reliable and timely estimate of the impact of travel restrictions on mobility, as shown here, can serve as a foundation for further, sector-specific research.
Whereas the lockdown in Sierra Leone was national in scope, the mobility impact was highly heterogenous throughout the country. The observed effect modification could be due to differences such as intervention compliance, advertising or enforcement. Amid concerns of unintended side effects of travel restrictions,19,20 our results instead suggest that the effects of travel restrictions may be larger in affected regions and may thereby spare low-burden regions from excessive collateral costs.
The spatial resolution of CDR data is limited by the density of cell towers, which is sparse in some regions of Sierra Leone but closely matches population densities (Supplementary Figure 1, available as Supplementary data at IJE online). Although socioeconomic status may be related to phone use14 and disease burden,36 we have not seen evidence indicating differences in travel behaviour to an extent that would change the overall results of this study. These analyses were robust to sensitivity analyses including alternative definitions of ‘trips’, minimum detectable travel distance and after excluding travel from the capital and largest city, Freetown (see Supplementary data, available at IJE online). Our results remain qualitatively unchanged after down-sampling the control period call activity by the observed 22–26% decrease in call activity as compared with the lockdown; indeed, call activity during the control periods needed to be down-sampled by over 80% in order to eliminate the significance of the observed effect (see Supplementary data, available at IJE online).
CDRs are routinely collected and provide an ideal source of near real-time data on human mobility during an emergency. However, strong regulatory guidelines that protect individual privacy must be considered. The ethics and logistics of how mobile phone operators should provide access to these data, and to whom, are vital conversations for the international community to engage in before we face new pandemics, such as unprecedented and hyper-local travel advisories in response to the zika virus.37
In addition to sensitivity analyses within each method, we present results from two analysis methods, to address some limitations of each. Data preparation for the time-series analysis reduces call activity to a primary chiefdom for a user on each day. Underestimation of travel activity for a given user can result from lower call activity or coverage during trips to that chiefdom. This limitation is offset by the data preparation for crossover analysis, which accounts for each tower visited by each user during a day and estimates, using the tower locations and order of use, the distance travelled by that user. However, the crossover analysis reduces the dataset to the intervention period (27–29 March) and two control periods (20–22 March and 3–5 April), whereas the time-series analysis leverages fluctuations in the complete dataset to estimate differences in travel during the interventions. Additional CDR data before the lockdowns, if available, could have been used to establish a more stable pre-intervention baseline. Comparisons between the pre-intervention and post-intervention control periods revealed limited differences in metrics related to distance travelled and proportion stationary, although of sufficient sample size to be statistically significant (Supplementary Tables 1, 2, 6–9, available as Supplementary data at IJE online).
In order to leverage mobile phone data sources for monitoring and evaluating mobility interventions in near real-time during unpredictable emergencies such as natural or biological disasters, governments must design policies to facilitate rapid and safe data use strategies. With the modern data streams and methodologies available today, the impact of travel restrictions on mobility, and subsequently health, can now be measured and used for data-driven decisionmaking.
Funding
This work was supported by the National Institute of General Medical Sciences [U54GM088558]; National Research Service Award [T32AI007535–16A]; Wellcome Trust Sustaining Health Grant [106866/Z/15/Z]; and the Swedish Research Council [D0313701]. A.W. holds a Career Award at the Scientific Interface from the Burroughs Wellcome Fund. X.L. was partially supported by the Natural Science Foundation of China [71522014]. The content is solely the responsibility of the authors and does not necessarily represent the official views of the National Institute of General Medical Sciences nor of the National Institutes of Health. The funders of the study had no role in study design, data collection, data analysis, data interpretation or writing of the report.
Supplementary Material
Acknowledgements
The authors appreciatively acknowledge the editorial and peer-review contributions towards a refined manuscript.
Author Contributions
C.M.P., C.O.B. and L.B. wrote the main manuscript text and all authors provided edits. C.M.P., C.O.B. and L.B. designed the analysis. C.M.P., A.W., E.E.S., C.O.B. and L.B. developed the methodology. C.M.P. performed the analyses. A.T., E.W., X.L. and D.P. provided additional input, together with E.W.G., S.R. and S M. who also provided data quality assurance and participated in data collection. C.O.B. and L.B. had full access to the data in the study and had final responsibility for the decision to submit for publication.
Conflict of interest: None declared.
References
- 1. Porter D. Health, Civilization, and the State: A History of Public Health From Ancient to Modern Times. London: Routledge, 1999. [DOI] [PMC free article] [PubMed] [Google Scholar]
- 2. Tognotti E. Lessons from the history of quarantine, from plague to influenza A. Emerging Infect Dis 2013;19:254–59. [DOI] [PMC free article] [PubMed] [Google Scholar]
- 3. Bajardi P, Poletto C, Ramasco JJ, Tizzoni M, Colizza V, Vespignani A.. Human mobility networks, travel restrictions, and the global spread of 2009 H1N1 pandemic. PLoS One 2011;6:e16591. [DOI] [PMC free article] [PubMed] [Google Scholar]
- 4. Mitchell T, Dee DL, Phares CR. et al. Non-pharmaceutical interventions during an outbreak of 2009 pandemic influenza A (H1N1) virus infection at a large public university, April-May 2009. Clin Infect Dis 2011;52:S138–45. [DOI] [PubMed] [Google Scholar]
- 5. SteelFisher GK, Blendon RJ, Ward JRM, Rapoport R, Kahn EB, Kohl KS.. Public response to the 2009 influenza A H1N1 pandemic: a polling study in five countries. Lancet Infect Dis 2012;12:845–50. [DOI] [PubMed] [Google Scholar]
- 6. Brownstein JS, Wolfe CJ, Mandl KD.. Empirical evidence for the effect of airline travel on inter-regional influenza spread in the United States. PLoS Med 2006;3:e401–35. [DOI] [PMC free article] [PubMed] [Google Scholar]
- 7. Viboud C, Miller MA, Grenfell BT, Bjørnstad ON, Simonsen L.. Air travel and the spread of influenza: important caveats. PLoS Med 2006;3:e503–55. [DOI] [PMC free article] [PubMed] [Google Scholar]
- 8. Balcan D, Colizza V, Gonçalves B, Hu H, Ramasco JJ, Vespignani A.. Multiscale mobility networks and the spatial spreading of infectious diseases. Proc Natl Acad Sci USA 2009;106:21484–89. [DOI] [PMC free article] [PubMed] [Google Scholar]
- 9. Poletto C, Gomes MF, Pastore y Piontti A. et al. Assessing the impact of travel restrictions on international spread of the 2014 West African ebola epidemic. Eurosurveillance 2014;19:1–6. [DOI] [PMC free article] [PubMed] [Google Scholar]
- 10. Halloran ME, Bharti N, Leora R. et al. Ebola: mobility data. Science 2014;346:433. [DOI] [PMC free article] [PubMed] [Google Scholar]
- 11. Bengtsson L, Lu X, Thorson A, Garfield R, von Schreeb J.. Improved response to disasters and outbreaks by tracking population movements with mobile phone network data: a post-earthquake geospatial study in Haiti. PLoS Med 2011;8:e1001083. [DOI] [PMC free article] [PubMed] [Google Scholar]
- 12. Lu X, Bengtsson L, Holme P.. Predictability of population displacement after the 2010 Haiti earthquake. Proc Natl Acad Sci USA 2012;109:11576–81. [DOI] [PMC free article] [PubMed] [Google Scholar]
- 13. Finger F, Genolet T, Mari L. et al. Mobile phone data highlights the role of mass gatherings in the spreading of cholera outbreaks. Proc Natl Acad Sci USA 2016;113:6421. [DOI] [PMC free article] [PubMed] [Google Scholar]
- 14. Wesolowski A, Eagle N, Noor AM, Snow RW, Buckee CO.. The impact of biases in mobile phone ownership on estimates of human mobility. J R Soc Interface 2013;10; doi:10.1098/rsif.2012.0986. [DOI] [PMC free article] [PubMed] [Google Scholar]
- 15. Wesolowski A, Buckee CO, Bengtsson L, Wetter E, Lu X, Tatem AJ.. Commentary : containing the ebola outbreak—the potential and challenge of mobile network data. PLoS Curr Outbreaks 2014; Sep 29. Edition 1. [DOI] [PMC free article] [PubMed] [Google Scholar]
- 16. Chan M. Ebola virus disease in West Africa—no early end to the outbreak. N Engl J Med 2014;371:1183–85. [DOI] [PubMed] [Google Scholar]
- 17. Bausch DG, Schwarz L, Muyembe-Tamfum J, McCormick J, Heymann D.. Outbreak of ebola virus disease in Guinea: where ecology meets economy. PLoS Negl Trop Dis 2014;8:e3056. [DOI] [PMC free article] [PubMed] [Google Scholar]
- 18. Dudas G, Carvalho LM, Bedford T. et al. Virus genomes reveal factors that spread and sustained the ebola epidemic. Nature 2017;544:309–15. [DOI] [PMC free article] [PubMed] [Google Scholar]
- 19. Médecins Sans Frontières (MSF). Ebola: Quarantine Can Undermine Efforts to Curb Epidemic. New York/Geneva: MSF, 2014. [Google Scholar]
- 20. Drazen JM, Kanapathipillai R, Campion EW. et al. Ebola and quarantine. N Engl J Med 2014;371:2029–30. [DOI] [PubMed] [Google Scholar]
- 21. National Ebola Reponse Centre (NERC). Zero Ebola Campaign 3 Days Stay At Home—Operational Overview. Freetown: NERC, 2015. [Google Scholar]
- 22. National Ebola Reponse Centre (NERC). FAQs—National Zero Ebola Campaign. Freetown: NERC, 2015. [Google Scholar]
- 23. National Ebola Response Centre (NERC). Surge Operation Order. Freetown: NERC, 2015. [Google Scholar]
- 24. Fang L-Q, Yang Y, Jiang J-F. et al. Transmission dynamics of ebola virus disease and intervention effectiveness in Sierra Leone. Proc Natl Acad Sci U S A 2016;113:4488–93. [DOI] [PMC free article] [PubMed] [Google Scholar]
- 25. Adolph C. Mixed effects panel ar(i)ma models: model selection, fitting, and interpretation. Seattle, WA; University of Washington, Department of Political Science, 2015. http://faculty.washington.edu/cadolph/panEssex/panelARIMAtemplate.r.
- 26. Adolph C. simcf: counterfactuals and confidence intervals for estimated models. University of Washington, 2013. http://faculty.washington.edu/cadolph/? page=60 (29 September 2016, date last accessed).
- 27. Rosner B. Percentage points for a generalized ESD many-outlier procedure. Technometrics 1983;25:165–72. [Google Scholar]
- 28. Box GEP, Tiao GC.. Intervention analysis with applications to economic and environmental problems. J Am Stat Assoc 1975;70:70–79. [Google Scholar]
- 29. Cryer JD, Chan K-S.. Time Series Analysis. New York, NY: Springer, 2008. [Google Scholar]
- 30. Hyndman RJ, Khandakar Y.. Automatic time series forecasting: the forecast package for R. J Stat Soft 2008;27:1–22. [Google Scholar]
- 31. Pinheiro J, Bates D, DebRoy S, Sarkar D.. R Core Team. nlme: Linear and Nonlinear Mixed Effects Models 2016. http://cran.r-project.org/package=nlme (12 April 2018, date last accessed).
- 32. Pebesma E, Bivand R. Classes and methods for spatial data in R. R News, 2005http://cran.r-project.org/doc/Rnews/ (12 April 2018, date last accessed).
- 33. Bivand RS, Pabesma E, Gomez-Rubio V.. Applied Spatial Data Analysis with R. 2nd edn New York, NY: Springer, 2013. [Google Scholar]
- 34. Asia-Pacific Economic Coorporation. The impact of SARS on the Singapore economy and action taken in response. Asia Pac Biotech News 2004;8:672–79. [Google Scholar]
- 35. Lau MSY, Dalziel BD, Funk S. et al. Spatial and temporal dynamics of superspreading events in the 2014–2015 West Africa ebola epidemic. Proc Natl Acad Sci USA 2017;114:2337–42. [DOI] [PMC free article] [PubMed] [Google Scholar]
- 36. Fallah MP, Skrip LA, Gertler S, Yamin D, Galvani AP.. Quantifying poverty as a driver of ebola transmission. PLoS Negl Trop Dis 2015;9:e0004260. [DOI] [PMC free article] [PubMed] [Google Scholar]
- 37. LaMotte S. CDC Issues Historic Travel Warning Over Miami Zika Outbreak CNN, 2016. http://www.cnn.com/2016/08/01/health/cdc-miami-florida-zika-travel-warning/ (12 April 2018, date last accessed).
Associated Data
This section collects any data citations, data availability statements, or supplementary materials included in this article.