Abstract
Context:
Exposure to severe heat can have detrimental effects on athletic performance and increase the risk of exertional heat injuries. Therefore, proactive assessment of the environmental characteristics of international football match venues becomes critical in ensuring the safety and optimal performance of the athletes.
Objective:
To propose the use of climatologic data (modeled wet-bulb globe temperature [WBGT]) in making athletic-event management decisions for the 2020 Summer Olympic Games and the 2022 Fédération Internationale de Football Association World Cup.
Design:
Descriptive study.
Setting:
Hourly meteorologic input data for a WBGT model were obtained from the second Modern-Era Retrospective Analysis for Research and Applications for Japan (Yokohama and Saitama) and Qatar (Doha and Al-Daayen).
Main Outcome Measure(s):
The pattern of hourly WBGT and percentage of hours between 30°C and 32°C and exceeding 32°C WBGT during the expected competition periods for the 2020 Summer Olympic Games in Japan and the scheduled (November, December) and traditional (June, July) periods of the World Cup games in Qatar.
Results:
The WBGT during the 2020 Olympic football tournament in Japan may exceed 30°C in 40% to 50% of the late mornings and early afternoons. The shift in tournament timing for the 2022 Fédération Internationale de Football Association World Cup in Qatar from the summer to late fall will reduce the exposure to ≥30°C WBGT to null.
Conclusions:
Directors of mass sporting events should consider using climatologic data in their organizational decision making to assess the potential heat illness risk and to implement risk-mitigation plans.
Key Words: wet bulb globe temperature, safety policies, soccer
Key Points
The second Modern Era Retrospective Analysis for Research and Applications data can be used to model wet-bulb globe temperature and to assess climate conditions anywhere in the world.
Wet-bulb globe temperature may exceed 30°C in 40% to 50% of the late mornings and early afternoons during the 2020 Olympic football tournament in Japan.
According to the modeled wet-bulb globe temperature, the shift in tournament timing from the summer to late fall for the 2022 Fédération Internationale de Football Association World Cup in Qatar will reduce the exposure to extreme heat.
Climatologic risk assessment should be included in the criteria for selecting athletic venues in order to make informed decisions and avoid potential exposure to extreme heat.
Exposure to extreme heat can have detrimental effects on athletic performance and may lead to serious exertional heat-related injuries. For instance, sprint performance and total distance covered during match play at the 2014 World Cup were negatively affected when the air temperature exceeded 22°C and relative humidity exceeded 60% or when the air temperature exceeded 28°C despite lower relative humidity, indicating that the players' physical capacity was compromised.1 In 2014, the Fédération Internationale de Football Association (FIFA) revised their hydration-break guidelines to grant additional breaks (eg, after the 30th minute of the first and second halves of the games) when wet-bulb globe temperature (WBGT) exceeds 32°C. Indeed, in the same year, the US and Portuguese men's national football teams experienced the first official hydration break during the first stage of the men's World Cup in Brazil. Such hydration breaks may help attenuate the physiological strain experienced during strenuous exercise in the heat.2–4
The WBGT is an index that integrates the influences of multiple meteorologic variables that can affect heat stress and is used to determine the need for activity modification in the heat for athletes, the military, and other workers.5–8 The American College of Sports Medicine2 suggested that intense exercise be limited when the WBGT exceeds 30°C and that the risk of foreseeable uncompensable heat stress exists when the WBGT exceeds 32.3°C, even among those who are heat acclimatized and physically fit. Although no exertional heat-stroke fatalities have been documented among elite football players during competition to date, exertional heat illness is one of the common injuries reported among youth and collegiate football players, especially during the summer and preseason months when the environmental conditions are warmer.9,10 Furthermore, thermoregulatory strain is exacerbated on the succeeding day of heat exposure.11 Therefore, proactive assessment of the environmental characteristics of football match venues becomes critical in ensuring the safety of the athletes and also for appropriate management of the events.
We examined Japan and Qatar, 2 countries with hot summer climates that are scheduled to host upcoming high-profile international football matches: Japan is the host for the 2020 Summer Olympic Games, and Qatar is the host for the 2022 FIFA World Cup. The high prevalence of extreme heat during the summer months in these countries warrants extra heat-safety precautions during the tournament, such as scheduling matches to avoid the hottest times of the day. For example, Qatar has already announced a shift in the tournament months to November and December from the traditional June and July. However, the degree to which the shift in tournament months will reduce the heat-related risk for exertional heat illnesses is unknown.
Therefore, the aim of our study was to examine the WBGT at venues that will host international football matches in Japan (Yokohama and Saitama) and Qatar (Doha and Al-Daayen) and to demonstrate the importance of considering the local climate in event planning. We hypothesized that venues in Japan would reach the WBGT threshold for limiting intense exercise (WBGT ≥30°C) and adding a hydration break during the scheduled period of competition. Secondarily, we examined the difference in climatologic conditions in Qatar between the scheduled (November, December) and traditional (June, July) periods of the World Cup games. We hypothesized that the shift in the tournament schedule would reduce the expected exposure to WBGTs >32°C.
METHODS
We developed 36-year (1980–2016) modeled climatologic WBGT datasets for the vicinities of the Japanese and Qatari venues for the upcoming Summer Olympics and FIFA World Cup tournaments, respectively. Wet-bulb globe temperature data are not routinely collected in many parts of the world, making it impractical to build a WBGT climatology from observations. We used hourly meteorologic data from the second Modern-Era Retrospective Analysis for Research and Applications (MERRA-2)12 as input into a WBGT model to build our WBGT climatology. The MERRA-2 is a National Aeronautics and Space Administration–developed atmospheric reanalysis dataset that provides global data at a 0.625° × 0.5° longitude-by-latitude resolution. In the next sections, we discuss both the WBGT model and the input meteorologic dataset.
The WBGT model was developed by Liljegren et al13 and is a sophisticated mathematical model that incorporates meteorologic data on air temperature, relative humidity, solar radiation, and wind speed to calculate the wet-bulb and globe temperatures. The wet-bulb and globe temperatures (WB and GT, respectively) are combined with the measured dry-bulb temperature (DB) to compute the WBGT as a weighted average14:
The Liljegren model13 meets the best standards for WBGT models as discussed by Lemke and Kjellstrom15 in that it uses well-established meteorologic variables as inputs (eg, air temperature, relative humidity, solar radiation, wind speed), employs thermodynamic principles of heat exchange in the computations, has model formulae capable of handling a wide range of meteorologic conditions, and has been well tested. Indeed, Liljegren et al13 found the model to be accurate to within 1°C at a variety of study sites with different climates. Further, both Patel et al16 and Lemke and Kjellstrom15 deemed the Liljegren model superior to other WBGT models for outdoor use.
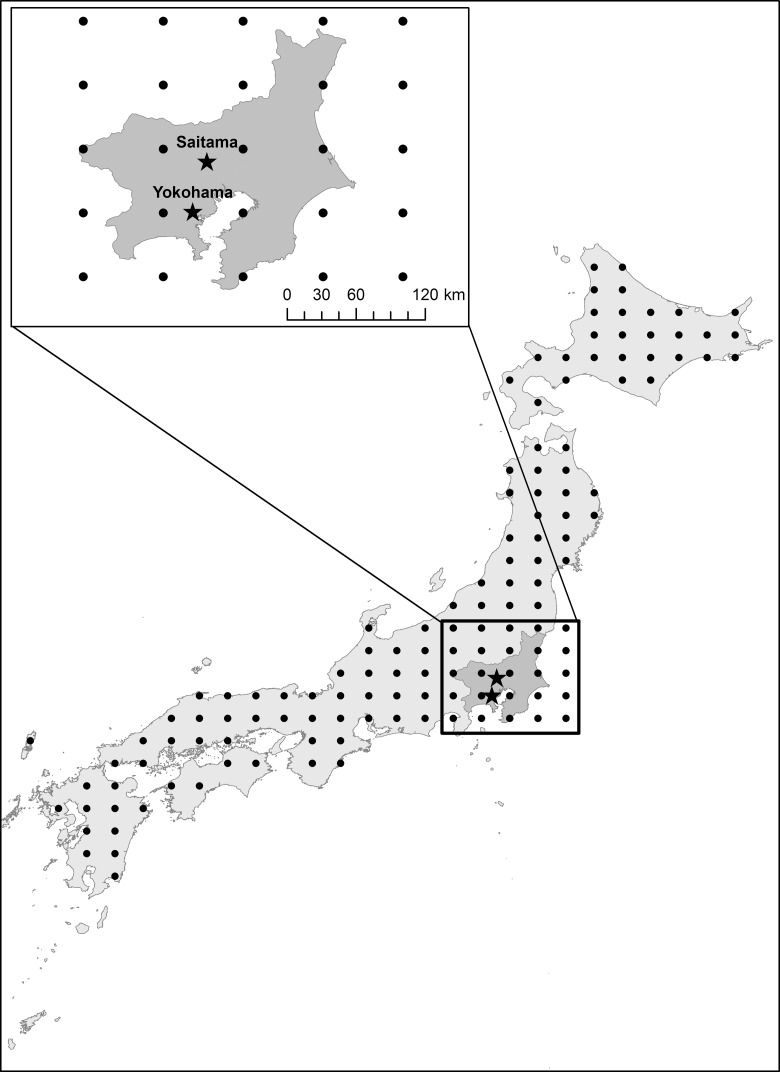
The meteorologic data required by the WBGT model, particularly solar radiation, are rarely measured at weather stations. Thus, hourly meteorologic data were obtained from MERRA-2 (Figure 1).17 Reanalysis datasets are widely used in climate research and blend observations that are irregular in time and space with computer model output to create a gridded dataset that is spatially and temporally complete.18 We selected the MERRA-2 dataset because of its high spatial resolution when compared with other reanalysis datasets.19 Also, our procedure for computing WBGT using MERRA-2 may be applied to climate conditions anywhere in the world.
Figure 1.
Example of the second Modern-Era Retrospective Analysis for Research and Applications grids for the international football venues in Yokohama and Saitama, Japan.
The size of the MERRA-2 grids allows computation of WBGT in Yokohama and Saitma, Japan. In Qatar, tournament play is scheduled for Doha and Al-Daayen, which are close in distance (<40 km apart) and covered by a single MERRA-2 grid. Thus, a single set of WBGTs was computed for each location.
The pattern of hourly WBGTs and percentage of hours between 30°C and 32°C and exceeding 32°C during the period of upcoming competitions in Japan (Olympic football tournament; July 24–August 9, 2020; [1] International Stadium Yokohama, Yokohama; [2] Saitama Stadium, Saitama), and Qatar (FIFA World Cup; November 21–December 18, 2022; [1] Doha Port Stadium, Doha; [2] Lusail Iconic Stadium, Al-Daayen) were examined. For regions around each venue, we developed 36-year climatologic models for the period of time when competitions are scheduled. For Qatar, we also computed climatologic conditions for June, when World Cup matches are typically held.
Descriptive statistics are reported using means and standard deviations. Percentages of hours in the 30°C to 32°C range and exceeding 32°C in WBGT were calculated using the data from 36-year climatologic models at each venue.
RESULTS
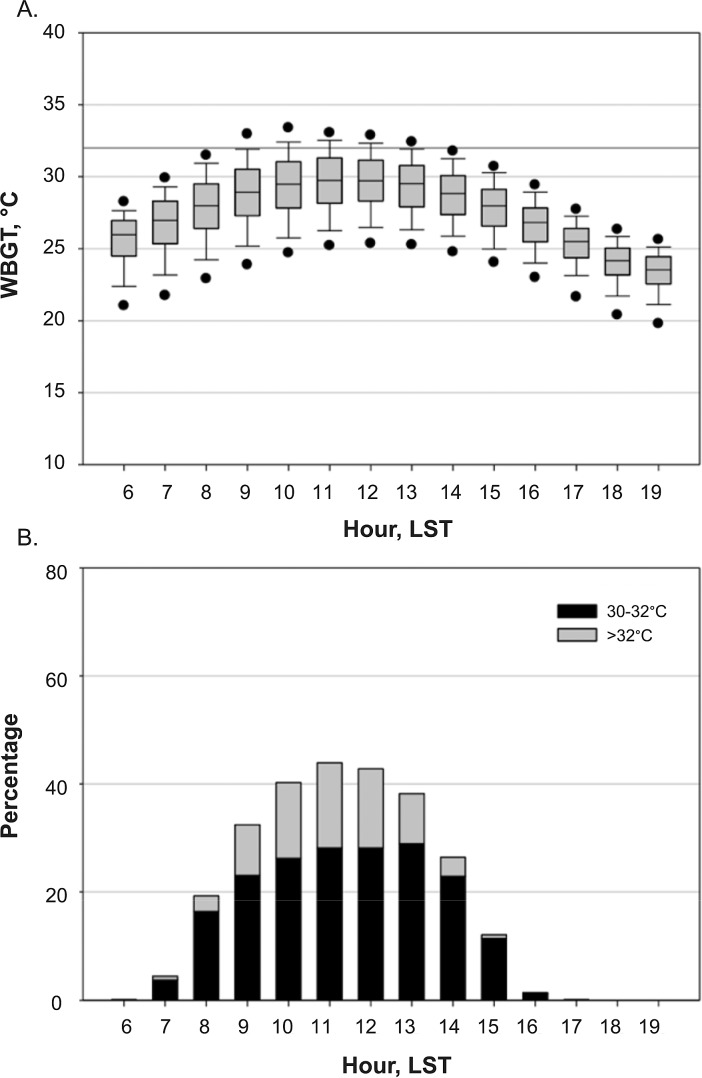
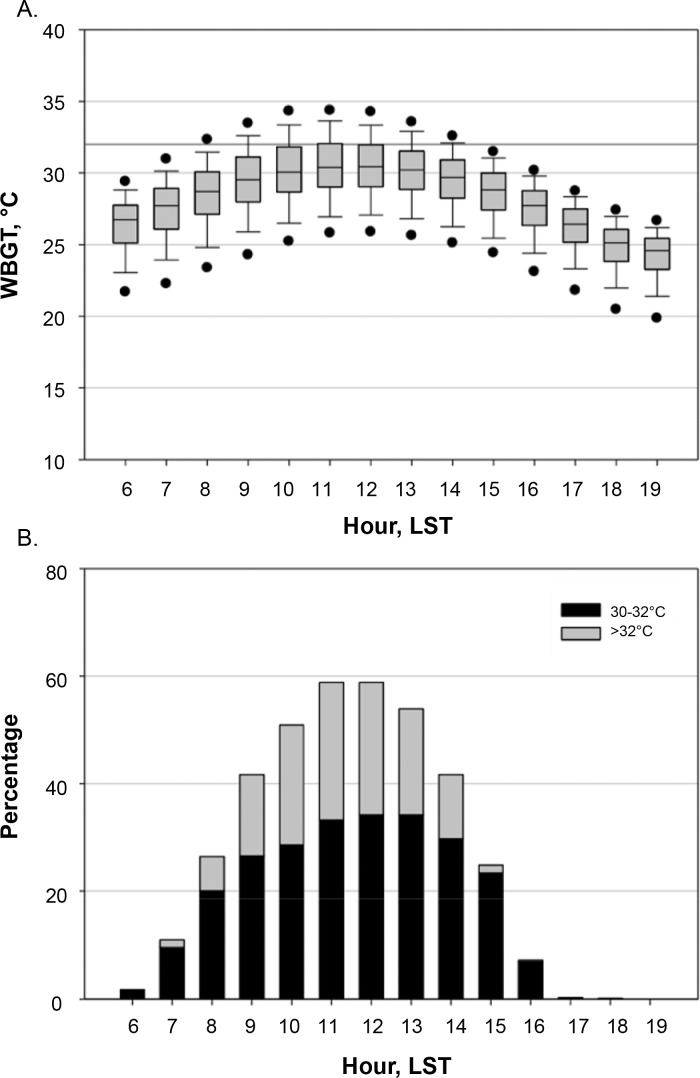
The competitions in Yokohama and Saitama are expected to occur from July 24 through August 9, 2020. In Yokohama, late morning through early afternoon (10:00 am to 1:00 pm Local Standard Time [LST]) provides the greatest heat-related hazard, with median WBGTs of approximately 29°C. During these hours, conditions can exceed 32°C WBGT 14% to 15% of the time and may exceed 30°C WBGT ≥40% of the time (Figure 2). Saitama, which is located approximately 50 km north and inland of Yokohama, follows a similar pattern to Yokohama but has greater median WBGTs that reach 30°C WBGT during the hottest times of the day from late morning to early afternoon (Figure 3). Further, during the later morning to early afternoon, 32°C WBGT may be exceeded near or more than 20% of the time, and 30°C WBGT may be exceeded more than 50% of the time.
Figure 2.
(A) Box plots of hourly wet-bulb globe temperatures (WBGTs) from 1980–2016 and (B) percentage of hours at 30°C–32°C and >32°C WBGT at Yokohama, Japan, during the scheduled period of international football tournaments (July 24–August 9). The boundaries of the box represent the 25th and 75th percentiles. The line within the box indicates the median, the whiskers are the 10th and 90th percentiles, and the points above and below the whiskers are the 5th and 95th percentiles, respectively. The horizontal line marks 32°C WBGT. Abbreviation: LST, Local Standard Time.
Figure 3.
(A) Box plots of hourly wet-bulb globe temperatures (WBGTs) from 1980–2016 and (B) percentage of hours at 30°C–32°C and >32°C WBGT in Saitama, Japan, during the scheduled period of international football tournaments (July 24–August 9). The boundaries of the box represents the 25th and 75th percentiles. The line within the box indicates the median, the whiskers are the 10th and 90th percentiles, and the points above and below the whiskers are the 5th and 95th percentiles, respectively. The horizontal line marks 32°C WBGT. Abbreviation: LST, Local Standard Time.
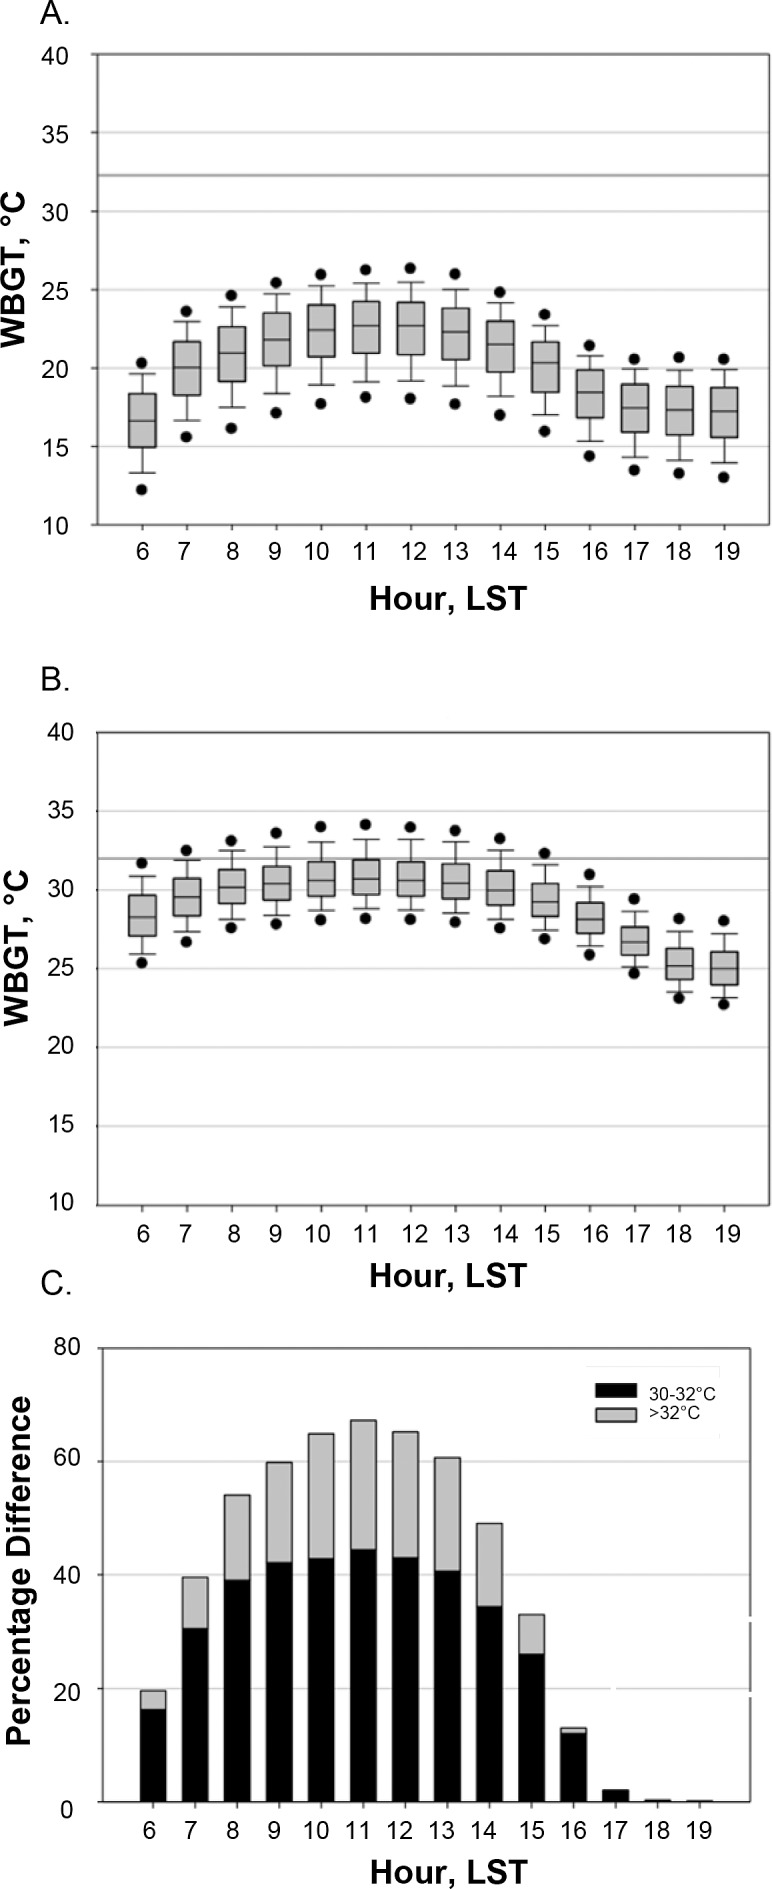
The competitions in Qatar are planned to occur between November 21 and December 18, 2022 (Figure 4). During this period, mild conditions are expected based on the 36-year climatology model, with median peak temperatures reaching approximately 23°C WBGT (Figure 4A). Very hot conditions are rare such that, even during the hottest time of day, no more than 0.3% of hours exceed 30°C WBGT. Planning the competition for late fall provides significant heat mitigation relative to conditions expected during the traditional summer competition period. For instance, if competitions were to be held between June 14 and July 15, median WBGTs would be approximately 8°C hotter and reach ≥30°C from 8:00 am to 2:00 pm LST (Figure 4B). In addition, the percentages of hours exceeding 30°C and 32°C WBGT, respectively, between the summer and fall tournament dates differ (Figure 4C). From the morning to early afternoon, the data indicate 50%–70% more hours ≥30°C WBGT and 15%–23% more hours >32°C WBGT (Figure 4C).
Figure 4.

Box plots of hourly wet-bulb globe temperatures (WBGTs) from 1980–2016 in Qatar during (A) the scheduled (November 21–December 18) and (B) traditional (June 14–July 15) periods of international football tournaments, and (C) difference in the percentage of hours at 30°C–32°C and >32°C WBGT in Qatar between the traditional summer and the scheduled fall tournament time. The boundaries of the box represents the 25th and 75th percentiles. The line within the box indicates the median, the whiskers are the 10th and 90th percentiles, and the points above and below the whiskers are the 5th and 95th percentiles, respectively. The horizontal line marks 32°C WBGT. Abbreviation: LST, Local Standard Time.
DISCUSSION
We used climatologic data derived from a reanalysis dataset (MERRA-2) and a WBGT model to evaluate the range of possible WBGTs at venues that will be hosting international football matches in Japan (Yokohama and Saitama) and Qatar (Doha and Al-Daayen). Weather conditions at the tournament venues in Japan and Qatar may present stressful conditions for athletes, depending on the time of day and season. For the 2 cities in Japan (Yokohama and Saitama) during the scheduled tournament time, from 40% to 50% of hours in the late morning to early afternoon would be expected to exceed 30°C WBGT. This pattern of WBGTs during the day provides important information when determining the game schedules for outdoor competitions such as football. For example, 25% of the matches played by men's and women's football teams at the Rio Summer Olympic Football Tournament in 2016 were scheduled during hot times of the day between 1:00 and 3:00 pm LST. This also raises a concern for cumulative heat-stress exposure, especially during international football tournaments such as the Olympics and the World Cup, where athletes may be exposed to continuous and consecutive days of heat stress. The authors of previous epidemiologic studies20,21 have shown that consecutive days of heat exposure may increase the risk of exertional heat illness. In fact, physiological strain incurred from thermal strain may be greater on the succeeding day.22 Schlader et al11 also reported a greater magnitude of internal body temperature rise on the succeeding day of strenuous physical activity (ie, ∼90% of maximal heart rate in a 20-minute exercise bout) in the heat. Climatologic data showed that early morning and late afternoon games substantially reduced the likelihood of experiencing WBGTs in excess of 30°C. As such, these findings call for appropriate planning, including consideration of local climatology, in the match and travel schedules to ensure athletes have adequate time to recover23 and opportunities to optimize the recovery process (ie, avoidance of exposure to more heat than necessary) so they can mitigate the exertional heat-illness risk while optimizing their performance. The environmental data-driven safety precautions would also enhance spectator safety to prevent potential mass heat casualties by supplying adequate sources of hydration and opportunities for body cooling, such as enclosed air-conditioned areas, which may influence the decision on venue selection. The use of heat warnings and alerts aimed at spectators that include information pertaining to appropriate attire and hydration considerations at varying time points (eg, days before the event, on the day of the event, during the event) may also help facilitate behaviors that protect them from the sequelae of extreme heat (eg, dehydration, exertional heat illness).
Climatologic data for Qatar demonstrated a drastic difference in the average hourly WBGTs between the traditional and scheduled periods of competition, which confirms the importance of considering the local climate in mitigating anticipated heat hazards. Unlike 1-day sporting events, such as road races, it becomes very difficult for the organizers of multiday events to accommodate and modify their schedules in response to variations in weather conditions. If shifting the time of the year for a competition is not feasible, the event host should provide other resources such as cooling stations, adequate clean water sources, and ice at venues to mitigate the heat strain through body cooling and hydration. Furthermore, such planning is not exclusive to football matches but should be considered for any multiday sporting events that are hosted during the hot season of the year.
Wet-bulb globe temperature data are rarely available for determining climatologic conditions and therefore have not been available for pre-event planning purposes. Our methodologic approach to determining WBGTs is reproducible globally and may provide a template for more routinely using these data in tournament scheduling. The MERRA-2 data do not account for local, microclimatologic conditions at a specific venue. However, the mesoscale resolution of the MERRA-2 grids, on the order of tens of kilometers, is suitable for identifying the regional conditions needed for planning decisions. Also, our climatologic data provide a range of WBGTs that have occurred historically for planning purposes but are not designed to forecast conditions for specific dates or times.
The effects of extreme heat may be more pronounced in other levels of competitions, such as local club leagues or school-organized leagues, where access to appropriate medical providers is limited. In such circumstances, adopting hydration-break policies and avoiding events during the extreme heat hours become even more critical to minimize the detrimental effects on athletic performance and the risk of exertional heat injuries. Successful organizational management of extreme heat risk on the international level, such as the Olympic football tournament, will help establish an exemplary model for coordinating football events at local levels.
CONCLUSIONS
The MERRA-2–based WBGTs may provide valuable information for organizers of sport tournaments to assess the foreseeable heat risk and devise a plan to prophylactically mitigate the effects. Specifically, climatologic data for modeled WBGTs during the 2020 Olympic football tournament in Japan revealed that the WBGT may exceed 30°C in 40% to 50% of the late mornings and early afternoons of the days during the tournament. In addition, the modeled WBGTs during the 2022 FIFA World Cup in Qatar demonstrated that the shift in tournament timing from the summer to late fall may reduce the likelihood of extreme heat exposure. Examples from the 2 events investigated in this study suggest that the directors of mass sporting events should consider using climatologic data in their organizational decision making during event planning.
REFERENCES
- 1.Chmura P, Konefał M, Andrzejewski M, Kosowski J, Rokita A, Chmura J. Physical activity profile of 2014 FIFA World Cup players, with regard to different ranges of air temperature and relative humidity. Int J Biometeorol. 2017;61(4):677–684. doi: 10.1007/s00484-016-1245-5. [DOI] [PubMed] [Google Scholar]
- 2.American College of Sports Medicine. LE Armstrong, Casa DJ, et al. American College of Sports Medicine position stand: exertional heat illness during training and competition. Med Sci Sports Exerc. 2007;39(3):556–572. doi: 10.1249/MSS.0b013e31802fa199. [DOI] [PubMed] [Google Scholar]
- 3.Brotherhood JR. Heat stress and strain in exercise and sport. J Sci Med Sport. 2008;11(1):6–19. doi: 10.1016/j.jsams.2007.08.017. [DOI] [PubMed] [Google Scholar]
- 4.American College of Sports Medicine. Sawka MN, Burke LM, et al. American College of Sports Medicine position stand. Exercise and fluid replacement. Med Sci Sports Exerc. 2007;39(2):377–390. doi: 10.1249/mss.0b013e31802ca597. [DOI] [PubMed] [Google Scholar]
- 5.Casa DJ, DeMartini JK, Bergeron MF, et al. National Athletic Trainers' Association position statement: exertional heat illnesses. J Athl Train. 2015;50(9):986–1000. doi: 10.4085/1062-6050-50.9.07. [DOI] [PMC free article] [PubMed] [Google Scholar]
- 6.Jacklitsch B, Williams W, Musolin K, Coca A, Kim J-H, Turner N. Criteria for a recommended standard: occupational exposure to heat and hot environments. Centers for Disease Control and Prevention Web site. http://www.cdc.gov/niosh/docs/2016-106/pdfs/2016-106.pdf Published 2016. Accessed April 20, 2018.
- 7.US Department of the Army. Technical bulletin MED 507: heat stress control and heat casualty management. Uniformed Services University Web site. https://www.hprc-online.org/resources/tb-med-507-heat-stress-control-and-heat-casualty-management-pdf Published 2013. Accessed April 20, 2018.
- 8.Grundstein A, Williams C, Phan M, Cooper E. Regional heat safety thresholds for athletics in the contiguous United States. Appl Geogr. 2015;56:55–60. [Google Scholar]
- 9.Elias SR. 10-year trend in USA Cup soccer injuries: 1988–1997. Med Sci Sports Exerc. 2001;33(3):359–367. doi: 10.1097/00005768-200103000-00004. [DOI] [PubMed] [Google Scholar]
- 10.Agel J, Evans TA, Dick R, Putukian M, Marshall SW. Descriptive epidemiology of collegiate men's soccer injuries: National Collegiate Athletic Association Injury Surveillance System, 1988–1989 through 2002–2003. J Athl Train. 2007;42(2):270–277. [PMC free article] [PubMed] [Google Scholar]
- 11.Schlader ZJ, Colburn D, Hostler D. Heat strain is exacerbated on the second of consecutive days of fire suppression. Med Sci Sports Exerc. 2017;49(5):999–1005. doi: 10.1249/MSS.0000000000001191. [DOI] [PubMed] [Google Scholar]
- 12.MERRA-2: file specification. GMAO office note No. 9 (version 1.1) Global Modeling and Assimilation Office Web site. https://gmao.gsfc.nasa.gov/pubs/docs/Bosilovich785.pdf Published 2016. Accessed April 20, 2018.
- 13.Liljegren JC, Carhart RA, Lawday P, Tschopp S, Sharp R. Modeling the wet bulb globe temperature using standard meteorological measurements. J Occup Environ Hyg. 2008;5(10):645–655. doi: 10.1080/15459620802310770. [DOI] [PubMed] [Google Scholar]
- 14.Yaglou CP, Minard D. Control of heat casualties at military training centers. AMA Arch Ind Health. 1957;16(4):302–316. [PubMed] [Google Scholar]
- 15.Lemke B, Kjellstrom T. Calculating workplace WBGT from meteorological data: a tool for climate change assessment. Ind Health. 2012;50(4):267–278. doi: 10.2486/indhealth.ms1352. [DOI] [PubMed] [Google Scholar]
- 16.Patel T, Mullen SP, Santee WR. Comparison of methods for estimating wet-bulb globe temperature index from standard meteorological measurements. Mil Med. 2013;178(8):926–933. doi: 10.7205/MILMED-D-13-00117. [DOI] [PubMed] [Google Scholar]
- 17.Bosilovich MG, Robertson FR, Takacs L, Molod A, Mocko D. Atmospheric water balance and variability in the MERRA-2 reanalysis. J Clim. 2017;30(4):1177–1196. [Google Scholar]
- 18.Rienecker MM, Suarez MJ, Gelaro R, et al. MERRA: NASA's modern-era retrospective analysis for research and applications. J Clim. 2011;24(14):3624–3648. doi: 10.1175/JCLI-D-16-0758.1. [DOI] [PMC free article] [PubMed] [Google Scholar]
- 19.Fujiwara M, Wright JS, Manney GL, et al. Introduction to the SPARC Reanalysis Intercomparison Project (S-RIP) and overview of the reanalysis systems. Atmos Chem Phys. 2017;17(2):1417–1452. [Google Scholar]
- 20.Wallace RF, Kriebel D, Punnett L, et al. The effects of continuous hot weather training on risk of exertional heat illness. Med Sci Sports Exerc. 2005;37(1):84–90. doi: 10.1249/01.mss.0000150018.90213.aa. [DOI] [PubMed] [Google Scholar]
- 21.Lee JS, Byun HR, Kim DW. Development of accumulated heat stress index based on time-weighted function. Theor Appl Climatol. 2016;124(3–4):541–554. [Google Scholar]
- 22.Kark JA, Burr PQ, Wenger CB, Gastaldo E, Gardner JW. Exertional heat illness in Marine Corps recruit training. Aviat Space Environ Med. 1996;67(4):354–360. [PubMed] [Google Scholar]
- 23.Fowler PM, McCall A, Jones M, Duffield R. Effects of long-haul transmeridian travel on player preparedness: case study of a national team at the 2014 FIFA World Cup. J Sci Med Sport. 2017;20(4):322–327. doi: 10.1016/j.jsams.2016.08.021. [DOI] [PubMed] [Google Scholar]


