

Abstract
Vocal production is the result of interacting cognitive and autonomic processes. Despite claims that changes in one interoceptive state (arousal) govern primate vocalizations, we know very little about how it influences their likelihood and timing. In this study we investigated the role of arousal during naturally occurring vocal production in marmoset monkeys. Throughout each session, naturally occurring contact calls are produced more quickly, and with greater probability, during higher levels of arousal, as measured by heart rate. On average, we observed a steady increase in heart rate 23 s before the production of a call. Following call production, there is a sharp and steep cardiac deceleration lasting ∼8 s. The dynamics of cardiac fluctuations around a vocalization cannot be completely predicted by the animal's respiration or movement. Moreover, the timing of vocal production was tightly correlated to the phase of a 0.1-Hz autonomic nervous system rhythm known as the Mayer wave. Finally, a compilation of the state space of arousal dynamics during vocalization illustrated that perturbations to the resting state space increase the likelihood of a call occurring. Together, these data suggest that arousal dynamics are critical for spontaneous primate vocal production, not only as a robust predictor of the likelihood of vocal onset but also as scaffolding on which behavior can unfold.
Keywords: anterior cingulate, autonomic nervous system, default mode, interoception, Mayer wave
NEW & NOTEWORTHY
We investigated the role of arousal during naturally occurring vocal production in marmoset monkeys. The timing of vocal production was tightly correlated to an autonomic nervous system rhythm known as the Mayer wave. A state space of arousal dynamics during vocalization illustrated that perturbations to the resting state increase the likelihood of a call occurring. Arousal dynamics are critical for spontaneous primate vocal production, acting as the foundation on which vocal behavior can unfold.
vocal production is the result of interacting cognitive and autonomic processes, similar to those underlying the production of facial expressions or other communicative signals (Gothard 2014). In nonhuman primates (hereafter, primates), we know that many external factors influence the timing and likelihood to produce a vocalization (Seyfarth and Cheney 2003). Such factors include an individual's recent history of social interactions (Cheney and Seyfarth 1997), strength of bonds (Kulahci et al. 2015), position in a social hierarchy (Kitchen et al. 2005), distance from conspecifics (Choi et al. 2015; Fischer et al. 2001), seeing a predator (Seyfarth et al. 1980), hearing conspecific calls in general (Ghazanfar et al. 2001; Takahashi et al. 2013), and hearing calls from a specific individual (Miller and Thomas 2012). These findings are bolstered by recent neurophysiological studies implicating neocortical structures in the production of vocalizations (Coudé et al. 2011; Hage et al. 2013; Hage and Nieder 2013). Whereas the above external factors have been exhaustively studied, we know very little about how internal, autonomic processes may influence vocal production in primates.
One autonomic nervous system function is to control the state of arousal. Arousal is relevant for a range of behaviors (Pfaff 2006), and an animal would be said to exhibit a high arousal state if it is more alert to sensory stimuli, more motorically active, and more reactive (Garey et al. 2003; Pfaff 2006). In the domain of vocal behavior, the focus has been on linking presumptive arousal level changes to changes in behavioral context and, subsequently, to changes in the acoustic properties of vocalizations. For example, in tree shrews, decreasing physical distance between a male and female is thought to increase arousal levels in the female, resulting in a higher rate of vocal output (with higher fundamental frequencies; Schehka et al. 2007). Along the same lines, levels of “response urgency” can be modulated by distance from a predator, and this is linked to changes in the acoustic structure of alarm calls in squirrels (Owings and Virginia 1978), marmots (Blumstein and Armitage 1997), and meerkats (Manser 2001). Acoustic changes in cat (Scheumann et al. 2012), bat (Bastian and Schmidt 2008), and horse (Briefer et al. 2015) vocalizations were also reported as a response to context-related arousal fluctuations. In primates, changes in arousal levels are also repeatedly linked to changes in vocal acoustics (Hammerschmidt and Fischer 2008; Owren et al. 2011; Rendall and Owren 2009). In baboons, for instance, Rendall (2003) examined the grunt vocalizations of females in two different contexts and, within these two contexts, categorized low and high arousal states based on patterns of movement. He found that variation according to arousal levels was mainly associated with changes in the rate of calls produced and their duration, as well as changes in the fundamental frequency (Rendall 2003).
In the current study, we address a different question with regard to arousal and vocal production: What mechanism drives an individual primate to produce a vocalization at all? To investigate this, we needed a model system that readily produces vocalizations without the necessity of an external event such as a conspecific vocalization, predator, or other overt sensory trigger. Such a context would allow us to focus solely on how changes in arousal may or may not be linked to vocal production. The calling behavior of marmoset monkeys (Callithrix jacchus) meets this criterion (Borjon and Ghazanfar 2014). When alone, marmoset monkeys vocalize readily and spontaneously (Bezerra and Souto 2008; Takahashi et al. 2013). Typically, if a conspecific is within hearing range, the two individuals will take turns exchanging calls (Takahashi et al. 2013), but if not, the isolated marmoset will continue calling. Moreover, in this undirected context, nearly all the calls they produce are a single type of contact call, the “phee” call. It is a high-pitched vocalization with one or more largely identical “syllables” (Bezerra and Souto 2008; Takahashi et al. 2013). Because context controls the call type, this allows us the clearest possible means to investigate how arousal may influence vocal production.
MATERIALS AND METHODS
Four adult common marmosets (Callithrix jacchus; 3 males and 1 female, average age 5.1 yr) housed at Princeton University were used in this study. The median number of sessions they participated in was seven sessions per animal (monkeys 1–4: 9, 3, 9, and 5 sessions, respectively). All marmosets lived with their pair-bonded mates in family groups and were born in captivity. They were fed daily with standard commercial chow supplemented with fresh fruits and vegetables and had ad libitum access to water. The colony room was maintained at a temperature of ∼27°C with 50–60% relative humidity and a 12:12-h light-dark cycle. All experimental sessions were conducted during daylight hours between 1200 and 1800. All experiments were performed in compliance with the guidelines of, and were approved by, the Princeton University Institutional Animal Care and Use Committee.
Electromyography.
For the experiment, the animal was placed in a testing box. The testing box was made of Plexiglas and wire in a triangular prism shape (0.30 × 0.30 × 0.35 m). To record the electromyographic (EMG) signal, we used two pairs of Ag-AgCl surface electrodes (Grass Technology). Tethered electrodes were sewn into a soft elastic band, which was clasped around the animal's thorax. One pair of electrodes was affixed to the chest area close to the heart and the second pair placed on the back, close to the diaphragm. To improve the signal-to-noise ratio, we applied ECL gel on the surface of each electrode. If needed, marmosets were shaved around the thorax. Each pair of electrodes was differentially amplified (×250) with the resulting signal sent to a Plexon Omniplex, where it was digitized at 40 kHz and sent to a personal computer for data acquisition. Recorded sessions were between 20 and 50 min (means ± SD, monkeys 1–4: 21.86 ± 11.70, 31.76 ± 5.51, 22.63 ± 12.32, and 15.44 ± 4.86, respectively).
Recording vocalizations.
Vocalizations were recorded using a Sennheiser MKH416-P48 microphone suspended 0.9 m above the testing box. The microphone signal was sent to a Mackie 402-VLZ3 line mixer whose output was then relayed to the Plexon Omniplex for acquisition. This ensured the timing accuracy of the vocal signals relative to the EMG signals. Although marmosets produce a number of distinct vocalizations in a number of different contexts (Bezerra and Souto 2008), 99% of the vocalizations recorded in the undirected context of social isolation used in this study were phee calls, the species-typical contact call. We used the same criterion we established in previous work for computationally defining and segmenting phee calls and their syllables (Takahashi et al. 2013). This and all subsequent analyses were conducted in MATLAB 2015a. The segmentation routine automatically detected the onset and offset of any acoustic signal that differed from the background noise at a specific frequency range. To detect the differences, we bandpassed the entire recorded signal between 5 and 8 kHz for each session. This frequency band captures the fundamental frequency of phee calls. We then compared the amplitude of the signal at this frequency band for the periods without calls and during a call. A simple threshold was enough to distinguish both periods. Onset-offset gaps longer than 1 s indicated separate calls, whereas gaps shorter than or equal to 1 s indicated syllables from the same call. After this procedure, we manually verified for each call whether the automatic routine correctly identified single phee calls or combined multiple calls, using the 1-s separation criteria. Furthermore, we counted the number of syllables of each call, and if there was any mismatch between the automatic onset-offset detection and the call observed in a spectrogram, we marked the onset and offset of the call manually. A total of 427 calls were produced across a span of 26 sessions (for monkeys 1–4: 192, 29, 120, and 86 calls, respectively).
Heart rate analyses.
Surface electrodes along both the ventral and dorsal thorax of the marmoset can each pick up both heart rate and respiratory signals. The strength of these signals can vary throughout a session as the positioning of the surface electrodes changes with the animal's movement. Therefore, we sought to screen the quality of the data and determine which channel exhibited the cardiac signal with the largest signal-to-noise ratio on a session-by-session basis. This channel was used for all heart rate analyses for that session. Because automated methods of detecting and removing noise from these selected channels were suboptimal, we manually identified and isolated motion artifacts or signal cutoffs. To minimize bias, we did the following: for each session, signals from both EMG channels were divided into 10-s segments and signal pairs were presented in random order for visual inspection. Regions exhibiting signal loss or motion artifacts were replaced with NaNs (not-a-number; MATLAB).
Following this screening, we down-sampled the data from 40 kHz to 1,500 Hz to extract the cardiac signals. These signals were then high-pass filtered at 15 Hz to preserve the rapid waveform of the heartbeat. To remove line noise, the resulting signal was notch filtered at 60 Hz. Heart beats were detected using an adaptive threshold of 1-s duration to find cardiac spikes greater than the 95th percentile of the amplitude at each second of the signal. Occasionally, the detection of heartbeats would pick up a spurious spike close to the actual heartbeat. This would result in a series of spikes occurring with an interspike timing faster than 100 ms, corresponding to a biologically implausible 600 beats/min. We therefore implemented a speed threshold, whereby 2 spikes occurring in succession quicker than 100 ms were substituted with a single spike located at the midpoint. It is also possible for the EMG recording to miss a heartbeat. If any interbeat interval between spikes was larger than 400 ms (150 beats/min), which is the minimum heart rate reported in conscious, unrestrained adult marmosets (Schnell and Wood 1993), we replaced the intervening signal with NaNs to account for the signal loss. To calculate heart rate, we constructed a binary series of heartbeat counts and convolved the resulting series with a 1-s Gaussian window. This method is often used in estimating the instantaneous rate of action potential occurrences in neurophysiological data (Shimazaki and Shinomoto 2010).
Respiratory rate analyses.
The same noise control procedure used to determine the best channel of cardiac activity was used to determine which channel demonstrated the best respiration signal. Segments of signals that did not demonstrate a respiratory signal were excluded from further analysis by being replaced with NaNs. Since we were interested in physiological signals related to respiration (<3 Hz), we down-sampled the data from 40 kHz to 50 Hz. To remove the DC offset, we high-pass filtered the signal at 1 Hz. This resulting signal was further low-pass filtered at 4 Hz to isolate respiratory activity. Because mammals, including primates, produce vocalizations using expiration-driven vocal fold movements (Fitch and Hauser 1995), we wanted to make sure that the respiratory signal always had a consistent phase relationship with vocal output. That is, we wanted to keep the expiratory phase of the respiration signal in a consistent orientation relative to vocal production (so that the beginning of expiration was the peak of the respiratory curve). To do this, we ensured that the slope between the point of respiration at call onset and the point of respiration at the peak call amplitude was negative. The phase coordinates of the respiratory signal were then determined by calculating the angle of the Hilbert transform of the resulting signal. To calculate respiratory rate, we first detected the points in time where the angle of the Hilbert transform was 0, representing the beginning of expiration. These time points were converted into a binary representation and convolved with a 2-s Gaussian window. Again, this method is often used in estimating the instantaneous rate of spike occurrences (Shimazaki and Shinomoto 2010).
Call timing and probability measures.
We wanted to understand the relationship between heart rate and call timing on a session level. That is, we wanted to determine how quickly a call will occur given the current heart rate at any point during a session. To obtain the heart rate at a resolution of 1 s, we divided the data into 1-s bins and computed the average heart rate for each bin. There are considerable differences in heart rate between individuals (Cacioppo et al. 1994). To normalize changes in the magnitude of heart rate between our marmoset subjects, we converted the 1-s averages into percentiles (from the 0th percentile up to the 100th percentile, in bins of 1 percentile). Call timing relative to each bin of data was determined by measuring the interval from each bin to the onset of the closest call. To visualize the average probability curve, we fit the data to a cubic spline using csaps in MATLAB.
We also wanted to know the probability of observing a call given a certain heart rate from any point within the session. Using the 1-s averages, we measured the probability of observing a single call within 23 s of each bin. This time point corresponds to the minimum average time interval from each heart rate percentile to the closest subsequent call, as described in the preceding paragraph. To better visualize the probability of observing a single call within 23 s, we grouped the data at 5 percentile steps. To show the slope of the correlation, we used linear regression to plot the line of best fit. We calculated the correlation using corr in MATLAB and ran a Spearman correlation between the averaged data points and heart rate percentiles.
Index of motor activity.
To determine whether a marmoset was moving and active during the session, we analyzed the videos recorded during the experiment (23 of 26 sessions were video recorded at 30 frames/s using Plexon Cineplex). Each recording was split into segments of 30 frames. For each segment, we took the absolute difference between the 1st and 30th frames. This value corresponded to the difference in pixel luminance between the two frames. A higher value indicates more of a difference, signifying movement. We calculated, for each session, the 90th percentile of these pixel values and used that as a cutoff to construct a binary signal. Values higher than the cutoff were instances of movement, whereas values below the cutoff were not.
We manually scored the timing of each vocalization by watching the muted video. We only marked instances where we could clearly see, via mouth movements, the beginning and end of a vocalization. The beginning of a vocalization was marked at the frame prior to the animal opening its mouth. The end of the vocalization was marked at the frame after closure of the mouth. From this, we accounted for 239 vocalizations of the 427 used in heart rate and respiratory rate analysis in 23 videos. Because the video frame rate is at 30 Hz, our identification of call types had a maximum resolution of 1/30 s. Using the video-marked vocalization onsets, we were able to compile data for Fig. 4B.
Fig. 4.

General motor activity partially accounts for fluctuations in arousal during a vocalization. A: schematic showing how we calculate the motion index for each animal. B: smoothed population median of ongoing motor activity plotted with the 95% bootstrapped CI of the median. Red line indicates values outside 95% of the bootstrapped significance test for motor variability. C: cross-correlation plot of the motion and heart rate signals for data aligned to call onset (black) and call offset (gray). The positive (purple) and negative (green) peaks of the cross correlation are denoted with crosses and were used to construct a linear predictor. D: results of a linear predictor of heart rate from ongoing motor activity. The smoothed population median of heart rate is plotted (black) against the 95% bootstrapped CI of the motion-predicted heart rate at its positive (purple) and negative (green) peak.
Population medians, individual medians, and smoothing.
To visualize the dynamics of heart rate, respiratory rate, and motor activity surrounding a call event, we took the median of 40 s before and after both call onset and offset, and we fit a cubic spline to the data using csaps in MATLAB (smoothing parameter 0.3 for the population median and 0.01 for the individual medians).
Bootstrapped permutation tests and confidence intervals.
To determine whether the changes in heart and respiratory rate and motor activity were significant, we performed a bootstrapped significance test. For each session, we chose random segments equivalent in number and length to the calls produced in that session from our data set. The median of this randomly selected data was calculated and fit to a cubic spline using csaps in MATLAB. We repeated this process 1,000 times. The 95% threshold for significance corresponds to the 2.5th and 97.5th percentiles of the bootstrapped medians.
Confidence intervals for the medians of heart and respiratory rate and motor activity were generated by randomly resampling, with replacement, from the signals used to calculate the plotted medians. We calculated the median of the resampled signals and fit it to a cubic spline using csaps in MATLAB. We repeated this process 1,000 times. The 95% confidence interval corresponds to the 2.5th and 97.5th percentiles of the bootstrapped medians.
Linear prediction of heart rate using respiration rate and the motor index.
We sought to linearly predict heart rate from ongoing respiratory activity. We first calculated the cross-correlation of heart and respiratory rate using the median of the data set, and then took the maximal and minimal peak after 0 s delay. These points indicate the times at which respiratory rate maximally correlates to heart rate. Aligned to call onset, the first positive peak occurs at 5 s, whereas the negative peak occurs at 23.34 s. Aligned to call offset, the first positive peak occurs at 5.78 s, whereas the negative peak occurs at 21.48 s. We built linear predictors of heart rate from respiratory rate starting from these points in time. To build them, we calculated the linear regression between heart rate and respiratory rate. We created an interval of predicted heart rate by using a bootstrap procedure for the data aligned to call onset and call offset. For this, we uniformly and randomly sampled segments of heart rate and the corresponding respiratory rates. For each pair of segments, we then calculated the predicted heart rate curve using the associated respiratory rate curve. This resampling procedure was repeated 1,000 times. The 95% confidence interval corresponds to the 2.5th and 97.5th percentiles of the predicted heart rate.
We constructed an analogous linear predictor using the average of the motion index and the median of the heart rate data. Because the motion index is gathered at a sampling rate of 1 Hz, we down-sampled the 50-Hz heart rate median to 1 Hz to match the motion index. We cross-correlated the down-sampled heart rate median to the mean of the motion index. Aligned to call onset, the first positive peak occurs at 6 s, whereas the negative peak occurs at 29 s. Aligned to call offset, the first positive peak occurs at 8 s, whereas the negative peak occurs at 32 s. We calculated the linear predictor sequence as described above. The 2.5th and 97.5th percentiles of the predicted heart rate were up-sampled to 50 Hz from 1 Hz. Down-sampling and up-sampling were conducted using the resample function in MATLAB.
Probability density and power spectrum density estimates.
To determine the oscillatory nature of marmoset vocal production, we first calculated the timing interval (in seconds) between spontaneous vocalizations for every marmoset. The interval was from the onset of one call until the beginning of the subsequent call. Using this input calculated across all animals, we constructed a probability density function using ksdensity in MATLAB.
To visualize the range of frequencies underlying the dynamics of the heart and respiratory rate signal, we calculated the power spectrum density of the signal 25-s before each call onset for every animal and session. Each signal was detrended and normalized by calculating its Z score. We used pburg in MATLAB to calculate the power spectrum density estimates. To calculate the population power spectrum, we computed the average across all calls.
To calculate the call rate, we constructed a binary equivalent in length to each of the 26 sessions. This binary was convolved with a 1-s bandwidth Gaussian window and then detrended and Z-scored. We calculated the average power spectrum density for the resulting signals using pburg. To allow comparison between the signals, we normalized all power spectra to their first observed peak.
Phase calculations.
To calculate the phase of the heart and respiration rate, we calculated the angle of the Hilbert transform for each call. We then calculated a circular phase density plot for the phase at call onset using circ_ksdensity in MATLAB. A significance test was constructed by first randomly sampling, for each session, a number of points equal in number to the number of calls. We then calculated the phases of these points for every session and calculated the distribution of phases using the circular density plot as before. We repeated this procedure 1,000 times to obtain the bootstrap confidence interval.
State space plot and multivariate Gaussian distribution fitting.
To understand the cardiorespiratory dynamics underlying vocal production, we constructed the state space from the median heart rate and respiratory rate during a vocalization. We plotted heart rate against respiratory rate for 25 s before call onset until 20 s after the call began.
To visualize the scope of cardiorespiratory variability within our data set, we fit the permuted data set used for the bootstrapped significance test of heart and respiratory rate variability to a Gaussian distribution. We first calculated the cardiorespiratory data set's covariance matrix using cov in MATLAB. We then fit a multivariate normal Gaussian distribution to the permuted data and calculated the contours encompassing the 95% confidence interval for the distribution.
RESULTS
Increases in arousal precede the production of vocalizations and influence its probability and timing.
We used surface electromyography (EMG) to measure muscle activity around the thorax of four unrestrained adult common marmosets as they spontaneously produced contact phee calls in an undirected context (i.e., social isolation). This allowed us to capture ongoing heart rate simultaneously with respiratory activity, the latter of which is directly related to mammalian vocal production. The undirected context contained no external social signals, meaning there were no response phee calls produced by an out-of-sight conspecific, as would typically be the case in a contact-calling scenario (Takahashi et al. 2013). Figure 1A shows the standard position of electrodes on the body and an example of the raw EMG signal recorded during a one-syllable phee call. An average power spectrum of the EMG signal across the entire data set reveals two distinct peaks: a slow frequency associated with respiration and a higher frequency linked to cardiac activity (Fig. 1B). An adaptive threshold was used to identify cardiac spike trains in the high-frequency band, and this was then used to measure heart rate changes. In the lower frequency band, respiratory peaks were identified using a Hilbert transform and then converted into respiratory rate. As in humans (Cacioppo et al. 1994), marmosets exhibited considerable individual differences in the range of heart and respiration rates. To put these values in a uniform scale, we normalized each subject's heart and respiratory rate into percentiles. Figure 2A shows the different ranges of heart rate (monkeys 1–4: 321 ± 75, 409 ± 39, 388 ± 45, and 382 ± 55 beats/min, respectively) and respiratory rate [for monkeys 1–4: 85 ± 24, 85 ± 24, 77 ± 19, and 83 ± 27 respiratory cycles/min (rpm), respectively].
Fig. 1.

Measuring respiration and heart rate from electromyographic (EMG) signal. A: surface electrodes were applied to the dorsal and ventral thorax of an adult marmoset. Signals were processed through a differential amplifier (Diff. amp) before being sent to the data acquisition (DAQ) system (PC, personal computer). An individual exemplar of a vocalization (highlighted in turquoise) with nonvocalization periods is plotted in black. The exemplar comprises the vocalization's spectrogram, the amplitude of the vocalization, and the raw data down-sampled to 1,500 Hz (Amp., amplitude; Freq., frequency; n.u., normalized unit). B: population power spectral density estimates demonstrating 2 peaks, one representing respiratory rate (0–15 Hz) and another indicating heart rate (6–8 Hz). The cardiac signal output was isolated; an exemplar heart beat after filtering of the raw data is shown in the inset. Using an adaptive threshold, we detected the spikes exceeding the 95% percentile of the signal, converting the spikes into a binary and convolving it with a 1-s Gaussian kernel, resulting in ongoing heart rate (bpm, Beats/min). After isolating the respiratory signal output through filtering, we calculated the angle of the Hilbert transform of the respiration signal whereby zero-crossing points represented respiratory peaks. We converted these peaks into a binary and convolved it with a 2-s Gaussian kernel, resulting in ongoing respiration rate (Resp. rate, respirations/min).
Fig. 2.
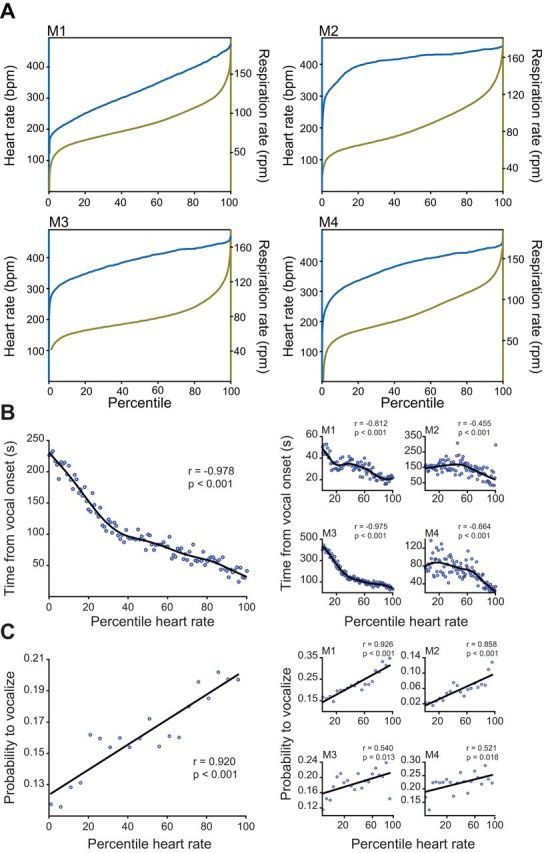
Relationship between heart rate, respiration rate, and the production of vocalizations. A: cumulative density plots for each animal (M1–M4) plotting heart rate (left y-axis, blue) and respiratory rate (right y-axis, green) against its percentile. B: average time from vocal onset plotted against percentile heart rate for the population with a cubic spline fit. At right, individual averages demonstrate the same positive correlation between time from vocal onset and heart rate percentile. C: average population probability of vocalization plotted against heart rate percentile. At right, probability curves are shown for each individual animal. Statistics reported are Spearman correlations.
If arousal contributes to spontaneous vocal production, we would predict an interaction between heart rate, a temporally precise index of arousal state (Gray et al. 2012; Obrist et al. 1970), and the timing and likelihood to vocalize. A total of 427 spontaneous phee calls were recorded during our EMG experiments. Figure 2B shows the negative correlation between time of vocalization onset and heart rate for both the population and individual monkeys. The onset of call production was quicker following epochs of high vs. low heart rates (for population, Spearman correlation, −0.978, P < 0.001). The exact onset of call production relative to heart rate is also highly dependent on the individual animal, with some animals producing calls more frequently than others. To illustrate this, we have provided data for each animal in our study. While high heart rate modulates the timing of vocal onset, it does not provide information regarding the likelihood of a call occurring after a given level of cardiac activity. For example, it could be that at a heart percentile of 90, a vocalization is 50% likely to occur quickly, and at a heart rate percentile of 25, a vocalization is also 50% likely to occur but takes longer to be elicited. Figure 2C shows a positive correlation between heart rate and the probability of the phee call being produced within 23 s of a given heart rate percentile (for population, Spearman correlation, 0.920, P < 0.001). Thus the higher the heart rate, the greater the probability of vocal output. These data show that both the timing and probability of vocal production are correlated with heart rate.
The baroreceptor pathway does not wholly predict the link between heart rate changes and vocal production.
We next examined the dynamics of heart rate during the moments preceding and following the production of a phee call. Phee vocalizations can differ in their durations (2.03 ± 0.96 s); we therefore plotted the heart rate data aligned to vocalization onset and offset, separately (Fig. 3A). Red lines indicate epochs that were significantly different from baseline cardiac activity (i.e., exceeded a 5% significance level). Marmosets exhibited an increase in heart rate before vocal production, followed by a rapid heart rate deceleration. The heart rate increase began slowly, starting roughly 23 s before the onset of a vocalization. At vocal offset, the steep deceleration in cardiac activity falls below the baseline for ∼10 s. In Fig. 3A, the continuing increase in heart rate level corresponds to the increases in heart rate occurring with subsequent phee call production.
Fig. 3.
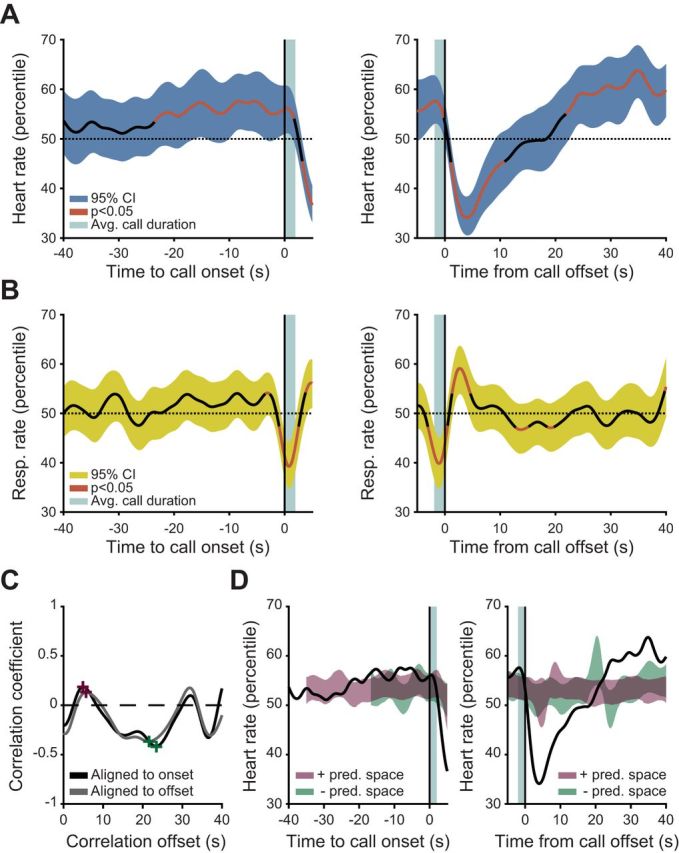
Vocalizations are preceded by an increase in arousal. A and B: smoothed population medians of ongoing heart rate (A) and respiration rate (B) plotted with the 95% bootstrapped confidence interval (CI) of the median. Red line indicates values outside 95% of the bootstrapped significance test for cardiorespiratory variability. C: cross-correlation plot of the respiration and heart rate signals for data aligned to call onset (black) and call offset (gray). The positive (purple) and negative (green) peaks of the cross correlation are denoted with crosses and were used to construct a linear predictor. D: results of a linear predictor of heart rate from ongoing respiration. The smoothed population median of heart rate is plotted (black) against the 95% bootstrapped CI of the respiration-predicted heart rate at its positive (purple) and negative (green) peak (Pred., predicted).
Considering that mammalian vocalizations are produced in a largely similar manner through the utilization of respiratory power and laryngeal tension (Fitch and Hauser 1995; Ghazanfar and Rendall 2008), any shared mechanisms across species are likely to include the baroreceptor pathways. The act of vocalizing is critically dependent on respiration, and respiratory output is linked to cardiac activity via baroreceptor pathways (Critchley and Harrison 2013). We wanted to test if the change in respiration during vocal production could directly account for the changes we observed in cardiac activity 23-s before phee call production (Fig. 3A). That is, maybe the vocal production-related cardiac changes we observed are not related to arousal, per se, but are the consequence of respiratory sinus arrhythmia (RSA). RSA is a baroreceptor-driven activity arising from the interaction between the lungs, the nucleus of the solitary tract (NTS), and the heart. A signal is transmitted from the lungs via the vagus nerve to the NTS, where a reciprocal signal is sent back from the nucleus ambiguus to the heart, changing its dynamics (Stauss et al. 1997): inspiration (expiration) should increase (decrease) the heart rate. If respiration decreases, heart rate should increase, and vice versa. Considering this activity, the cardiorespiratory dynamics during vocal production could simply be the result of the baroreflex maintaining compensatory cardiac activity after the subject modifies its breathing to produce a vocalization. Figure 3B shows that this compensatory mechanism indeed occurs during vocal production, when respiration rate significantly (red-lined epochs) decreases while the heart rate increases. Moreover, at the offset of the vocalization, when the heart rate is decelerating, the respiration rate rebounds. However, not everything can be explained by this compensatory mechanism: For several seconds prior to the vocalization, when heart rate is increasing, there is no change in the respiration rate.
To explore the extent of the RSA contributions to the cardiorespiratory patterns observed around a vocalization event, we tested if heart rate could be linearly predicted from respiratory activity when a vocalization is produced. We first cross-correlated heart and respiratory rate signals (Fig. 3C). Next, we built linear predictors of heart rate from ongoing respiratory rate using both the positive and negative peak of correlation (Fig. 3C). We then created a 95% confidence region of predicted heart rate for the data aligned to call onset and call offset (Fig. 3D). When the median heart rate activity is compared with the predicted linear changes in heart rate activity, both the acceleration before vocal onset and the deceleration at vocal offset violated this prediction (exceeded a 95% confidence region). Therefore, during vocal production, respiratory rate fails to predict cardiac dynamics. These results suggest that cardiac-related interoceptive processes during vocal production cannot solely be predicted by the homeostatic interactions between the heart and lungs. Could another indicator of arousal account for the observed changes in heart rate?
The link between heart rate changes and vocal production is not wholly predicted by general increases in activity levels.
Across species, changes in general motor activity are considered to be a reliable indicator of arousal state (Garey et al. 2003; Pfaff 2006). Physical activity is positively correlated with changes in heart rate, whereby cardiac activity is higher during movement than quiescence (Obrist et al. 1970). To determine whether changes in motor activity could predict the changes in heart rate observed during phee call production, we calculated a motion index for each animal using video recorded during the experimental session (Fig. 4A). Figure 4B demonstrates the trace for the motion index 40 s before and after call onset. Red lines indicate epochs that were significantly different from baseline motor activity at the 5% significance level. Beginning 10 s before vocal onset, there is a gradual decrease in motor activity, with the cessation of movement reaching significance ∼3 s before call onset. Once the call occurs, activity resumes. We sought to determine whether we could predict the observed cardiac dynamics using a linear predictor analogous to the one we built for cardiorespiratory activity (Fig. 3, C and D). We constructed predictive regions of heart rate activity from the positive and negative peak of the cross correlation between motion and heart rate (Fig. 4C). Movement could predict the slow increase in cardiac activity but not the deceleration after call offset (Fig. 4D). This analysis demonstrates that the increase in heart rate can be predicted by motor activity occurring 6–8 s before the change in dynamics. Though predictive of heart rate dynamics before vocal onset, it is unclear whether the motor activity is causally related, as increases in cardiac activity during active movement typically occur instantaneously (within a cardiac cycle) (Obrist 1981; Smith et al. 1976).
Thus neither respiration nor motion can wholly predict the fluctuations in cardiac activity. How, then, do patterns of cardiorespiratory activity correspond the spontaneous production of vocalizations?
Periodic autonomic nervous system fluctuations and vocal production: the Mayer wave.
It is known that neural activity in the brain is modulated by rhythmic autonomic nervous system activity (Critchley and Harrison 2013) and that the timing (phase) of external events relative to these interoceptive rhythms influence many behaviors (Barrett and Simmons 2015). Such a relationship may exist between rhythmic autonomic nervous system activity and vocal production. We hypothesized that the drive to produce a vocalization, in the absence of a relevant and external conspecific signal, is phase-locked to rhythmic cardiorespiratory activity.
Figure 5A shows an exemplar of a one-syllable phee call from monkey 4 demonstrating a pronounced rhythmic oscillation in heart and respiratory rate. Figure 5B is the probability density of time between the onsets of consecutive vocalizations and shows that spontaneous vocal production is rhythmic in nature (Takahashi et al. 2013). Figure 5C shows an average power spectral density estimate of the period encompassing 40 s before a vocalization for heart rate (blue) and respiration rate (yellow). There is a peak frequency of 0.07 Hz for heart rate and 0.099 Hz for respiratory rate. These frequencies fall in the range of the Mayer wave, the resonant signature of the autonomic nervous system with a periodicity around 0.1 Hz (∼0.04–0.15 Hz) and present in every mammalian species studied to date (Julien 2006). Thus, in this context, the heart and respiratory rate rhythms are both products of the Mayer wave, the rhythmic activity of the sympathetic nervous system. We also observed a peak frequency of 0.145 Hz for phee call rate (Fig. 5C, gray). To determine whether there was a relationship between the observed Mayer wave and call production, we calculated the phase of respiration and heart rate relative to the onset of phee calls. Figure 5D reveals that the vocalization onset occurs after the peak of the Mayer wave, as measured by heart rate (blue, left), and just before the trough, as measured by respiratory rate (yellow, right). For both heart rate and respiration rate, these clusters around particular phases exceeded the bootstrapped 95% confidence interval (P < 0.001), and the concentrations of the clusters were also significant (Cramer-Von Mises test). The onset of a vocalization is thus preferentially located along a particular phase of the Mayer wave.
Fig. 5.

Vocalizations are phase-locked to the rhythm of the autonomic system. A: single exemplar of a 2-syllable vocalization The exemplar comprises the vocalization's spectrogram, the amplitude of the vocalization, the calculated heart rate, and the calculated respiratory rate. B: probability density showing the oscillatory nature of spontaneous phee call production. C: power spectrum density estimates for the call rate of marmoset vocal production (gray) and for the heart (blue) and respiratory rate (gold) preceding vocal onset. Shaded regions around averages represent 95% bootstrapped CIs. D: polar histograms of the phase location for the slow fluctuation in heart (left, blue) and respiratory rate (right, gold). Height corresponds to the percentage of values within the respective bin. Translucent histogram represents 95% bootstrapped significance level. At center, a schematic demonstrates the degree values against their respective locations on a schematic wave. E: a stochastic resonance model for how the Mayer wave influences spontaneous vocal production. The y-axis represents a neural activity.
Despite producing vocalizations in an oscillatory manner, marmosets do not produce a vocalization with every cycle of the Mayer wave. We hypothesize that this behavioral variability implies that the Mayer wave interacts with spontaneous vocal production in a manner similar to stochastic resonance (Fig. 5E). Under a model of stochastic resonance (Gammaitoni et al. 1998), vocal production occurs when a threshold is reached. The Mayer wave serves as a weak signal that, alone, is typically unable to reach the threshold and produce a call. If a source of noise adds to the weak signal, the threshold is breached and vocal production occurs. In this model, the noise is unidentified but could be one of the many processes that lead to a vocalization (see discussion).
A dynamical systems view of vocal production.
Since the autonomic nervous system is critical for maintaining homeostatic control in the mammalian body (Loewy and Spyer 1990), we sought to determine how the observed fluctuations in autonomic signals during vocal production correspond to baseline arousal state dynamics. To capture this baseline, we fit a separate multivariate Gaussian distribution to each pair of the bootstrapped data set from heart and respiratory rate variability used in Fig. 3, A and B, and from motor activity in Fig. 4B (Z-scored medians plotted in Fig. 6A). The circular regions in Fig. 6, B–D, encompass the 95% confidence interval for each distribution. Against this baseline region, we plotted in gray the trajectory for the median of each dynamic for the entire population. Traces of heart rate, respiration rate, and motor activity begin 25 s before call onset, continue for the duration of the call, and end 20 s after call onset. Figure 6 demonstrates the state space for the median arousal state for cardiorespiratory activity (Fig. 6B), cardiomotor activity (Fig. 6C), and respiratory-motor activity (Fig. 6D) around the production of a phee call. Green and red crosses denote the beginning and end of the trajectory, respectively, whereas the blue and black arrows signify call onset and the average call offset, respectively. The light blue line between the arrows delineates the call event. Surrounding the production of a phee call, we see numerous interactions between motor activity, heart rate, and respiratory rate. Cardiorespiratory activity oscillates at the edge of the 95% region of the state space, and ∼23 s before the call, the activity leaves the baseline region as heart rate increases, followed by a quick drop in respiratory rate ∼ 2 s before call onset. This occurs as motor activity is gradually diminishing. During the call, motor activity has reached its trough and the direction of the dynamic switches. The dynamic activity traverses across the state space, returning to the baseline.
Fig. 6.

Vocalizations are produced when perturbations of the system take the cardiorespiratory dynamics away from an attractor state. A: Z-scored signals for heart rate (blue), respiration rate (gold), and motor activity (red) from 40 s before call onset until 20 s after call onset. Shaded region indicates the average duration of a call. B–D: state spaces for the median cardiorespiratory activity reported in Fig. 3, A and B (B), cardiomotor activity reported in Figs. 3A and 4B (C), and respiratory motor activity reported in Figs. 3B and 4B (D). Each graph represents median activity from 25 s before call onset until 20 s after call onset. The circular region outlines the 95% confidence intervals for multivariate normal Gaussian distribution of the bootstrapped significance test for the relevant data from Figs. 3A, 3B, and 4B. Green and red crosses denote the beginning and end of the trajectory, respectively, whereas the blue and black arrows signify call onset and the average call offset, respectively. The direction of the arrow indicates the dynamic's direction, and the light blue line between the arrows delineates the call event.
We consider this baseline as an attractor. A vocalization is produced when the dynamics are driven far away from this attractor. Thus, during the moments preceding and following a phee call, the arousal state is driven well outside the expected range of its variability. These trajectories, therefore, depict how interoceptive processes can influence spontaneous vocal production and the extent to which a vocal event, the phee call, propels the state beyond its typical activity range.
DISCUSSION
We investigated the arousal dynamics related to the spontaneous, uncued vocal production in marmoset monkeys. We exploited the fact that this species readily produces a single type of contact call, the phee call, within the undirected context of social isolation. This call is produced with some regularity (once every 10 s or so) without the need for an external sensory trigger such as the presence of, or vocalization from, a conspecific. We show that heart rate influences the timing and probability of vocal production. Gradual increases in cardiac activity are observed roughly 23 s before the onset of vocal production, followed by a rapid and prolonged deceleration in heart rate of ∼8 s in duration. The timing of vocal productions was related to the phase of on-going fluctuations of cardiorespiratory activity. These fluctuations were on the order of 0.1 Hz and represented the Mayer wave, a well-established indicator of sympathetic nervous system activity (Julien 2006). It is important to note that the phee call is only one of several different calls produced by marmosets, but other types are heard in different contexts (Bezerra and Souto 2008); our pattern of results may not generalize to these other call types.
The changes in heart rate that bracket the production of phee calls by marmoset monkeys are similar to those observed during human speech. Humans also exhibit an increase in heart rate before speaking (Linden 1987; Lynch et al. 1980), even during signed communication by deaf individuals (Malinow et al. 1986). Interestingly, nonverbal utterances in humans do not fit this pattern. Mirthful laughter elicited during structured play does not demonstrate any difference in heart rate before or after a bout of laughter (Fry and Savin 1988). The cardiac and respiratory systems are highly intertwined such that the simple act of breathing air into the lungs temporarily blocks parasympathetic influence on the heart, increasing heart rate (Berntson et al. 1993). Conversely, exhaling restores parasympathetic influence on the heart, decreasing heart rate. This dynamic is known as respiratory sinus arrhythmia (RSA; Bernardi et al. 2001; Berntson et al. 1993), and there is a correlation between it and heart rate (Grossman and Taylor 2007). Since producing a vocalization requires changes in respiration, we tested whether the heart rate fluctuations before and after vocal production were simply due to the RSA and could thus be linearly predicted by ongoing respiration. We found, however, that respiration rate was insufficient in predicting both the increase in heart rate and its deceleration surrounding the call event.
Changes in heart rate before vocal onset were predicted by general motor activity of the animal; however, a causal relationship is not clear, because there was a 6- to 8-s delay between motor movement and heart rate increase. Considering that active movement typically induces near instantaneous changes in heart rate (Obrist 1981; Smith et al. 1976), it is unclear in the current study whether the motor activity is causally related to the heart rate changes we observed. The acceleration of heart rate and decrease in motor activity before vocal onset could be the result of anticipatory effort to produce a call. However, in human reaction time studies, there is an observed anticipatory deceleration in heart rate before task performance (Jennings et al. 1990; Obrist et al. 1969; Somsen et al. 2004). Functionally, a state of cardiac deceleration following the production of a contact call implies a state of reduced arousal. Thus calling in this manner may be as an act of self-soothing (Gracanin et al. 2014).
The oscillatory signature of the autonomic nervous system, the Mayer wave, is present in both cardiac and respiratory measures. The Mayer wave represents perturbations to the baroreflex (Julien 2006), resulting in an unstable negative feedback control loop that generates self-sustained oscillations at its resonance frequency. Most mammals exhibit a range of ∼0.04 to 0.15 Hz. We observed a 0.145-Hz frequency of vocal production across our marmoset subjects and demonstrated that vocal onset occurs at a preferred phase of the ongoing Mayer wave. Yet, a vocalization was not produced in every cycle of the Mayer wave, and this suggests a mechanism akin to stochastic resonance (Fig. 5E). Stochastic resonance requires three basic ingredients: 1) a threshold, 2) a weak coherent input such as a periodic signal, and 3) a source of noise that is inherent in the system (Gammaitoni et al. 1998). In our scenario, the Mayer wave is the periodic signal that, with the addition of as-yet undefined source(s) of input, leads to a breach in the decision threshold, producing a vocalization with some probability greater than zero. In scenarios involving more than one individual, the input signal would include the facial and/or vocal expressions of conspecifics (Ghazanfar and Takahashi 2014). Considering the relationship between vocal onset and the ongoing phase of the Mayer wave, an indirect consequence of this slow, pervasive autonomic oscillation is to assist in the assembly of vocal behavior. Indeed, vocal developmental data from marmosets suggests that the proper assembly of contact calling occurs postnatally, with an upward shift of the threshold (Zhang and Ghazanfar 2016). Infant marmosets in the undirected context produce vocalizations at almost 10 times the rate of adults, with a range of immature-sounding call types. After about a month, they slow the rate of call production and produce phee calls almost exclusively. The speed with which this transition from immature to mature phee calls takes place is influenced by contingent vocal feedback provided by parents (Takahashi et al. 2015, 2016).
We compiled the state space in which the combination of specific arousal states contribute to the production of a vocalization. The take-home message of that analysis, however, is not that arousal causes the production of a vocalization, per se, but that perturbations to the resting state space increase the likelihood of a call occurring. Such perturbations are in the context of many other “moving parts” of the system that are operating on different timescales. For example, hormone levels influence the production of vocalizations, and vice versa. Increased cortisol increases alarm calling in macaque monkeys (Bercovitch et al. 1995). Although there is no link between cortisol levels and the phee calls produced by marmosets in the undirected context (Norcross and Newman 1999), the production of vocalizations decreases cortisol levels in this species (Clara et al. 2008; Cross and Rogers 2006). Producing a vocalization is also metabolically costly, and energy levels are another factor that can influence vocal production (Ryan 1988). Moreover, simply hearing the call of another can send the cardiorespiratory state space into fluctuation (Berntson and Boysen 1989), and these changes in arousal level may influence the likelihood of a vocal response and the acoustic structure of this response (Choi et al. 2015; Takahashi et al. 2013). Thus the production of a vocalization is influenced by many factors: those occurring at slower timescales (e.g., hormones and energy levels) interacting with those occurring more quickly (e.g., sensory inputs, cardiorespiratory changes, neural activity).
In the undirected context studied here, the perturbations of resting arousal state were represented by three consecutive events: initial slow increase in heart rate, followed by the cessation of movement, which is then succeeded by a quick decrease in respiration rate. Each of these three events drives the dynamics of the arousal system far away from its baseline region, resulting in vocal production. In dynamical systems terminology, the baseline region is an attractor and the vocalization is produced when a perturbation takes the dynamics away from the attractor. In this scenario, we hypothesize that the vocalization is a homeostatic mechanism to return the arousal dynamics to the basin of attraction, and finally into the attractor region. Thus one could consider vocal production itself as a form of allostatic control (Berntson and Cacioppo 2007; McEwen and Wingfield 2003) or one parameter of a cybernetic system whereby compensatory actions (vocal production, in our case) offset the effects of disturbances (drifts away from the resting arousal state) (Pellis and Bell 2011).
The neural pathways for these putative interactions involving arousal and vocal production overlap to a surprising degree and provide a viable pathway by which arousal influences vocal production. At the cortical level, the interoceptive system consists of a network of areas along the medial wall of the cerebral cortex, from the cingulate cortex to the ventromedial prefrontal cortex, as well as laterally into the orbitofrontal cortex and insula (Barrett and Simmons 2015; Critchley and Harrison 2013). These visceromotor cortices generate autonomic, hormonal, and immunological predictions to adjust how the internal systems of the body deploy resources to deal with the external world in the immediate future (Barrett and Simmons 2015). Collectively, they project subcortically to the amygdala, ventral striatum, hypothalamus, and the periaqueductal grey (An et al. 1998; Barrett and Simmons 2015; Critchley and Harrison 2013). This network organization overlaps with those related to primate vocal communication. The pathway from the anterior cingulate cortex to periaqueductal gray is critical for vocal production (Jürgens 2009), and the insula contains a population of neurons that are exquisitely selective to conspecific vocalizations (Remedios et al. 2009). Subcortically, a key structure involved in regulating arousal (as measured by heart rate) is also critical for vocal production: the nucleus ambiguus of the reticular formation (Farkas et al. 1997; Jürgens 2009). Thus, on a neuroanatomical level, the neural systems governing vocal production are inextricably linked with the autonomic nervous system. Our immediate next steps are to link the cardiorespiratory dynamics described in the current study to the neurophysiology of vocal production.
GRANTS
This work was supported by National Science Foundation Graduate Research Fellowship Program DGE1148900 (to J. I. Borjon), a Pew Latin American Fellowship (to D. Y. Takahashi), and National Institute of Neurological Disorders and Stroke Grant R01NS054898 (to A. A. Ghazanfar).
DISCLOSURES
No conflicts of interest, financial or otherwise, are declared by the authors.
AUTHOR CONTRIBUTIONS
J.I.B., D.Y.T., and D.C.C. performed experiments; J.I.B. and D.Y.T. analyzed data; J.I.B., D.Y.T., and A.A.G. interpreted results of experiments; J.I.B. and A.A.G. prepared figures; J.I.B. and A.A.G. drafted manuscript; J.I.B., D.Y.T., and A.A.G. edited and revised manuscript; J.I.B., D.Y.T., D.C.C., and A.A.G. approved final version of manuscript; D.Y.T. and A.A.G. conception and design of research.
ACKNOWLEDGMENTS
We thank Lauren Kelly and Lydia Hoffstaetter for careful reading of this manuscript.
REFERENCES
- An X, Bandler R, Ongür D, Price JL. Prefrontal cortical projections to longitudinal columns in the midbrain periaqueductal gray in macaque monkeys. J Comp Neurol : 455–479, 1998. [PubMed] [Google Scholar]
- Barrett LF, Simmons WK. Interoceptive predictions in the brain. Nat Rev Neurosci : 419–429, 2015. [DOI] [PMC free article] [PubMed] [Google Scholar]
- Bastian A, Schmidt S. Affect cues in vocalizations of the bat, Megaderma lyra, during agonistic interactions. J Acoust Soc Am : 598–608, 2008. [DOI] [PubMed] [Google Scholar]
- Bercovitch FB, Hauser MD, Jones JH. The endocrine stress response and alarm vocalizations in rhesus macaques. Anim Behav : 1703–1706, 1995. [Google Scholar]
- Bernardi L, Porta C, Gabutti A, Spicuzza L, Sleight P. Modulatory effects of respiration. Auton Neurosci : 47–56, 2001. [DOI] [PubMed] [Google Scholar]
- Berntson GG, Boysen ST. Specificity of the cardiac response to conspecific vocalization in chimpanzees. Behav Neurosci : 235–245, 1989. [DOI] [PubMed] [Google Scholar]
- Berntson GG, Cacioppo JT. Integrative physiology: homeostasis, allostasis, and the orchestration of systemic physiology. In: Handbook of Psychophysiology, edited by Cacioppo JT, Tassinary LG, Berntson GG. New York: Cambridge University Press, 2007, p. 433–452. [Google Scholar]
- Berntson GG, Cacioppo JT, Quigley KS. Respiratory sinus arrhythmia: autonomic origins, physiological mechanisms, and psychophysiological implications. Psychophysiology : 183–196, 1993. [DOI] [PubMed] [Google Scholar]
- Bezerra BM, Souto A. Structure and usage of the vocal repertoire of Callithrix jacchus. Int J Primatol : 671–701, 2008. [Google Scholar]
- Blumstein DT, Armitage KB. Alarm calling in yellow-bellied marmots: I. The meaning of situationally variable alarm calls. Anim Behav : 143–171, 1997.9268444 [Google Scholar]
- Borjon JI, Ghazanfar AA. Convergent evolution of vocal cooperation without convergent evolution of brain size. Brain Behav Evol : 93–102, 2014. [DOI] [PMC free article] [PubMed] [Google Scholar]
- Briefer EF, Maigrot AL, Mandel R, Freymond SB, Bachmann I, Hillmann E. Segregation of information about emotional arousal and valence in horse whinnies. Sci Rep : 9989, 2015. [DOI] [PMC free article] [PubMed] [Google Scholar]
- Cacioppo JT, Uchino BN, Berntson GG. Individual differences in the autonomic origins of heart rate reactivity: the psychometrics of respiratory sinus arrhythmia and preejection period. Psychophysiology : 412–419, 1994. [DOI] [PubMed] [Google Scholar]
- Cheney DL, Seyfarth RM. Reconciliatory grunts by dominant female baboons influence victims' behaviour. Anim Behav : 409–418, 1997. [DOI] [PubMed] [Google Scholar]
- Choi JY, Takahashi DY, Ghazanfar AA. Cooperative vocal control in marmoset monkeys via vocal feedback. J Neurophysiol : 274–283, 2015. [DOI] [PMC free article] [PubMed] [Google Scholar]
- Clara E, Tommasi L, Rogers LJ. Social mobbing calls in common marmosets (Callithrix jacchus): effects of experience and associated cortisol levels. Anim Cogn : 349–358, 2008. [DOI] [PubMed] [Google Scholar]
- Coudé G, Ferrari PF, Rodà F, Maranesi M, Borelli E, Veroni V, Monti F, Rozzi S, Fogassi L. Neurons controlling voluntary vocalization in the macaque ventral premotor cortex. PLoS One : e26822–e26822, 2011. [DOI] [PMC free article] [PubMed] [Google Scholar]
- Critchley HD, Harrison NA. Visceral influences on brain and behavior. Neuron : 624–638, 2013. [DOI] [PubMed] [Google Scholar]
- Cross N, Rogers LJ. Mobbing vocalizations as a coping response in the common marmoset. Horm Behav : 237–245, 2006. [DOI] [PubMed] [Google Scholar]
- Farkas E, Jansen ASP, Loewy AD. Periaqueductal gray matter projection to vagal preganglionic neurons and the nucleus tractus solitarius. Brain Res : 257–261, 1997. [DOI] [PubMed] [Google Scholar]
- Fischer J, Hammerschmidt K, Cheney DL, Seyfarth RM. Acoustic features of female chacma baboon barks. Ethology : 33–54, 2001. [Google Scholar]
- Fitch WT, Hauser MD. Vocal production in nonhuman-primates - acoustics, physiology, and functional constraints on honest advertisement. Am J Primatol : 191–219, 1995. [DOI] [PubMed] [Google Scholar]
- Fry WF, Savin WM. Mirthful laughter and blood pressure. Humor : 49–62, 1988. [Google Scholar]
- Gammaitoni L, Hänggi P, Jung P, Marchesoni F. Stochastic resonance. Rev Mod Phys : 223–287, 1998. [Google Scholar]
- Garey J, Goodwillie A, Frohlich J, Morgan M, Gustafsson JA, Smithies O, Korach KS, Ogawa S, Pfaff DW. Genetic contributions to generalized arousal of brain and behavior. Proc Natl Acad Sci USA : 11019–11022, 2003. [DOI] [PMC free article] [PubMed] [Google Scholar]
- Ghazanfar AA, Flombaum JI, Miller CT, Hauser MD. The units of perception in the antiphonal calling behavior of cotton-top tamarins (Saguinus oedipus): playback experiments with long calls. J Comp Physiol A : 27–35, 2001. [DOI] [PubMed] [Google Scholar]
- Ghazanfar AA, Rendall D. Evolution of human vocal production. Curr Biol : R457–R460, 2008. [DOI] [PubMed] [Google Scholar]
- Ghazanfar AA, Takahashi DY. The evolution of speech: vision, rhythm, cooperation. Trends Cogn Sci : 543–553, 2014. [DOI] [PMC free article] [PubMed] [Google Scholar]
- Gothard KM. The amygdalo-motor pathways and the control of facial expressions. Front Neurosci : 43–43, 2014. [DOI] [PMC free article] [PubMed] [Google Scholar]
- Gracanin A, Bylsma LM, Vingerhoets JJ. Is crying a self-soothing behavior? Front Psychol : 502, 2014. [DOI] [PMC free article] [PubMed] [Google Scholar]
- Gray MA, Beacher FD, Minati L, Nagai Y, Kemp AH, Harrison NA, Critchley HD. Emotional appraisal is influenced by cardiac afferent information. Emotion : 180–191, 2012. [DOI] [PubMed] [Google Scholar]
- Grossman P, Taylor EW. Toward understanding respiratory sinus arrhythmia: relations to cardiac vagal tone, evolution and biobehavioral functions. Biol Psychol : 263–285, 2007. [DOI] [PubMed] [Google Scholar]
- Hage SR, Gavrilov N, Nieder A. Cognitive control of distinct vocalizations in rhesus monkeys. J Cogn Neurosci : 1692–1701, 2013. [DOI] [PubMed] [Google Scholar]
- Hage SR, Nieder A. Single neurons in monkey prefrontal cortex encode volitional initiation of vocalizations. Nat Commun : 2409–2409, 2013. [DOI] [PubMed] [Google Scholar]
- Hammerschmidt K, Fischer J. Constraints in primate vocal production. In: The Evolution of Communicative Creativity: From Fixed Signals to Contextual Flexibility, edited by Griebel U, Oller K. Cambridge, MA: MIT Press, 2008, p. 93–119. [Google Scholar]
- Jennings JR, van der Molen MW, Somsen RJ, Terezis C. On the shift from anticipatory heart rate deceleration to acceleratory recovery: revisiting the role of response factors. Psychophysiology : 385–395, 1990. [DOI] [PubMed] [Google Scholar]
- Julien C. The enigma of Mayer waves: facts and models. Cardiovasc Res : 12–21, 2006. [DOI] [PubMed] [Google Scholar]
- Jürgens U. The neural control of vocalization in mammals: a review. J Voice : 1–10, 2009. [DOI] [PubMed] [Google Scholar]
- Kitchen DM, Cheney DL, Seyfarth RM. Male chacma baboons (Papio cynocephalus ursinus) discriminate loud call contests between rivals of different relative ranks. Anim Cogn : 1–6, 2005. [DOI] [PubMed] [Google Scholar]
- Kulahci IG, Rubenstein DI, Ghazanfar AA. Lemurs groom-at-a-distance through vocal networks. Anim Behav : 179–186, 2015. [Google Scholar]
- Linden W. A microanalysis of autonomic activity during human speech. Psychosom Med : 562–578, 1987. [DOI] [PubMed] [Google Scholar]
- Loewy AD, Spyer KM. Central Regulation of Autonomic Functions. New York: Oxford University Press, 1990. [Google Scholar]
- Lynch JJ, Thomas SA, Long JM, Malinow KL, Chickadonz G, Katcher AH. Human speech and blood pressure. J Nerv Ment Dis : 526–534, 1980. [DOI] [PubMed] [Google Scholar]
- Malinow KL, Lynch JJ, Foreman PJ, Friedmann E, Thomas SA. Blood pressure increases while signing in a deaf population. Psychosom Med : 95–101, 1986. [DOI] [PubMed] [Google Scholar]
- Manser M. The acoustic structure of suricates' alarm calls varies with predator type and the level of response urgency. Proc Biol Sci : 2315–2324, 2001. [DOI] [PMC free article] [PubMed] [Google Scholar]
- McEwen BS, Wingfield JC. The concept of allostasis in biology and biomedicine. Horm Behav : 2–15, 2003. [DOI] [PubMed] [Google Scholar]
- Miller CT, Thomas AW. Individual recognition during bouts of antiphonal calling in common marmosets. J Comp Physiol A : 337–346, 2012. [DOI] [PMC free article] [PubMed] [Google Scholar]
- Norcross JL, Newman JD. Effects of separation and novelty on distress vocalizations and cortisol in the common marmoset (Callithrix jacchus). Am J Primatol : 209–222, 1999. [DOI] [PubMed] [Google Scholar]
- Obrist PA. Cardiovascular Psychophysiology: A Perspective. New York: Plenum, 1981. [Google Scholar]
- Obrist PA, Webb RA, Sutterer JR. Heart rate and somatic changes during aversive conditioning and a simple reaction time task. Psychophysiology : 696–723, 1969 [DOI] [PubMed] [Google Scholar]
- Obrist PA, Webb RA, Sutterer JR, Howard JL. The cardiac-somatic relationship: some reformulations. Psychophysiology : 569–587, 1970 [DOI] [PubMed] [Google Scholar]
- Owings DH, Virginia RA. Alarm calls of California ground squirrels (Spermophilus beecheyi). Z Tierpsychol : 58–70, 1978 [Google Scholar]
- Owren MJ, Amoss RT, Rendall D. Two organizing principles of vocal production: Implications for nonhuman and human primates. Am J Primatol : 530–544, 2011 [DOI] [PubMed] [Google Scholar]
- Pellis SM, Bell HC. Closing the circle between perceptions and behavior: a cybernetic view of behavior and its consequences for studying motivation and development. Dev Cogn Neurosci : 404–413, 2011. [DOI] [PMC free article] [PubMed] [Google Scholar]
- Pfaff D. Brain Arousal and Information Theory. Cambridge, MA: Harvard University Press, 2006. [Google Scholar]
- Remedios R, Logothetis NK, Kayser C. An auditory region in the primate insular cortex responding preferentially to vocal communication sounds. J Neurosci : 1034–1045, 2009. [DOI] [PMC free article] [PubMed] [Google Scholar]
- Rendall D. Acoustic correlates of caller identity and affect intensity in the vowel-like grunt vocalizations of baboons. J Acoust Soc Am : 3390–3402, 2003 [DOI] [PubMed] [Google Scholar]
- Rendall D, Owren MJ. Vocalizations as tools for influencing the affect and behavior of others In: Handbook of Mammalian Vocalization: An Integrative Neuroscience Approach, edited by Brudzynski S. New York: Academic, 2009, p. 177–185. [Google Scholar]
- Ryan MJ. Energy, calling, and selection. Integr Comp Biol : 885–898, 1988. [Google Scholar]
- Schehka S, Esser KH, Zimmermann E. Acoustical expression of arousal in conflict situations in tree shrews (Tupaia belangeri). J Comp Physiol A Neuroethol Sens Neural Behav Physiol : 845–852, 2007 [DOI] [PubMed] [Google Scholar]
- Scheumann M, Roser AE, Konerding W, Bliech E, Hedrich HJ, Zimmermann E. Vocal correlates of sender-identity and arousal in the isolation calls of domestic kitten (Felis sylvestris catus). Front Zool : 36, 2012. [DOI] [PMC free article] [PubMed] [Google Scholar]
- Schnell CR, Wood JM. Measurement of blood pressure and heart rate by telemetry in conscious, unrestrained marmosets. Am J Physiol Heart Circ Physiol : H1509–H1516, 1993. [DOI] [PubMed] [Google Scholar]
- Seyfarth RM, Cheney DL. Signalers and receivers in animal communication. Annu Rev Psychol : 145–173, 2003. [DOI] [PubMed] [Google Scholar]
- Seyfarth RM, Cheney DL, Marler P. Vervet monkey alarm calls: semantic communication in a free-ranging primate. Anim Behav : 1070–1094, 1980. [Google Scholar]
- Shimazaki H, Shinomoto S. Kernel bandwidth optimization in spike rate estimation. J Comput Neurosci : 171–182, 2010. [DOI] [PMC free article] [PubMed] [Google Scholar]
- Smith EE, Guyton AC, Manning RD, White RJ. Integrated mechanisms of cardiovascular response and control during exercise in the normal human. Prog Cardiovasc Dis : 421–444, 1976. [DOI] [PubMed] [Google Scholar]
- Somsen RJM, Jennings JR, Van der Molen MW. The cardiac cycle time effect revisited: temporal dynamics of the central-vagal modulation of heart rate in human reaction time tasks. Psychophysiology : 941–953, 2004. [DOI] [PubMed] [Google Scholar]
- Stauss HM, Persson PB, Johnson AK, Kregel KC. Frequency-response characteristics of autonomic nervous system function in conscious rats. Am J Physiol Heart Circ Physiol : H786–H795, 1997. [DOI] [PubMed] [Google Scholar]
- Takahashi DY, Fenley AR, Ghazanfar AA. Early development of turn-taking with parents shapes vocal acoustics in infant marmoset monkeys Philos Trans R Soc Lond B Biol Sci : 20150370, 2016. [DOI] [PMC free article] [PubMed] [Google Scholar]
- Takahashi DY, Fenley AR, Teramoto Y, Narayanan DZ, Borjon JI, Holmes P, Ghazanfar AA. The developmental dynamics of marmoset monkey vocal production. Science : 734–738, 2015. [DOI] [PubMed] [Google Scholar]
- Takahashi DY, Narayanan DZ, Ghazanfar AA. Coupled oscillator dynamics of vocal turn-taking in monkeys. Curr Biol : 2162–2168, 2013. [DOI] [PubMed] [Google Scholar]
- Zhang YS, Ghazanfar AA. Perinatally influenced autonomic nervous system fluctuations drive infant vocal sequences. Curr Biol : 1249-12-60, 2016. [DOI] [PubMed] [Google Scholar]