

Abstract
Administrative claims data from a commercial insurance database were analyzed to evaluate differences in rates of outpatient office visits during the year after completion of 4 chemotherapy regimens for early stage breast cancer. Combined anthracycline/taxane was associated with more frequent office visits than docetaxel-cyclophosphamide or doxorubicin-cyclophosphamide, possibly because of greater long-term toxicities. Primary care visits were infrequent.
Background:
Treatment-related toxicity can vary substantially between chemotherapy regimens. In this study we evaluated the frequency of outpatient office visits among a cohort of early stage breast cancer survivors after completion of 4 different adjuvant chemotherapy regimens to better understand how differences in toxicities between regimens might affect health care use.
Materials and Methods:
We analyzed administrative claims data from a US commercial insurance database (OptumLabs) to identify women who received adjuvant doxorubicin/cyclophosphamide (AC), AC followed or preceded by docetaxel or paclitaxel (AC-T), AC concurrent with docetaxel or paclitaxel (TAC), or docetaxel/cyclophosphamide (TC) between 2008 and 2014. We compared mean numbers of visits per patient (adjusted for age, race/ethnicity, region, year, surgery type, radiation, chronic conditions, and previous hospitalizations) across the different regimens (TC = reference) for 12 months, starting 4 months after the end of chemotherapy.
Results:
In 6247 eligible patients, the mean adjusted number of outpatient visits per patient was significantly higher in patients who received AC-T (8.1) or TAC (7.3) than TC (6.5) or AC (6.0; P < .001 for comparisons of AC-T and TAC with TC), primarily because of differences in Medical Oncology visits. Approximately 40% did not see a primary care provider at all during this time frame.
Conclusions:
AC-T and TAC are associated with more subsequent outpatient visits than TC. Visits to primary care providers are infrequent during the year after completion of chemotherapy.
Keywords: Breast neoplasms, Follow-up, Health care use, Outpatient, Toxicity
Introduction
Breast cancer is the most prevalent cancer among women, with an estimated 252,710 new cases in 2017 and more than 3.3 million breast cancer survivors currently in the United States.1 Early stage breast cancer is treated with surgical resection with or without radiation therapy, chemotherapy, and/or endocrine therapy in an effort to reduce the risk of cancer recurrence. Eighty percent of breast cancers do not overexpress HER2/neu, a critical determinant of optimal systemic therapy. There are multiple chemotherapy regimens available for adjuvant treatment of HER2/neu-negative breast cancer, and preferred regimens vary according to geographic region, institution, and individual provider. Treatment-related complications can differ among these regimens, which might potentially affect health care use and quality of life during treatment and afterward.
Previous studies have assessed hospitalization rates during and immediately after chemotherapy as a surrogate for treatment-related toxicity.2–4 Barcenas et al4 reported significantly higher rates of hospitalization in early stage breast cancer patients who received anthracycline-based chemotherapy than in those who received docetaxel/cyclophosphamide (TC), suggesting that TC carries less risk of acute severe toxicity. Similarly, in already-published work, our group reported higher adjusted rates of hospitalizations during the chemotherapy administration period among early stage breast cancer patients who received anthracycline-based chemotherapy compared with those who received TC.5 There were no observed differences in emergency department visit frequency between these regimens. Outpatient visit frequency has been less well studied as a surrogate for toxicity, but Baena-Canada et al6 included these types of visits in a composite end point of health care use during chemotherapy for breast cancer. These authors found that, among a small cohort (n = 268) of breast cancer patients who received chemotherapy, nearly half required additional and unexpected health care visits (either in an outpatient clinic, emergency department, or hospital) and that many visits resulted from treatment-related toxicity.
Guidelines from the National Comprehensive Cancer Network recommend that patients be seen in follow-up for early stage breast cancer 1 to 4 times during the year after completion of chemotherapy and radiotherapy.7 Data from a large Surveillance, Epidemiology, and End Results (SEER)-Medicare analysis of patients with early stage breast cancer older than age 65 showed that there is substantial variability in the types of providers participating in follow-up care of these patients, and that most patients (93%) continued to have routine follow-ups with their primary care providers during this period.8 We aimed to investigate patterns of care in a mixed-age population and to compare recipients of different standard chemotherapies to expand upon this previous work.
Harnessing the data from a large US insurance claims database, we compared the outpatient health care use between recipients of 4 common adjuvant chemotherapy regimens during the year after chemotherapy completion among a cohort of early stage, HER2/neu-negative breast cancer patients. Our hypothesis was that differences in long-term toxicities between regimens might affect health care use even after treatment completion.
Materials and Methods
We used administrative claims data from OptumLabs Data Warehouse9 to conduct a retrospective analysis of outpatient office visits among a cohort of breast cancer survivors beginning 4 months after completion of adjuvant chemotherapy and continuing for 1 year. This database includes over 100 million privately insured and Medicare Advantage enrollees throughout the United States and contains professional, facility, and outpatient medication claims for individuals enrolled in the included health plans.10 This analysis was exempt from Mayo Clinic Institutional Review Board approval because this study used a preexisting, deidentified data set.9
Patient Population
Women older than the age of 18 years with curatively treated breast cancer diagnosed between January 1, 2008 and December 31, 2014 were identified using a technique adapted from previous validated claims-based algorithms (Figure 1).11,12 Women with a diagnosis of breast cancer who underwent axillary lymph node dissection, lumpectomy, or mastectomy (unilateral or bilateral) between January 1, 2008 and December 31, 2014 were identified using International Classification of Diseases, Ninth Revision (ICD-9) and Current Procedural Terminology codes (n = 277,386). Of those women, those who received ≥1 cycle of doxorubicin/cyclophosphamide (AC), TC, AC followed or preceded by docetaxel or paclitaxel (AC-T), or AC concurrent with docetaxel or paclitaxel (TAC), within 12 months after their breast cancer surgery date, were included in this analysis (n = 35,246). Patients who received doxorubicin, cyclophosphamide, docetaxel, or paclitaxel during the 12 months before breast surgery were excluded to avoid including those with locally advanced disease that required neoadjuvant treatment, in an effort to assess a relatively homogeneous population. Chemotherapy drug administration was identified using Healthcare Common Procedure Coding System (HCPCS) codes to identify chemotherapy regimens. Patients who underwent a subsequent lumpectomy, mastectomy, or axillary lymph node dissection within 24 months of initiation of chemotherapy were excluded so that patients with local recurrences were excluded (n = 31,082). Those with other cancer diagnoses or a metastatic breast cancer diagnosis (ICD-9 codes: 140.0–172.9, 176.0–195.8, 200.00–208.92, 238.6, 196.1, 196.2, 196.4, 196.9, 197.0, 197.3, 197.4, 197.6, 197.7, 197.8, 198.0, 198.2, 198.3, 198.4, 198.5, 198.6, 198.7, 198.82, 198.89, 199.0, 209.11, 209.20, 209.30, 237.5, and 239.6) within 12 months before or 24 months after chemotherapy initiation were also excluded (n = 21,196). Patients who received only 1 cycle of chemotherapy and those who received trastuzumab and/or other chemotherapy regimens during the 24 months after initiation of chemotherapy were excluded (n = 7163). Continuous medical coverage was required for 12-months before and 16 months after completion of chemotherapy (n = 916 excluded). In an effort to minimize capturing office visits for completion of radiation therapy, we started our year of follow-up 4 months after the last date of chemotherapy.
Figure 1.
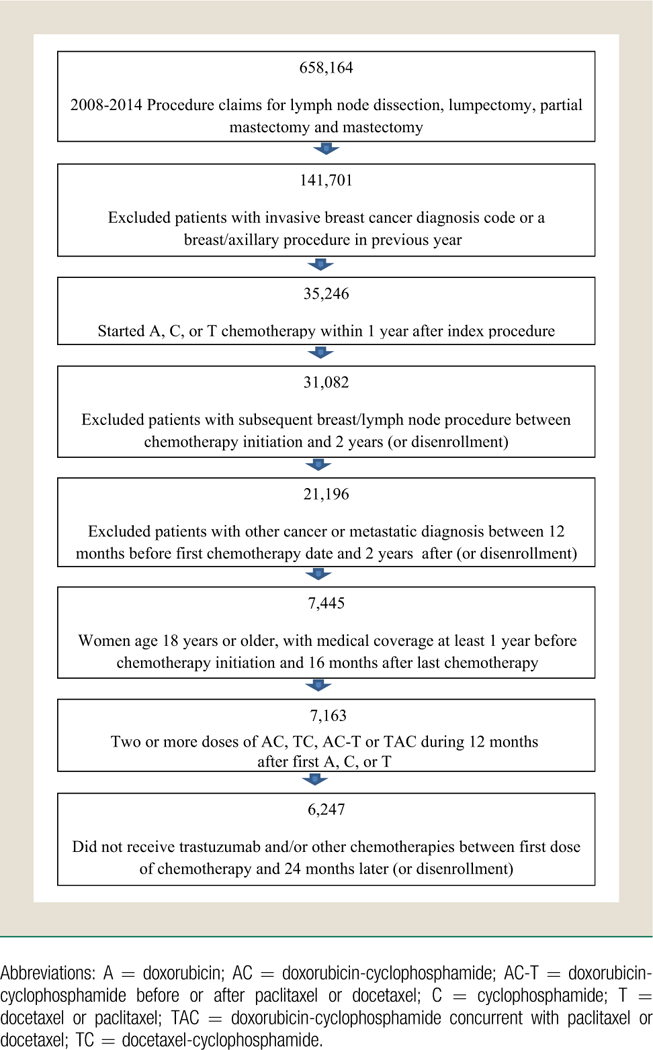
Cohort Flow Diagram
Outcome of Interest
The primary outcome of this analysis was the number of outpatient office visits, including visits in Family Medicine/Internal Medicine (primary care), Medical Oncology, and others (including surgical providers, radiation oncology, psychiatry, physical medicine and rehabilitation, gynecology, etc) during the 1-year period starting 4 months after the final dose of chemotherapy. Office visits were identified by restricting data to claims for which the place of service was reported as “office” and the HCPCS code was reported as either between 99,201 and 99,205 (new patients), or between 99,211 and 99,215 (established patients), or between 99,241 and 99,245 (office consultations). If patients had multiple visits on the same day to a given specialty, all were counted as 1 visit. Reasons for office visits were identified using ICD-9 codes and categorized according to the Agency for Healthcare Research and Quality’s Clinical Classifications Software.
Control Variables
Patient demographic characteristics including age at diagnosis, race/ethnicity, year of chemotherapy initiation, geographic region, insurance type (commercial, Medicare Advantage), type of definitive surgery (lumpectomy, mastectomy, or lymph node dissection alone), reconstructive surgery (yes/no), hospitalization (yes/no) within 12 months before initiation of chemotherapy (not including breast cancer surgery), radiation therapy (yes/no) within 12 months of chemotherapy initiation, and number of comorbid conditions. Comorbid conditions were identified using ICD-9 codes during the 12 months preceding chemotherapy initiation and the total sum of comorbid conditions was grouped according to 0, 1, 2, 3, 4, or ≥5 conditions. This method has been used previously by Magnan,13 which was adapted from a method previously reported by Hwang et al.14
Statistical Analysis
Negative binomial regression models were used to calculate the average number of office visits per patient during the 12-month follow-up period. These visit numbers were adjusted for age, race/ethnicity, region, year of chemotherapy initiation, surgery type, number of comorbid conditions,13,14 receipt of radiotherapy (within 12 months of chemotherapy initiation), and previous hospitalization. A Sidak correction for multiple comparisons was used such that P < .007 was considered statistically significant. Because reconstructive surgery was generally limited to those with mastectomy and some reconstructions occurred after the visits of interest, we performed a sensitivity analysis that focused only on patients who did not undergo reconstruction. All statistical analyses were performed using SAS software version 9.4 (SAS Institute Inc, Cary, NC) and Stata/MP version 14.2 (StataCorp, College Station, TX).
Results
A total of 6247 women were included in this analysis, with a mean age of 54 (range, 25–87) years at the time of chemotherapy initiation. Of the included patients, 248 received AC, 2123 received AC-T, 430 received TAC, and 3446 received TC. Table 1 shows demographic and clinical details, and distributions of office visits according to regimen are shown in Table 2.
Table 1.
Patient Characteristics (n, %) According to Adjuvant Chemotherapy Regimen
| AC (n = 248) |
AC-T (n = 2123) |
TAC (n = 430) |
TC (n = 3446) |
Total (n = 6247) |
|
|---|---|---|---|---|---|
| Patient Characteristics | |||||
| Age, Years | |||||
| Mean (SD) | 54.0 (9.6) | 52.6 (9.3) | 50.7 (8.9) | 55.2 (9.4) | 53.9 (9.5) |
| Median | 54 | 53 | 50 | 55 | 54 |
| Q1, Q3 | 47.5 60.0 | 46.0 59.0 | 44.0 57.0 | 48.0 61.0 | 47.0 60.0 |
| Range | 31.0–83.0 | 26.0–81.0 | 25.0–82.0 | 27.0–87.0 | 25.0–87.0 |
| Age Group, Years | |||||
| 18–35 | 4 (1.6) | 58 (2.7) | 11 (2.6) | 31 (0.9) | 104 (1.7) |
| 35–54 | 121 (48.8) | 1164 (54.8) | 274 (63.7) | 1582 (45.9) | 3141 (50.3) |
| 55–64 | 95 (38.3) | 705 (33.2) | 121 (28.1) | 1340 (38.9) | 2261 (36.2) |
| 65 and older | 28 (11.3) | 196 (9.2) | 24 (5.6) | 493 (14.3) | 741 (11.9) |
| Year of Chemotherapy Initiation | |||||
| 2008 | 66 (26.6) | 262 (12.3) | 81 (18.8) | 451 (13.1) | 860 (13.8) |
| 2009 | 49 (19.8) | 342 (16.1) | 88 (20.5) | 510 (14.8) | 989 (15.8) |
| 2010 | 33 (13.3) | 308 (14.5) | 73 (17.0) | 531 (15.4) | 945 (15.1) |
| 2011 | 40 (16.1) | 325 (15.3) | 78 (18.1) | 611 (17.7) | 1054 (16.9) |
| 2012 | 24 (9.7) | 362 (17.1) | 60 (14.0) | 564 (16.4) | 1010 (16.2) |
| 2013 | 19 (7.7) | 351 (16.5) | 31 (7.2) | 491 (14.2) | 892 (14.3) |
| 2014 | 17 (6.9) | 173 (8.1) | 19 (4.4) | 288 (8.4) | 497 (8.0) |
| Geographic Region | |||||
| Midwest | 90 (36.3) | 655 (30.9) | 76 (17.7) | 976 (28.3) | 1797 (28.8) |
| Northeast | 33 (13.3) | 293 (13.8) | 19 (4.4) | 336 (9.8) | 681 (10.9) |
| South | 92 (37.1) | 889 (41.9) | 264 (61.4) | 1559 (45.2) | 2804 (44.9) |
| West | 33 (13.3) | 286 (13.5) | 71 (16.5) | 575 (16.7) | 965 (15.4) |
| Race/Ethnicity | |||||
| Asian | 8 (3.2) | 48 (2.3) | 13 (3.0) | 59 (1.7) | 128 (2.0) |
| Black | 16 (6.5) | 166 (7.8) | 45 (10.5) | 299 (8.7) | 526 (8.4) |
| Hispanic | 10 (4.0) | 105 (4.9) | 27 (6.3) | 154 (4.5) | 296 (4.7) |
| Unknown | 77 (31.0) | 688 (32.4) | 124 (28.8) | 1005 (29.2) | 1894 (30.3) |
| White non-Hispanic | 137 (55.2) | 1116 (52.6) | 221 (51.4) | 1929 (56.0) | 3403 (54.5) |
| Insurance Type | |||||
| Commercial | 221 (89.1) | 1956 (92.1) | 409 (95.1) | 3022 (87.7) | 5608 (89.8) |
| Medicare Advantage | 27 (10.9) | 167 (7.9) | 21 (4.9) | 424 (12.3) | 639 (10.2) |
| Surgery Type | |||||
| Lumpectomy | 137 (55.2) | 954 (44.9) | 181 (42.1) | 1959 (56.8) | 3231 (51.7) |
| Mastectomy | 110 (44.4) | 1159 (54.6) | 247 (57.4) | 1479 (42.9) | 2995 (47.9) |
| Lymph node dissectiona | 1 (0.4) | 10 (0.5) | 2 (0.5) | 8 (0.2) | 21 (0.3) |
|
Reconstruction Within 12 Months After Chemotherapy Initiation |
|||||
| No | 191 (77.0) | 1652 (77.8) | 307 (71.4) | 2737 (79.4) | 4887 (78.2) |
| Yes | 57 (23.0) | 471 (22.2) | 123 (28.6) | 709 (20.6) | 1360 (21.8) |
|
Radiation Within 12 Months After Start of Chemotherapy |
|||||
| No | 110 (44.4) | 632 (29.8) | 135 (31.4) | 1486 (43.1) | 2363 (37.8) |
| Yes | 138 (55.6) | 1491 (70.2) | 295 (68.6) | 1960 (56.9) | 3884 (62.2) |
|
Hospitalization Within 12 Months Before Start of Chemotherapy |
|||||
| No | 230 (92.7) | 1992 (93.8) | 403 (93.7) | 3221 (93.5) | 5846 (93.6) |
| Yes | 18 (7.3) | 131 (6.2) | 27 (6.3) | 225 (6.5) | 401 (6.4) |
|
Number of Chronic Conditions Per Patientb |
|||||
| Mean (SD) | 4.1 (2.9) | 4.0 (2.8) | 3.9 (2.6) | 4.2 (2.9) | 4.1 (2.9) |
| Median | 4 | 4 | 3 | 4 | 4 |
| Q1, Q3 | 2.0 6.0 | 2.0 6.0 | 2.0 6.0 | 2.0 6.0 | 2.0 6.0 |
| Range | 0.0–14.0 | 0.0–20.0 | 0.0–13.0 | 0.0–20.0 | 0.0–20.0 |
|
Number of Chronic Conditions Per Patientb |
|||||
| 0 | 16 (6.5) | 135 (6.4) | 34 (7.9) | 244 (7.1) | 429 (6.9) |
| 1 | 32 (12.9) | 280 (13.2) | 40 (9.3) | 390 (11.3) | 742 (11.9) |
| 2 | 38 (15.3) | 282 (13.3) | 64 (14.9) | 487 (14.1) | 871 (13.9) |
| 3 | 30 (12.1) | 318 (15.0) | 78 (18.1) | 490 (14.2) | 916 (14.7) |
| 4 | 38 (15.3) | 322 (15.2) | 53 (12.3) | 451 (13.1) | 864 (13.8) |
| 5 or more | 94 (37.9) | 786 (37.0) | 161 (37.4) | 1384 (40.2) | 2425 (38.8) |
Data are presented as n (%) except where otherwise noted.
Abbreviations: AC = doxorubicin-cyclophosphamide; AC-T = doxorubicin-cyclophosphamide before or after paclitaxel or docetaxel; Q1, Q3 = first quartile, third quartile; TAC = doxorubicin-cyclophosphamide concurrent with paclitaxel or docetaxel; TC = docetaxel-cyclophosphamide.
Lymph node dissection only (without breast surgery). Those with lymph node dissection in addition to breast surgery were characterized according to their type of definitive breast surgery.
Numbers of chronic conditions per patient are on the basis of the Agency for Healthcare Research and Quality’s Clinical Classification Software.
Table 2.
Office Visits According to Adjuvant Chemotherapy Regimen Over a Year of Follow-upa
| AC (n = 248) |
AC-T (n = 2123) |
TAC (n = 430) |
TC (n = 3446) |
Total (n = 6247) |
|
|---|---|---|---|---|---|
|
Overall: Number of Office Visits Per Patient |
|||||
| Mean (SD) | 6.0 (4.5) | 8.3 (5.0) | 7.8 (4.8) | 6.7 (4.5) | 7.3 (4.8) |
| Median | 5 | 7 | 7 | 6 | 6 |
| Q1, Q3 | 3.0 8.0 | 5.0 11.0 | 5.0, 10.0 | 4.0, 9.0 | 4.0, 10.0 |
| Range | 0.0–28.0 | 0.0–36.0 | 0.0–29.0 | 0.0–58.0 | 0.0–58.0 |
| Overall: Proportion With Visits | |||||
| 0 visits | 14 (5.6) | 22 (1.0) | 4 (0.9) | 83 (2.4) | 123 (2.0) |
| 1 visit | 17 (6.9) | 60 (2.8) | 12 (2.8) | 141 (4.1) | 230 (3.7) |
| 2 visits | 24 (9.7) | 94 (4.4) | 20 (4.7) | 268 (7.8) | 406 (6.5) |
| 3 visits | 21 (8.5) | 116 (5.5) | 32 (7.4) | 313 (9.1) | 482 (7.7) |
| 4 visits | 28 (11.3) | 169 (8.0) | 39 (9.1) | 385 (11.2) | 621 (9.9) |
| 5 or more visits | 144 (58.1) | 1662 (78.3) | 323 (75.1) | 2256 (65.5) | 4385 (70.2) |
|
Medical Oncology: Number of Office Visits Per Patient |
|||||
| Mean (SD) | 2.4 (2.2) | 4.0 (3.0) | 3.5 (2.5) | 2.5 (2.0) | 3.1 (2.5) |
| Median | 2 | 4 | 3 | 2 | 3 |
| Q1, Q3 | 0.0, 4.0 | 2.0, 5.0 | 2.0, 5.0 | 1.0, 4.0 | 1.0, 4.0 |
| Range | 0.0–12.0 | 0.0–27.0 | 0.0–13.0 | 0.0–18.0 | 0.0–27.0 |
|
Medical Oncology: Proportion With Visits |
|||||
| 0 visits | 68 (27.4) | 228 (10.7) | 44 (10.2) | 662 (19.2) | 1002 (16.0) |
| 1 visit | 30 (12.1) | 240 (11.3) | 62 (14.4) | 548 (15.9) | 880 (14.1) |
| 2 visits | 44 (17.7) | 249 (11.7) | 55 (12.8) | 635 (18.4) | 983 (15.7) |
| 3 visits | 36 (14.5) | 307 (14.5) | 69 (16.0) | 633 (18.4) | 1045 (16.7) |
| 4 visits | 28 (11.3) | 310 (14.6) | 80 (18.6) | 479 (13.9) | 897 (14.4) |
| 5 or more visits | 42 (16.9) | 789 (37.2) | 120 (27.9) | 489 (14.2) | 1440 (23.1) |
|
Primary Care: Number of Office Visits Per Patient |
|||||
| Mean (SD) | 1.3 (2.1) | 1.4 (1.9) | 1.3 (1.9) | 1.4 (2.0) | 1.4 (2.0) |
| Median | 1 | 1 | 1 | 1 | 1 |
| Q1, Q3 | 0.0, 2.0 | 0.0, 2.0 | 0.0, 2.0 | 0.0, 2.0 | 0.0, 2.0 |
| Range | 0.0–23.0 | 0.0–18.0 | 0.0–14.0 | 0.0–31.0 | 0.0–31.0 |
| Primary Care: Proportion With Visits | |||||
| 0 visits | 115 (46.4) | 892 (42.0) | 197 (45.8) | 1402 (40.7) | 2606 (41.7) |
| 1 visit | 60 (24.2) | 545 (25.7) | 95 (22.1) | 858 (24.9) | 1558 (24.9) |
| 2 visits | 31 (12.5) | 291 (13.7) | 62 (14.4) | 521 (15.1) | 905 (14.5) |
| 3 visits | 12 (4.8) | 158 (7.4) | 37 (8.6) | 289 (8.4) | 496 (7.9) |
| 4 visits | 18 (7.3) | 87 (4.1) | 12 (2.8) | 168 (4.9) | 285 (4.6) |
| 5 or more visits | 12 (4.8) | 150 (7.1) | 27 (6.3) | 208 (6.0) | 397 (6.4) |
Data are presented as n (%) except where otherwise noted.
Abbreviations: AC = doxorubicin-cyclophosphamide; AC-T = doxorubicin-cyclophosphamide before or after paclitaxel or docetaxel; Q1, Q3 = first quartile, third quartile; TAC = doxorubicin-cyclophosphamide concurrent with paclitaxel or docetaxel; TC = docetaxel-cyclophosphamide.
Year of follow-up began four months after chemotherapy completion.
The adjusted mean number of office visits per patient in our study was lower among those who received TC (6.5) than AC-T (8.1; P < .001) or TAC (7.3; P < .001), with no statistically significant differences for the visit number after TC compared with AC (6.0; P = .021; Table 3). This finding seemed primarily driven by the difference in adjusted mean number of Medical Oncology visits. The mean number of Medical Oncology visits was 3.9 after AC-T (P < .001), 3.2 after TAC (P < .001), 2.5 after TC (reference), and 2.4 after AC (P = .61). When women who underwent breast reconstruction were excluded, the average number of office visits per patient after AC decreased more (a 0.4 decrease to 5.6) than after the other regimens, such that the difference between AC and TC (6.4) was statistically significant (P = .003; Table 3). Only 2% of patients had no office visits during the year of follow-up, but 41.7% did not see primary care at all during this timeframe. Primary care visit rates did not differ according to regimen, with an average adjusted number of 1.2 visits per patient. Breast cancer was the primary diagnosis billed for 66.9% of Medical Oncology visits, but only 5.5% of primary care visits. Hypertension, diabetes, and hyperlipidemia were other common primary diagnoses for primary care visits (accounting for 12.2%, 5.3%, and 5.2% of visits, respectively). See Table 4 for more details.
Table 3.
Adjusted Mean Numbers of Office Visits Per Patient According to Adjuvant Chemotherapy Regimen
| All Patients | AC (n = 248) | AC-T (n = 2123) | TAC (n = 430) | TC (n = 3446) |
|---|---|---|---|---|
| All Office Visits | ||||
| Number Per Patient (95% CI) | 6.0 (5.5–6.4) | 8.1 (7.9–8.3) | 7.3 (6.9–7.7) | 6.5 (6.4–6.7) |
| P | .021 | <.001 | <.001 | Reference |
| Medical Oncology Visits | ||||
| Number Per Patient (95% CI) | 2.4 (2.2–2.7) | 3.9 (3.7–4.0) | 3.2 (3.0–3.4) | 2.5 (2.4–2.6) |
| P | .611 | <.001 | <.001 | Reference |
| Primary Care Visits | ||||
| Number Per Patient (95% CI) | 1.1 (1.0–1.3) | 1.3 (1.3–1.4) | 1.2 (1.1–1.4) | 1.3 (1.2–1.3) |
| P | .198 | .236 | .466 | Reference |
|
Patients Who Underwent Reconstruction Excluded |
AC (n = 191) | AC-T (n = 1652) | TAC (n = 307) | TC (n = 2737) |
| All Office Visits | ||||
| Number Per Patient (95% CI) | 5.6 (5.1–6.1) | 8.0 (7.8–8.3) | 7.1 (6.7–7.6) | 6.4 (6.3–6.6) |
| P | .003 | < .001 | < .001 | Reference |
| Medical Oncology Visits | ||||
| Number Per Patient (95% CI) | 2.5 (2.2–2.8) | 4.0 (3.8–4.1) | 3.1 (2.9–3.4) | 2.5 (2.5–2.6) |
| P | .592 | < .001 | < .001 | Reference |
| Primary Care Visits | ||||
| Number Per Patient (95% CI) | 1.1 (0.9–1.3) | 1.3 (1.3–1.4) | 1.2 (1.1–1.4) | 1.3 (1.2–1.4) |
| P | .043 | .398 | .487 | Reference |
Numbers are adjusted by age, race, region, year of chemo initiation, surgery type, number of chronic conditions, previous hospitalizations, and radiation. Year of follow-up began 4 months after chemotherapy completion.
Abbreviations: AC = doxorubicin-cyclophosphamide; AC-T = doxorubicin-cyclophosphamide before or after paclitaxel or docetaxel; TAC = doxorubicin-cyclophosphamide concurrent with paclitaxel or docetaxel; TC = docetaxel-cyclophosphamide.
Table 4.
Top 5 Primary Diagnoses Billed
| All Office Visits | Medical Oncology Visits | Primary Care Visits | |
|---|---|---|---|
| 1 | Breast cancer (36.9%) | Breast cancer (66.9%) | Hypertension (12.2%) |
| 2 | Unclassified (6.4%)a | Unclassified (6.8%)a | Exam/evaluation (5.6%) |
| 3 | Hypertension (2.8%) | Maintenance chemotherapy/XRT (4.7%)b | Breast cancer (5.5%) |
| 4 | Maintenance chemotherapy/XRT (2.2%)b | Anemia (1.8%) | Diabetes (5.3%) |
| 5 | Breast disorder (2.1%) | Other aftercare (1.4%) | Hyperlipidemia (5.2%) |
Abbreviation: XRT = radiation.
Clinical Classifications Software (CCS) category “unclassified” includes diagnosis of estrogen receptor positive status, estrogen receptor negative status, postsurgical absence of breast/nipple, and personal/family history of malignant neoplasm of breast.
“Maintenance chemotherapy/XRT” includes office visits for “encounter for radiotherapy (V58.0),” “encounter for antineoplastic chemotherapy (V58.11),” “encounter for antineoplastic immunotherapy (V58.12),” “convalescence following chemotherapy (V66.2),” “follow-up examination, following radiotherapy (V67.1),” and “follow-up examination, following chemotherapy (V67.2).”
Discussion
Among a cohort of relatively young breast cancer survivors, the frequency of Medical Oncology office visits during the year after completion of chemotherapy varied according to chemotherapy regimen, with AC-T and TAC associated with more visits than TC and AC. These differences remained statistically significant, even after adjustment for a variety of other factors that might affect visit frequency. Our findings are consistent with data from Barcenas et al,4 showing higher rates of hospitalization during AC-T and TAC. We suspect that greater outpatient health care use during and after AC-T and TAC might, in part, reflect a greater burden of toxicity among recipients of combined anthracycline and taxane therapy. Taxanes are known to produce long-term neuropathy in a substantial minority of patients15 and anthracyclines can be cardiotoxic16,17; combination therapy might increase risk of a variety of short- and long-term side effects that negatively affect patients during and after treatment.18 In addition, patients who received a taxane as well as an anthracycline might have had more advanced disease, leading patients or providers to prefer more frequent follow-up, although national guidelines do not recommend more frequent follow-up of patients with higher stages of curatively treated breast cancer.7 Interestingly, when patients who underwent reconstruction were excluded from our analyses, outpatient visits were less frequent after AC than TC. This finding might be related to the fact that their toxicity profiles differ,19 or it might reflect unmeasured differences in the characteristics of the patients who were treated with AC versus TC.
Underuse of Medical Oncology care appears to be extremely rare, but approximately 2 in 5 patients did not see a primary care provider during the year after completion of adjuvant chemotherapy. The mean number of primary care visits we observed is substantially lower than those found in a recent analysis of visit frequency in an older SEER-Medicare population of breast cancer survivors,8 possibly reflecting less use of primary care among younger patients. There is an ongoing national effort to transition breast cancer survivorship care from medical oncologists to primary care providers earlier after completion of breast cancer treatment. However, transition of care will be difficult if patients do not maintain their relationships with their primary care providers by visiting with them at least once during the year after completion of treatment. A health care model that does not keep primary care providers involved during and shortly after specialty care will not encourage patients to feel comfortable with primary care follow-up in the long term. Additional supports might be needed (eg, tools that improve communication between oncology teams, primary care providers, and patients) to help young women feel comfortable transitioning their care back to their primary care providers.
Our study is limited by its retrospective nature and reliance on insurance claims-based methodology, which impairs our ability to fully appreciate the patient- and treatment- related factors that might affect the use of outpatient resources. Billing codes for specific toxicities might be underutilized such that it is difficult to tease out the true reasons for follow-up visits after cancer treatment. We did not have access to pathology or staging information, which might affect choice of treatment regimen as well as recurrence risk (which might drive visit frequency). We excluded patients who underwent subsequent surgical resections, those with metastatic diagnoses, and those who received alternative chemotherapy regimens, including HER2/neu-directed therapies, in an effort to focus on care use in early stage, HER2/neu-negative breast cancer. We were limited in our ability to determine whether patients seen for routine surveillance of breast cancer or complications of treatment, because providers might discuss or manage a variety of toxicities without billing for these specific issues. Further, patients might have been seen in clinic for follow-up from a previous hospitalization. In addition, we did not have data on endocrine therapy use, which might affect visit frequency.
Conclusion
The frequency of outpatient office visits after completion of adjuvant chemotherapy for early stage HER2/neu-negative breast cancer survivors varies significantly among treatment regimens, with the highest frequency among those who receive AC-T and TAC. Additional nonclaims-based research is needed to elucidate the drivers of these patterns of health care use to optimize the costeffectiveness of cancer care. Understanding these differences in health care use might elucidate an opportunity for providers to proactively address health care concerns that arise for our patients during the survivorship period.
Clinical Practice Points
Previous studies have shown that there are considerable differences in terms of acute treatment-related toxicity between chemotherapy regimens during the treatment of early stage breast cancer.
However, there are limited data regarding outpatient visit utilization among breast cancer survivors after completion of chemotherapy, and how treatment regimen selection might affect later care needs.
Among 6247 early breast cancer survivors, those who received combined anthracycline/taxane regimens (AC-T or TAC) had significantly more outpatient visits during the year after completion of treatment, primarily in Medical Oncology, compared with those who received AC or TC.
Additionally, a large proportion of patients (40%) did not see a primary care provider during the year after completion of breast cancer treatment.
These data are of interest because they suggest that adjuvant chemotherapy regimen selection might significantly affect later health care needs, perhaps at least in part as a result of differences in acute and long-term toxicities between regimens.
These data emphasize the need for further research on the drivers of health care use to optimally address the concerns that arise during the survivorship period and to improve the costeffectiveness of cancer care.
Acknowledgments
Kathryn J. Ruddy was supported by a National Institutes of Health (NIH) training grant under the Center for Translational Science Activities (CTSA) Grant Program from the National Center for Advancing Translational Sciences (UL1 TR000135, KL2TR000136–09). The contents of this article are solely the responsibility of the authors and do not necessarily represent the official view of NIH. Lindsey Sangaralingham was supported by a 2016 National Comprehensive Cancer Network Foundation Young Investigator Award (PI: Ruddy).
Footnotes
Disclosure
The authors have stated that they have no conflicts of interest.
References
- 1.Cancer Facts & Figures 2017, Vol. 2017 Atlanta: American Cancer Society; 2017. [Google Scholar]
- 2.Du XL, Osborne C, Goodwin JS. Population-based assessment of hospitalizations for toxicity from chemotherapy in older women with breast cancer. J Clin Oncol 2002; 20:4636–42. [DOI] [PMC free article] [PubMed] [Google Scholar]
- 3.Hassett MJ, O’Malley AJ, Pakes JR, Newhouse JP, Earle CC. Frequency and cost of chemotherapy-related serious adverse effects in a population sample of women with breast cancer. J Natl Cancer Inst 2006; 98:1108–17. [DOI] [PubMed] [Google Scholar]
- 4.Barcenas CH, Niu J, Zhang N, et al. Risk of hospitalization according to chemotherapy regimen in early-stage breast cancer. J Clin Oncol 2014; 32: 2010–7. [DOI] [PMC free article] [PubMed] [Google Scholar]
- 5.Ruddy KJ, Van Houten HK, Sangaralingham LR, et al. Impact of treatment regimen on acute care use during and after adjuvant chemotherapy for early-stage breast cancer. Breast Cancer Res Treat 2017; 164:515–25. [DOI] [PubMed] [Google Scholar]
- 6.Baena-Canada JM, Estalella-Mendoza S, Rosado-Varela P, et al. Use of health care services during chemotherapy for breast cancer. Eur J Cancer 2012; 48:3328–34. [DOI] [PubMed] [Google Scholar]
- 7.National Comprehensive Cancer Network. Breast Cancer (Version 2.2017) 2017. Available at: www.nccn.org/professionals/physican_gls/pdf/breast_blocks.pdf, Accessed: October 15, 2017.
- 8.Neuman HB, Schumacher JR, Schneider DF, et al. Variation in the types of providers participating in breast cancer follow-up care: a SEER-Medicare analysis. Ann Surg Oncol 2017; 24:683–91. [DOI] [PMC free article] [PubMed] [Google Scholar]
- 9.Wallace PJ, Shah ND, Dennen T, Bleicher PA, Crown WH. Optum Labs: building a novel node in the learning health care system. Health Aff (Millwood) 2014; 33:1187–94. [DOI] [PubMed] [Google Scholar]
- 10.Optum. Real-world health care experiences from over 150 million unique individuals since 1993, Available at: https://www.optum.com/content/dam/optum/resources/productSheets/5302_Data_Assets_Chart_Sheet_ISPOR.pdf. Accessed: October 14, 2016.
- 11.Nattinger AB, Laud PW, Bajorunaite R, Sparapani RA, Freeman JL. An algorithm for the use of Medicare claims data to identify women with incident breast cancer. Health Serv Res 2004; 39:1733–49. [DOI] [PMC free article] [PubMed] [Google Scholar]
- 12.Gold HT, Do HT. Evaluation of three algorithms to identify incident breast cancer in Medicare claims data. Health Serv Res 2007; 42:2056–69. [DOI] [PMC free article] [PubMed] [Google Scholar]
- 13.Magnan E Algorithm for Identifying Patients with Multiple Chronic Conditions (Multimorbidity), University of Wisconsin - Madison Department of Family Medicine, the University of California - Davis Department of Family and Community Medicine, and the UW Health Innovation Program 2015, Available at: http://www.hipxchange.org/comorbidities.
- 14.Hwang W, Ireys HT, Anderson GF. Comparison of risk adjusters for Medicaid-enrolled children with and without chronic health conditions. Ambul Pediatr 2001; 1:217–24. [DOI] [PubMed] [Google Scholar]
- 15.Seretny M, Currie GL, Sena ES, et al. Incidence, prevalence, and predictors of chemotherapy-induced peripheral neuropathy: a systematic review and metaanalysis. Pain 2014; 155:2461–70. [DOI] [PubMed] [Google Scholar]
- 16.Pai VB, Nahata MC. Cardiotoxicity of chemotherapeutic agents: incidence, treatment and prevention. Drug Saf 2000; 22:263–302. [DOI] [PubMed] [Google Scholar]
- 17.Chen MH, Colan SD, Diller L. Cardiovascular disease: cause of morbidity and mortality in adult survivors of childhood cancers. Circ Res 2011; 108: 619–28. [DOI] [PubMed] [Google Scholar]
- 18.Schwentner L, Harbeck N, Singer S, et al. Short-term quality of life with epirubicin-fluorouracil-cyclophosphamide (FEC) and sequential epirubicin/cyclophosphamide-docetaxel (EC-DOC) chemotherapy in patients with primary breast cancer - results from the prospective multi-center randomized ADEBAR trial. Breast 2016; 27:69–77. [DOI] [PubMed] [Google Scholar]
- 19.Jones SE, Savin MA, Holmes FA, et al. Phase III trial comparing doxorubicin plus cyclophosphamide with docetaxel plus cyclophosphamide as adjuvant therapy for operable breast cancer. J Clin Oncol 2006; 24:5381–7. [DOI] [PubMed] [Google Scholar]