

ABSTRACT
Neurodegeneration is characterized by protein aggregate deposits and mitochondrial malfunction. Reduction in Tom40 (translocase of outer membrane 40) expression, a key subunit of the translocase of the outer mitochondrial membrane complex, led to accumulation of ubiquitin (Ub)-positive protein aggregates engulfed by Atg8a-positive membranes. Other macroautophagy markers were also abnormally accumulated. Autophagy was induced but the majority of autophagosomes failed to fuse with lysosomes when Tom40 was downregulated. In Tom40 RNAi tissues, autophagosome-like (AL) structures, often not sealed, were 10 times larger than starvation induced autophagosomes. Atg5 downregulation abolished Tom40 RNAi induced AL structure formation, but the Ub-positive aggregates remained, whereas knock down of Syx17, a gene required for autophagosome-lysosome fusion, led to the disappearance of giant AL structures and accumulation of small autophagosomes and phagophores near the Ub-positive aggregates. The protein aggregates contained many mitochondrial preproteins, cytosolic proteins, and proteasome subunits. Proteasome activity and ATP levels were reduced and the ROS levels was increased in Tom40 RNAi tissues. The simultaneous inhibition of proteasome activity, reduction in ATP production, and increase in ROS, but none of these conditions alone, can mimic the imbalanced proteostasis phenotypes observed in Tom40 RNAi cells. Knockdown of ref(2)P or ectopic expression of Pink1 and park greatly reduced aggregate formation in Tom40 RNAi tissues. In nerve tissues, reduction in Tom40 activity leads to aggregate formation and neurodegeneration. Rather than diminishing the neurodegenerative phenotypes, overexpression of Pink1 enhanced them. We proposed that defects in mitochondrial protein import may be the key to linking imbalanced proteostasis and mitochondrial defects.
Abbreviations: AL: autophagosome-like; Atg12: Autophagy-related 12; Atg14: Autophagy-related 14; Atg16: Autophagy-related 16; Atg5: Autophagy-related 5; Atg6: Autophagy-related 6; Atg8a: Autophagy-related 8a; Atg9: Autophagy-related 9; ATP: adenosine triphosphate; Cas9: CRISPR associated protein 9; cDNA: complementary DNA; COX4: Cytochrome c oxidase subunit 4; CRISPR: clustered regularly interspaced short palindromic repeats; Cyt-c1: Cytochrome c1; DAPI: 4,6-diamidino-2-phenylindole dihydrochloride; Dcr-2: Dicer-2; FLP: Flippase recombination enzyme; FRT: FLP recombination target; GFP: green fluorescent protein; GO: gene ontology; gRNA: guide RNA; Hsp60: Heat shock protein 60A; HDAC6: Histone deacetylase 6; htt: huntingtin; Idh: Isocitrate dehydrogenase; IFA: immunofluorescence assay; Irp-1A: Iron regulatory protein 1A; kdn: knockdown; Marf: Mitochondrial assembly regulatory factor; MitoGFP: Mitochondrial-GFP; MS: mass spectrometry; MTPAP: mitochondrial poly(A) polymerase; Nmnat: Nicotinamide mononucleotide adenylyltransferase; OE: overexpression; Pink1/PINK1: PTEN-induced putative kinase 1; polyQ: polyglutamine; PRKN: parkin RBR E3 ubiquitin protein ligase; Prosα4: proteasome α4 subunit; Prosβ1: proteasome β1 subunit; Prosβ5: proteasome β5 subunit; Prosβ7: proteasome β7 subunit; ref(2)P: refractory to sigma P; RFP: red fluorescent protein; RNAi: RNA interference; ROS: reactive oxygen species; Rpn11: Regulatory particle non-ATPase 11; Rpt2: Regulatory particle triple-A ATPase 2; scu: scully; sicily: severe impairment of CI with lengthened youth; sesB: stress-sensitive B; Syx17: Syntaxin17; TEM: transmission electron microscopy; ttm50: tiny tim 50; Tom: translocase of the outer membrane; Tom20: translocase of outer membrane 20; Tom40: translocase of outer membrane 40; Tom70: translocase of outer membrane 70; UAS: upstream active sequence; Ub: ubiquitin; VNC: ventral nerve cord; ZFYVE1: zinc finger FYVE-type containing 1
KEYWORDS: Autophagy, drosophila, mitochondria, neurodegeneration, proteinaggregates, TOM Complex
Introduction
Mitochondria are central organelles that participate in energy production, metabolism, and apoptosis [1]. They form dynamic networks to exchange materials and regulate metabolic status [2,3]. Mutations in genes encoding mitochondrial proteins have been identified in many neurodegenerative diseases, such as Parkinson disease (PD) [4], Leigh syndrome [5], amyotrophic lateral sclerosis (ALS) [6], and Charcot-Marie-Tooth disease (CMA) [7]. A number of other neurodegenerative diseases, such as Alzheimer disease (AD) [8] and Huntington disease (HD), are also associated with mitochondrial defects [9]. In addition to mitochondrial defects, many neurodegenerative diseases are often characterized by protein aggregate accumulation [10]. While it has been reported that misfolded proteins can induce mitochondrial import defects [11,12], it is unclear if mitochondrial defects contribute to aggregate formation in neurons.
Mitochondria are complicated cellular machines consisting of more than 1000 proteins, approximately 1% of which are encoded by mitochondrial DNA [13,14]. Most mitochondrial proteins are encoded by the nuclear genome, synthesized as precursors inside the cytosol, and then delivered to different mitochondrial compartments [15–17]. The translocase of the outer membrane (Tom) complex serves as the common entry gate for most precursors. After passing through, precursors with cleavable presequences are transferred from the Tom complex to the Tim23 (translocase of inner mitochondrial membrane 23) complex and are either released into the inner membrane or imported into the matrix with the help of the presequence translocase-associated motor (PAM) complex. Non-cleavable precursors take 3 different pathways to their destinations with the help of the sorting and assembly machinery (SAM) complex, Tim9-Tim10 chaperone complex, mitochondrial intermembrane space assembly (MIA) machinery, and Tim22 (translocase of inner mitochondrial membrane 22) complex [18]. The coordination of different complexes ensures proper mitochondrial functioning and cytosolic proteostasis. It has been reported that impairment of mitochondrial protein import leads to mitochondrial precursor overaccumulation stress (mPOS) that consequently triggers cell death in yeast [19]. However, another study in yeast illustrated that the unfolded protein response activated by protein mistargeting (UPRam) is, in fact, protective to cells [20]. Wang et al. [19] suggest that mPOS aggravates protein aggregation in the cytosol, whereas Wrobel et al. [20] suggest that mistargeting of mitochondrial precursors activated the proteasome, thereby decreasing ubiquitinated protein species. These contradicting findings indicate that mitochondrial protein import has complex effects on the homeostasis of cytosolic proteins [21]. Therefore, it is critical to identify cytoplasmic responses to mitochondrial protein import defects in higher organisms and understand how these responses contribute to neuronal health.
In this study, we found that reduced expression of Tom40 led to the accumulation of very large cytosolic aggregates that were engulfed by Atg8a-positive autophagosome-like (AL) membranes. The AL structures failed to fuse with lysosomes and thereby hindered clearance of the aggregates. More importantly, we found that knockdown of Tom40 leads to decreased proteasome activity, reduction of adenosine triphosphate (ATP) production, and increased levels of reactive oxygen species (ROS), that simultaneously resulted in autophagy defects and aggregate formation. Reduction of Tom40 expression in the Drosophila nervous system resulted in protein aggregate formation and degeneration of neurons. Tom40 RNA interiference (RNAi) also enhanced huntingtin (htt) polyglutamine (polyQ) protein induced neurodegeneration. In the present study, we provide a model that explains how defects in mitochondrial protein import disrupt protein homeostasis and induce neurodegeneration.
Results
Loss of Tom40 leads to misregulation of autophagy
Tom40 is the channel subunit of the Tom complex and a core component of the mitochondrial protein importing machine. Several polymorphisms in TOMM40 (translocase of outer mitochondrial membrane 40), the mammalian ortholog of Tom40, have been shown to be associated with risk and age of onset of Alzheimer disease [22–24], but the molecular mechanisms remain elusive. To examine cellular responses to the defects of mitochondrial protein import, we silenced Tom40 expression in the Drosophila fat body and examined the pattern of ubiquitinated proteins and autophagy marker Atg8a (Autophagy-related 8a). Drosophila fat-body tissue is a great model system for cell biology analysis. It contains a single layer of cells with big cell size [25,26]. In the fat-bodies of fed early third-instar larvae (92 to 96 h after egg laying), levels of ubiquitinated proteins and Atg8a were low and their patterns were diffused (Figure 1(A)). Knockdown of Tom40 led to a dramatic accumulation of ubiquitinated protein aggregates enveloped Atg8a-positive membranes in the fat-body cells (Figure 1(A’)), indicating that autophagy was misregulated. In addition, cell size was greatly reduced in Tom40 RNAi tissues, suggesting cell growth defects. To exclude possible off-target effects of the RNAi constructs, we used 2 different RNAi lines, TRiP.JF02030 (BL26005) and P{GD5210}v13177(VDAC13177), to target Tom40 in fat-bodies. Both led to the accumulation of ubiquitinated protein aggregates and Atg8a (Figure S1A–C). Since these 2 lines produced almost identical phenotypes, we chose the TRiP (transgenic RNAi project) line for further analysis. Using this RNAi line, efficiency of Tom40 knockdown in fat-bodies was approximately 79% (Figure S1G). We could rescue the RNAi phenotypes by overexpression of Tom40 cDNA (complementary DNA) in the same cells, indicating that the cytosolic defects were not off-target effects (Figure S1D–F).
Figure 1.
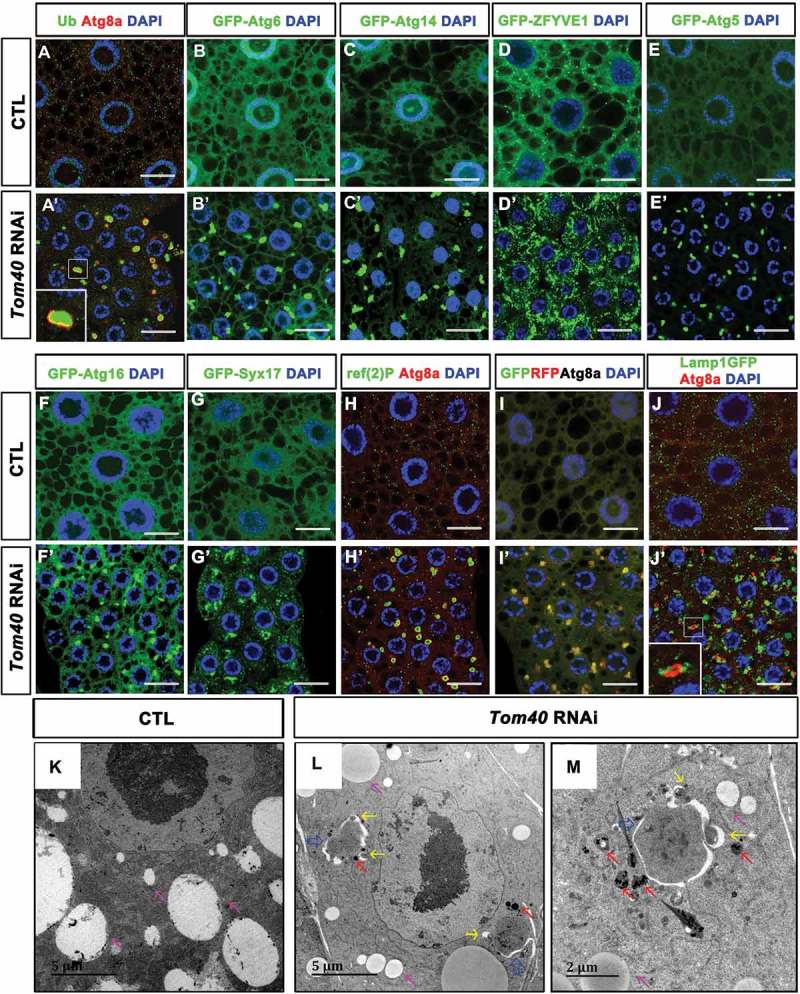
Tom40 RNAi led to autophagy defects in fly fat-body tissues. (A, A’) Early third-instar larvae fat-body tissues of the fed wild-type (CTL) (A) and Tom40 RNAi (A’) animals were dissected and stained with anti-Atg8a (red), and anti-Ub antibodies (green). (A’ inset) shows the detailed structures of the aggregates in Tom40 RNAi cells. Ub-positive aggregates were accumulated and wrapped with Atg8a-positive membranes. (B to G’) GFP-tagged various autophagy markers were expressed in fat-body tissues of CTL or Tom40 RNAi animals. GFP signals are green. (H, H’) Wild-type (CTL) and Tom40 RNAi fat-body tissues were stained with anti-ref(2)P (green) and anti-Atg8a (red). (I, I’) GFP-RFP-Atg8a was expressed in CTL or Tom40 RNAi fat-body tissues, most of the GFP (green) and RFP (red) signals colocalized. (J, J’) Lamp1GFP was expressed in CTL and Tom40 RNAi fat-body tissues. Most of the Atg8a (red) signals did not colocalize with GFP (green). DAPI staining marked the nuclei. The scale bar for the immunofluorescence assay (IFA) images: 20 μm. (K to M) TEM of the CTL and Tom40 RNAi fat-body tissues was analyzed. Pink arrows indicate lipid droplets. Large autophagosome like structures (blue arrows) surrounded the electron-dense materials, often adjacent to lysosome-like structures (red arrows) in the Tom40 RNAi fat-body cells. There were a few small autophagosomes (yellow arrows) that near or attached to the large double-membrane envelope. (See also Figure S1.).
Furthermore, we analyzed other autophagy markers in the fat-body tissues of Tom40 RNAi animals. In fed early third-instar larvae, class III phosphatidylinositol (PtdIns) 3-kinase complex [27] components – Atg6 (Autophagy-related 6) and Atg14 (Autophagy-related 14) – were diffused (Figure 1(B,C)); however, both GFP-Atg6 and GFP-Atg14 formed large puncta in Tom40 RNAi fat-body cells (Figure 1(B’,C’)). The omegasome marker, GFP-ZFYVE1 (zinc finger FYVE-type containing 1) [28], is distributed as small puncta in wild-type fat-body cells (Figure 1(D)), and in the Tom40 RNAi fat-body tissues, accumulation of large GFP-ZFYVE1 puncta was observed (Figure 1(D’)). Atg5 (Autophagy-related 5) and Atg16 (Autophagy-related 16), the key components of Atg12 (Autophagy-related 12)-conjugation systems [29], accumulated in Tom40 RNAi tissues as aggregates (Figure 1(E, E’, F, F’)). Syx17 (syntaxin 17), the SNARE (soluble N-ethylmaleimide-sensitive factor attachment protein receptors) protein required for autophagosome maturation [30], also accumulated as large puncta (Figure 1(G, G’)). These data suggest that autophagy is induced and/or blocked during the late stage in Tom40 RNAi tissues.
To analyze autophagy flux, we examined the autophagy substrate ref(2)P/p62 (refractory to sigma P, the Drosophila ortholog of mammalian SQSTM1/sequestosome 1) [31]. We generated an antibody to recognize fly ref(2)P, and the specificity was confirmed by staining ref(2)P-silenced or overexpressing tissues (Figure S1H to J). In Tom40 RNAi fat-body cells, endogenous ref(2)P formed ring-like structures that were enclosed by Atg8a-positive membranes (Figure 1(H, H’)). To exclude the possibility that accumulation of ref(2)P was due to the increase in ref(2)P expression, we used the UAS-Gal4 (upstream active sequence-Gal4) system to express HA-tagged ref(2)P in Tom40 RNAi tissue, where expression of HA-ref(2)P is not regulated by its own regulatory sequences but is controlled by Cg-Gal4, a Gal4 driver that is highly expressed in the fly larval fat-body. We found that HA-ref(2)P accumulated in a similar manner to endogenous ref(2)P (Figure S1K, L). These results indicate that autophagy flux is blocked in Tom40 RNAi tissues. GFP-RFP-Atg8a can be used to monitor fusion between autophagosomes and lysosomes [32]. Once autophagosomes fuse with lysosomes, GFP signals are quenched by the acidic environment, and only RFP signals can be observed. We expressed GFP-RFP-Atg8 in Tom40 RNAi tissues and found that although there were a few small red puncta, most of the large puncta were yellow (Figure 1(I, I’)), implying that the majority of autophagosome-lysosome fusion processes were blocked. Indeed, most of the Lamp1-GFP-labeled lysosomes did not colocalize with the autophagosome marker Atg8a, but were found adjacent to it (Figure 1(J, J’)).
Transmission electron microscopy (TEM) results showed double-membrane structures surrounding electron-dense materials, often adjacent to lysosome-like structures in the Tom40 RNAi fat-body cells (Figure 1(K–M)). Despite the fact that they were highly similar to the autophagosomes often observed in starved cells, the double-membrane structures (approximately 3 µm in diameter) were 10 times larger than regular autophagosomes (approximately 200 to 400 nm in diameter). In addition, AL structures in Tom40 RNAi fat-body cells were often not sealed. Occasionally, 1 or 2 small autophagosomes (approximately 200 to 400 nm in diameter) attached to the double-membrane envelope of the huge AL structure suggesting a type of fusion between them (Figure 1(L, M); yellow arrows).
Protein aggregate formation and autophagy defects are not a general cytosolic response to mitochondrial defects
To test whether protein aggregate formation and autophagy defects were specific to the loss of Tom40 or were a general response to the defects in mitochondrial protein import, we reduced the expression of other key molecules in import machineries and examined Atg8a and ubiquitin (Ub) staining in fat-body cells. Tom20 (translocase of outer membrane 20) is a receptor subunit of the Tom complex and ttm50 (tiny tim 50) is a key component of the Tim23 complex on the inner membrane [16]. Similar to Tom40 RNAi, Tom20 RNAi led to the accumulation of ubiquitinated protein aggregates and Atg8a (Figure 2(A–C)). We also generated Tom40 and ttm50 mutants using the CRISPR/Cas9 technique (Figure S2A–F) [33]; both mutants were lethal at the embryonic stage. The lethality was fully rescued by their respective genomic fragments, Dp(1;3)Dc180 (BL: 30310) for Tom40 and Dp(1;3)Dc406 (BL: 31456) for ttm50. To generate mosaic tissues containing Tom40 or ttm50 mutant cells, we recombined the mutant alleles to the FRT19A (FLP recombination target 19A) chromosomes, which contained two tandem yeast FRT DNA elements at the 19A position of X chromosome to mediate high frequency mitotic recombination upon expression of a flippase recombinase. We then generated the fat-body tissues carrying Tom40 or ttm50 mutant clones and examined them with confocal microscopy. Tom40 and ttm50 mutant cells were smaller than control cells (Figure 2(D–F)), suggesting growth defects. Consistent with RNAi results, ubiquitinated protein aggregates and GFP-Atg8a accumulated in Tom40 and ttm50 mutant clones. We could rescue these cellular phenotypes by introducing Tom40 or ttm50 cDNA to the mutant animals and driving their expression in mutant cells with Cg-Gal4 (Figure S2G). These data further confirmed that disruption of cytosolic protein homeostasis is caused by the loss of Tom40 or ttm50.
Figure 2.
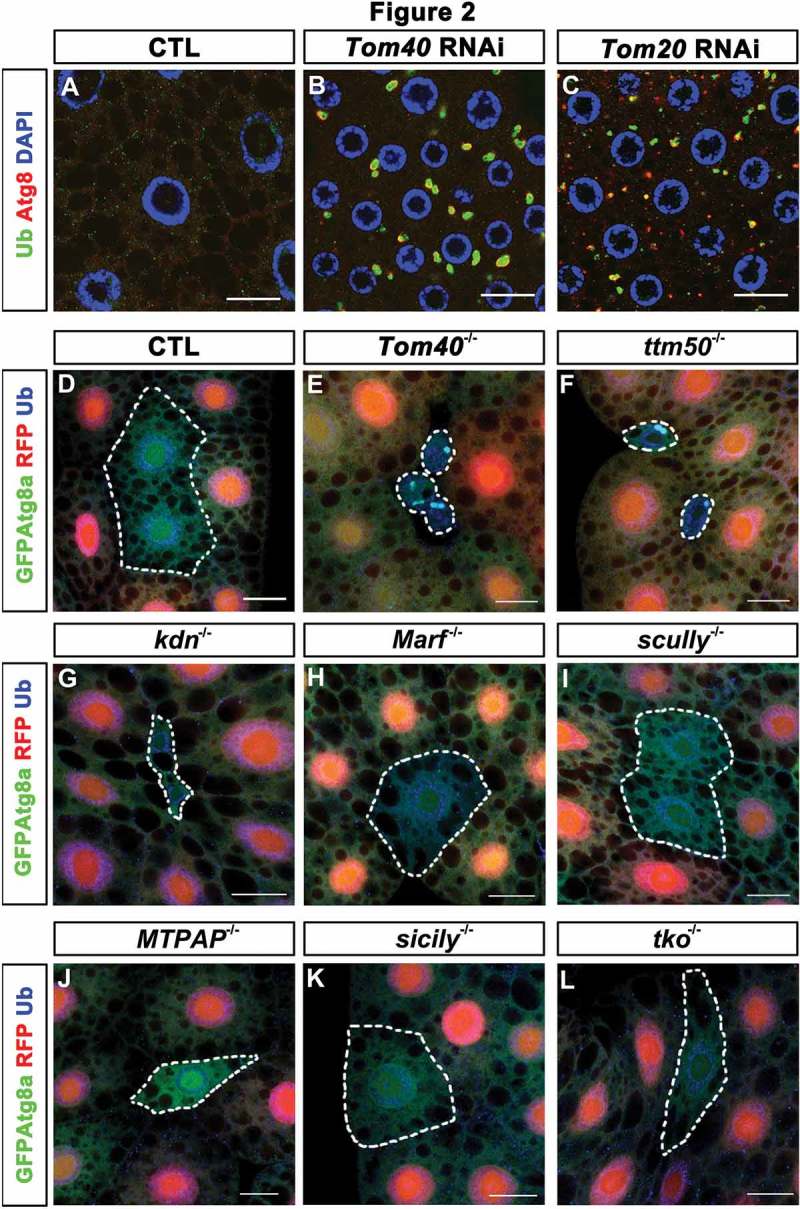
Mitochondrial protein transport defects but not several other mitochondrial deficiencies led to autophagy defects. (A to C) Anti-Ub (green) and anti-Atg8a (red) antibody staining of the fat-body tissues of control (CTL), Tom20 RNAi, and Tom40 RNAi flies were shown. Nuclei were marked with DAPI (blue) staining. (D to L) GFP-Atg8a was expressed in fat-body tissues of the flies with the indicated genotypes. The CTL clone and the indicated mutant clones were negatively marked by RFP (red). The GFP-Atg8a signals (green) and anti-Ub antibody staining (blue) of the fat-body tissues are shown. Scale bar: 20 μm. (See also Figure S2.).
Moreover, we wanted to test if ubiquitinated protein aggregate formation and autophagy defects were general cellular responses to mitochondrial malfunctions. Therefore, we examined some well-characterized mutants that affect various aspects of mitochondrial functions [34]. kdn (knockdown) encodes citrate synthase that participates in the tricarboxylic acid cycle in the mitochondrial matrix. Marf (Mitochondrial assembly regulatory factor) is a mitochondrial outer membrane protein that regulates mitochondrial fusion [35]. scu (scully) encodes a mitochondrial RNase (ribonuclease) P protein and is required for mitochondrial tRNA (transfer RNA) processing, while MTPAP is a mitochondrial poly (A) polymerase. sicily (severe impairment of CI with lengthened youth) functions as a chaperone that assists in the assembly of electron transport chain complex I [36], and tko (technical knockout) encodes a mitochondrial small ribosome protein. We created mutant clones of these genes in the early third-instar larval fat body and examined GFP-Atg8a and Ub staining patterns in these tissues. Cells in some mutant clones, such as kdn (Figure 2(G)) and MTPAP mutants (Figure 2(J)), were smaller than control cells suggesting that they exhibited cell growth defects similar to those of Tom40 and ttm50 mutants [37]. None of the mutant clones examined accumulated ubiquitinated protein aggregates or Atg8a puncta (Figure 2(G–L)), suggesting that protein aggregate formation and autophagy defects in Tom40 mutants were not a general response to mitochondrial malfunction but were specific to mitochondrial protein import defects.
Different mitochondrial precursors have different fates when their transport is blocked
Because Tom40 is the central gate for nuclear genome-encoded mitochondrial proteins to enter the mitochondria, we hypothesized that mistargeted mitochondrial precursors formed aggregates that induced autophagy defects. To test this hypothesis, we first analyzed if mitochondrial preproteins formed aggregates in the cytosol by selecting a handful of nuclear genome-encoded mitochondrial proteins whose destinations or transporting routes were well studied. We expressed the tagged form of these proteins in fly fat bodies and examined their distribution after Tom40 expression was reduced. We tested MitoGFP (Mitochondrial-GFP), an artificial preprotein with a mitochondrial targeting signal from protein Cyt-c1 (Cytochrome c1) fused to GFP. We expected MitoGFP to alter its localization from the mitochondria to the cytoplasm or to accumulate in aggregates. Surprisingly, MitoGFP levels were greatly reduced in Tom40 RNAi cells (Figure 3(A, A’, D, D’)), suggesting that mis-localized MitoGFP was degraded. Similar to MitoGFP, COX4-V5 (Cytochrome c oxidase subunit 4) (Figure 3(B, B’, E, E’)) and Hsp60-V5 (Heat shock protein 60A) levels (Figure 3(C, C’, F, F’)) were reduced in Tom40 RNAi tissues. The levels of some precursors, such as sesB-V5 (stress-sensitive B) (Figure 3(G, G’, J, J’)), Irp-1A-V5 (Iron regulatory protein 1A) (Figure 3(H, H’, K, K’)), Idh-V5 (Isocitrate dehydrogenase) (Figure 3(I, I’, L, L’)), Tom20-GFP (Figure 3(M, M’, P, P’)), and Tom70-HA (translocase of outer membrane 70) (Figure 3(N, N’, Q, Q’)) increased. However, these proteins did not accumulate as aggregates. Interestingly, we found that the beta-barrel protein, porin-V5, accumulated as aggregates that were also positive for Ub staining (Figure 3(O, O’)). However, total levels of porin-V5 did not significantly change (Figure 3(R, R’)). To examine if porin is the key protein for aggregate formation, we knocked down porin along with Tom40 and analyzed ubiquitinated protein. Knockdown of porin did not affect Ub-positive protein aggregate formation (Figure S3A–D), suggesting that porin may be a dispensable component of aggregated proteins during protein aggregate formation in Tom40 RNAi tissues. These data demonstrate that different mitochondrial protein precursors have different fates when their transport into the mitochondria fails. Only a proportion of mitochondrial proteins formed aggregates.
Figure 3.
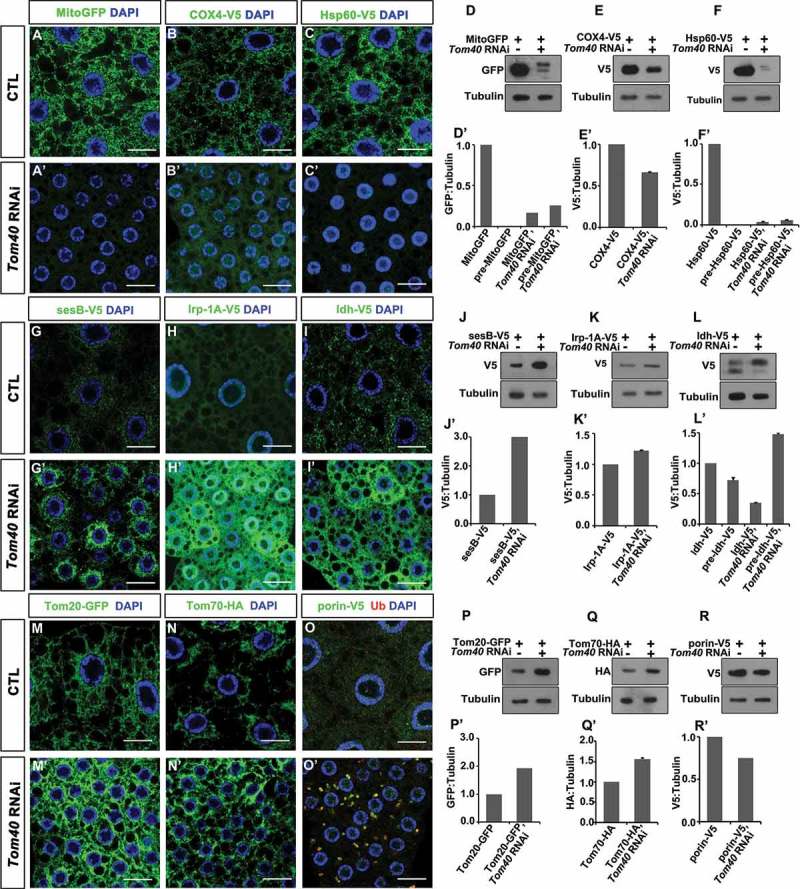
Different mitochondrial proteins or precursors have different fates in Tom40 RNAi tissues. (A and A’, G to I’, M to O’) The indicated tagged-form mitochondrial proteins and preproteins were expressed in wild-type (CTL) or Tom40 RNAi fat-body tissues. GFP, anti-V5, or anti-HA antibody staining (green) of the fat-body cells with the indicated genotypes are shown. DAPI (blue) staining marked the nuclei. The scale bar for the IFA images: 20 μm. (D to F’, J to L’, P to R’) Western blots of the fat body tissues of the indicated genotypes are shown to indicate the amount of the indicated proteins. Tubulin was used as a loading control. The quantification of the western blot results is shown as charts below individual western blot panels. (See also Figure S3.).
Proteasome subunits accumulate in aggregates and proteasome activity is reduced in Tom40 RNAi tissues
To further analyze the contents of aggregates, we isolated them and analyzed their components using mass spectrometry (MS). Since the aggregates were enveloped in the Atg8a-positive membrane, we expressed GFP-Atg8a in the fat bodies and pulled down the aggregates using an anti-GFP antibody. The aggregate pulldown was confirmed by the enrichment of Ub-positive proteins on the beads, detected by western blotting before MS sample analysis. Many proteins were identified by MS analysis (Table S1), and gene ontology (GO) enrichment analysis revealed that several mitochondrial proteins, including porin, were present in the aggregates (Figure 4(A) and S3E). Interestingly, we found 13 proteasome subunits, suggesting that they are also recruited to the aggregates. To confirm, we chose 2 proteasome subunits, Prosβ1 (proteasome β1 subunit) (Figure 4(B, B’)) and Prosβ7 (proteasome β7 subunit) (Figure 4(C, C’)) to express in fat-body cells with or without Tom40 RNAi. Consistent with MS data, both subunits were found accumulating in cytosolic aggregates of Tom40 RNAi tissues. Recruitment of proteasome subunits to aggregates might disrupt proteasome organization; therefore, we attempted to find out if proteasome activity is affected in Tom40 RNAi cells.
Figure 4.
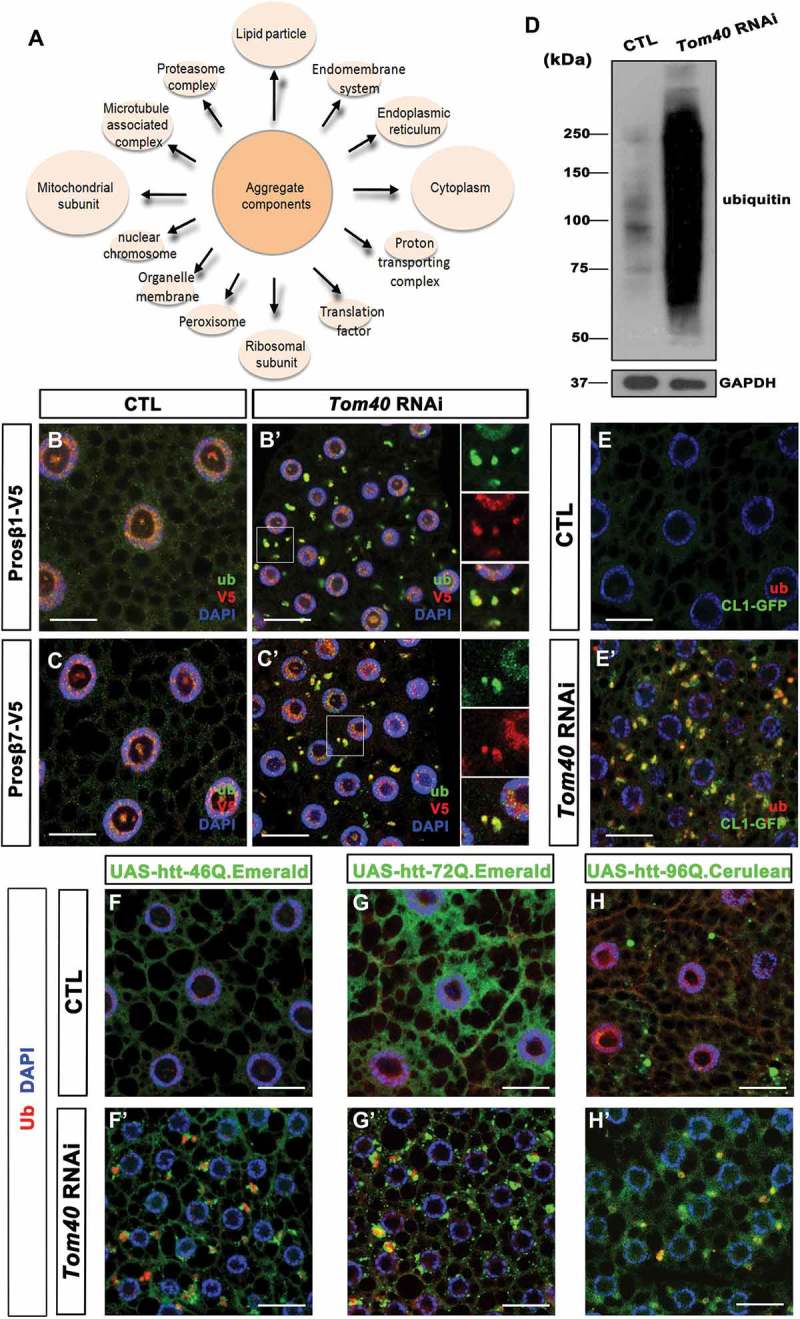
Proteasome subunits are accumulated in the aggregates and proteasome activity is reduced in Tom40 RNAi tissues. (A) The aggregates isolated from Tom40 RNAi tissues were analyzed by mass spectrometry. The identified proteins were analyzed by gene ontology (GO) enrichment analysis to reveal the major cellular components that they were belonging. (B to C’) Proteasome subunits Prosβ1-V5 and Prosβ7-V5 were expressed in both wild-type cells (CTL) and Tom40 RNAi cells. Anti-V5 (red) and anti-Ub (green) staining of fat-body cells with the indicated genotypes is shown. (D) Western blot of Ub-positive protein species in both CTL and Tom40 RNAi tissues. GAPDH level was probed as loading control. (E and E’) CL1-GFP (green) was expressed in CTL and Tom40 RNAi tissues. GFP fluorescence and anti-Ub (red) antibody staining are shown for the indicated genotypes. (F to H’) The indicated htt PolyQ proteins were expressed in CTL and Tom40 RNAi fat-body tissues. Green fluorescence (green) of the indicated htt PolyQ fluorescence proteins and anti-Ub (red) antibody staining of the fat-body tissues with the indicated genotypes are shown. Nuclei are marked by DAPI (blue) staining. The scale bar for the IFA images: 20 μm. (See also Figure S3, S4, Table S1.).
As mentioned above, numerous ubiquitinated protein aggregates were observed in Tom40 RNAi fat-body cells. Figures 1(A’) and 2(B), suggesting accumulation of ubiquitinated protein species. To confirm, we examined ubiquitinated proteins in both wild-type and Tom40 RNAi fly fat bodies by western blot analysis and discovered that ubiquitinated proteins are greatly increased in Tom40 RNAi tissues (Figure 4(D)), suggesting increased production and/or decreased clearance. Furthermore, to analyze activity of the ubiquitin-dependent proteasome pathway in Tom40 RNAi tissues, we expressed CL1-GFP, a reporter with GFP fused to the CL1 degron [38], in wild-type and Tom40 RNAi fat bodies and performed GFP and Ub staining. In wild-type control cells, levels of CL1-GFP were considerably low (Figure 4(E)). However, in Tom40 RNAi cells, CL1-GFP accumulated as large puncta and colocalized with Ub-positive aggregates (Figure 4(E’)), indica-ting that proteasome activity was indeed reduced in Tom40 RNAi tissues. Accumulation of CL1-GFP in cytosolic aggregates suggested that in addition to mitochondrial preprotein and proteasome subunits, cytosolic proteins ready to be degraded accumulated in the aggregates. The cytosolic proteins identified during MS may belong to this category (Table S1, Figure 4(A), S3E).
Two common phenomena in several neurodegenerative diseases are protein aggregation and mitochondrial defects [1,10]; therefore we examined if mitochondrial protein import defects enhance disease-related protein aggregate formation. We expressed htt46Q (Figure 4(F, F’)), htt72Q (Figure 4(G, G’)), and htt96Q proteins (Figure 4(H, H’)) [39] in fly fat bodies; htt46Q and 72Q did not readily form aggregates by themselves, unlike httQ96 that formed some aggregates in the cytosol (Figure 4(F,G,H)). In Tom40 RNAi tissues, all 3 htt proteins formed large aggregates, suggesting that inhibition of mitochondrial protein import enhances disease-related protein forming aggregates (Figure 4(F’, G’, H’)).
Next, to evaluate the effect of aggregate accumulation on the development of autophagy defects in Tom40 RNAi tissues, we reduced expression of proteasome subunits by RNAi in fat-body cells and analyzed Ub and Atg8a patterns. RNAi of Rpn11 (Regulatory particle non-ATPase 11), Rpt2 (Regulatory particle triple-A ATPase 2), and Prosβ5 (proteasome β5 subunit) led to the accumulation of large Ub-positive aggregates; however, Atg8a signals were not readily detected (Figure S3F–H). This suggests that accumulation of aggregates alone was not sufficient to induce the autophagy defects observed in Tom40 RNAi cells.
In Tom40 RNAi cells, ATP production was reduced (Figure S4A) and ROS levels were elevated (Figure S4B, C). We tested if reduction in ATP production and elevated ROS levels were sufficient to trigger aggregate formation and autophagy defects. Silencing the expression of Cyt-c1, a gene encoding the key component of ubiquinol-cytochrome c reductase complex (mitochondrial complex III), greatly reduced ATP levels (Figure S4A) and increased ROS production (Figure S4B, D). ROS levels of Cyt-c1 RNAi cells were comparable to those of Tom40 RNAi cells, while decreased ATP levels in Cyt-c1 RNAi cells were more severe than in Tom40 RNAi cells. However, there was no dramatic accumulation of ubiquitinated protein aggregates and Atg8a-positive puncta in Cyt-c1 RNAi cells (Figure S4E, G), suggesting that defects in ATP and ROS production were not sufficient to cause Tom40 RNAi-like cytosolic phenotypes.
We then speculated if reducing ATP production, increasing ROS, and inhibiting proteasome activity simultaneously, would lead to the defects observed in Tom40 RNAi cells. Knocking down most proteasome subunits together with Cyt-c1 leads to animal lethality before we could analyze the phenotypes. Knocking down Prosα4 (proteasome α4 subunit), a gene encoding a proteasome subunit, resulted in a very mild accumulation of ubiquitinated proteins in fat-body cells. When we knocked down Cyt-c1 together with Prosα4, large amounts of ubiquitinated protein aggregates engulfed by Atg8a-positive membranes were observed (Figure S4E–J), recapitulating the phenotypes seen in Tom40 RNAi cells. This suggests that reduction of ATP production, elevated ROS, and inhibition of proteasome activities are causative factors for the imbalanced protein homeostasis in Tom40 RNAi tissues.
Inhibition of autophagy in Tom40 RNAi tissues reduces aggregate size and hinders the engulfing of aggregates by phagophore membranes
To understand how autophagy processes are misregulated in Tom40 RNAi tissues, we carried out single and double-RNAi experiments to knockdown the expression of various core molecules of the autophagy pathway [40], alone or together with Tom40, and analyzed the patterns of ubiquitinated aggregates and Atg8a. All the RNAi lines targeting core molecules of autophagy pathways used here could efficiently block starvation-induced autophagy when they were expressed in fat-body tissues (Figure S5). We observed that Atg8a accumulation in Syx17 RNAi cells was much lower compared with its accumulation in Tom40 RNAi cells (Figure 5(A’, H)), even though both exhibited autophagosome-lysosome fusion defects, suggesting that autophagy was induced first and then blocked at the fusion stage in Tom40 RNAi cells.
Figure 5.
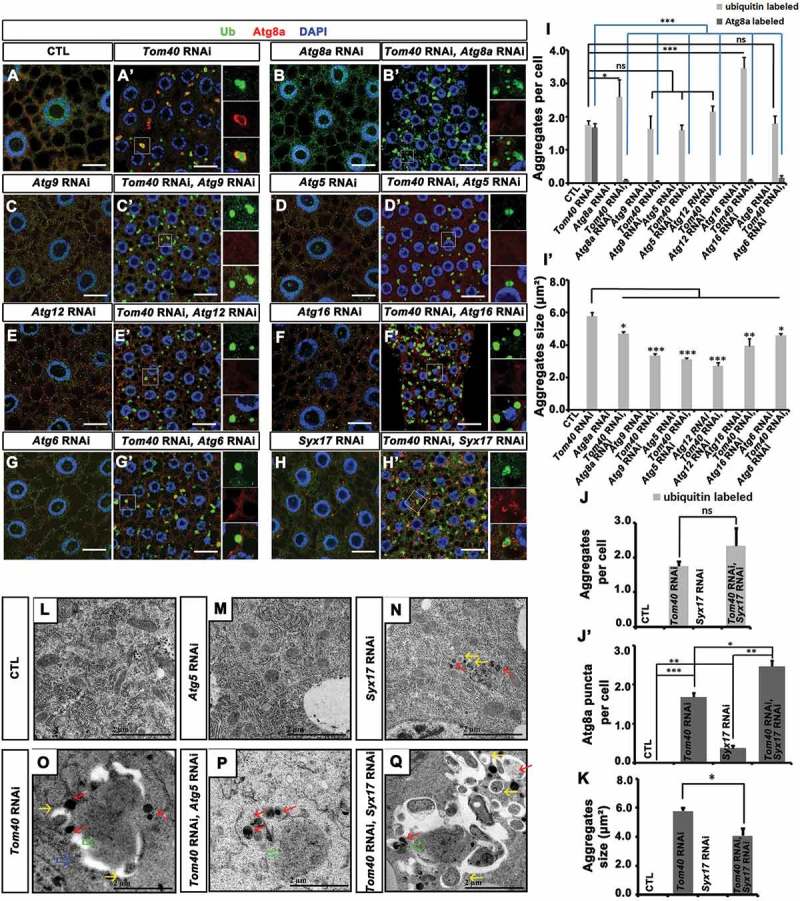
Inhibtion of autophagy in Tom40 RNAi tissues reduced aggregate size and blocked engulfing aggregates by phagophore membrane. (A to H’) Anti-Atg8a (red) and anti-Ub (green) antibody staining of the fat-body tissues with the indicated genotypes. Nuclei are marked by DAPI (blue) staining. The scale bar for the IFA images: 20 μm. (I to K) The quantification of the number and size of Ub and Atg8a-positive aggregates in the tissues with the indicated genotypes. ns: not significant; *: P < 0.05; **: P < 0.01; ***: P < 0.001. (L to Q) The TEM analysis of the fat-body tissues in the animals with the indicated genotypes. CTL (control). The blue arrow indicated the giant autophagosome-like structure in Tom40 RNAi tissues. The green arrows indicate the protein aggregates. The red arrows indicate lysosomes. The yellow arrows indicate small sealed autophagosomes.
RNAi of Atg8a greatly reduced Atg8a staining (Figure 5(B, B’)), supporting the specificity of Atg8a antibody staining. Compared with Tom40 RNAi tissues, the number of Ub-positive aggregates slightly increased and the average size of aggregates decreased in Tom40 and Atg8a double-RNAi tissues (Figure 5(A–B’, I, I’)). Similarly, Atg9, Atg5, Atg12, Atg16, or Atg6 together with Tom40 not only reduced aggregate size but also greatly reduced Atg8a signals of the ubiquitinated protein aggregates (Figure 5(C–G’, I, I’)). Therefore, these results imply that the key autophagy molecules are required for Tom40 RNAi-induced autophagy and growth of protein aggregates. The number of aggregates was higher while the size was reduced in Syx17 and Tom40 double-RNAi tissues compared with Tom40 RNAi tissues (Figure 5(H, H’, J–K)). In double-RNAi cells, accumulated Atg8a signals did not form ring-like structures around ubiquitinated protein aggregates, as we observed in Tom40 RNAi tissues (Figure 5(H, H’)), indicating that Tom40 RNAi-induced engulfment of protein aggregates by Atg8a-positive autophagosome membranes requires Syx17.
Furthermore, we examined TEM results of fat-body tissues from Atg5, Syx17, and Tom40 single or double-RNAi animals (Figure 5(L–Q)). In Atg5 and Tom40 double-RNAi tissues (Figure 5(P)), electron-dense aggregates were not engulfed by the double-membrane structures, and the aggregate sizes were smaller than in tissues with Tom40 RNAi alone (Figure 5(O)). Syx17 RNAi alone led to the accumulation of small autophagosomes and lysosomes in the cytosol (Figure 5(N)). In Syx17 and Tom40 double-RNAi tissues, electron-dense aggregates were noticeably small and remained surrounded by numerous autophagosomes and phagophores (Figure 5(Q)). These data suggest that autophagy is induced then later blocked at the fusion stage owing to the reduced expression of Tom40. Formation of Atg8a-labeled autophagy membrane structures was dependent on Atg9, Atg5, Atg12, and Atg16. The excessively large AL structures in Tom40 RNAi tissues were formed through the fusion of small autophagosomes with phagophores for which Syx17 is required. In Tom40 RNAi tissues, these AL structures were often not sealed, which may explain why they were unable to fuse with lysosomes.
It has been reported that Rab7 is required for autophagosome growth during mitophagy [34]; therefore, we tested if the giant AL structures observed in Tom40 RNAi tissues also require Rab7 activity. After knocking down Rab7 expression in Tom40 RNAi cells, there were no changes in Atg8a signals or double-membrane structures, indicating that Rab7 is not required for the excessive expansion of autophagosome membranes surrounding the aggregates (Figure S6).
ref(2)P RNAi and Pink1-park expression reduces the formation of protein aggregates in Tom40 RNAi tissues
We explored the possibility of aggregate reduction inside Tom40 RNAi cells, and because the aggregates tested positive for ref(2)P [41], ref(2)P was considered critical for aggregate accumulation. As expected, ubiquitinated protein aggregates were not found after the knockdown of ref(2)P in Tom40 RNAi cells (Figure 6(A–B’)). Furthermore, we attempted to express HDAC6 (Histone deacetylase 6) and Nmnat (Nicotinamide mononucleotide adenylyltransferase) that are associated with reduction in protein aggregate formation [38,42]; however, expression of both proteins did not affect Tom40 RNAi-induced protein aggregate formation (Figure 6(C–D’)).
Figure 6.
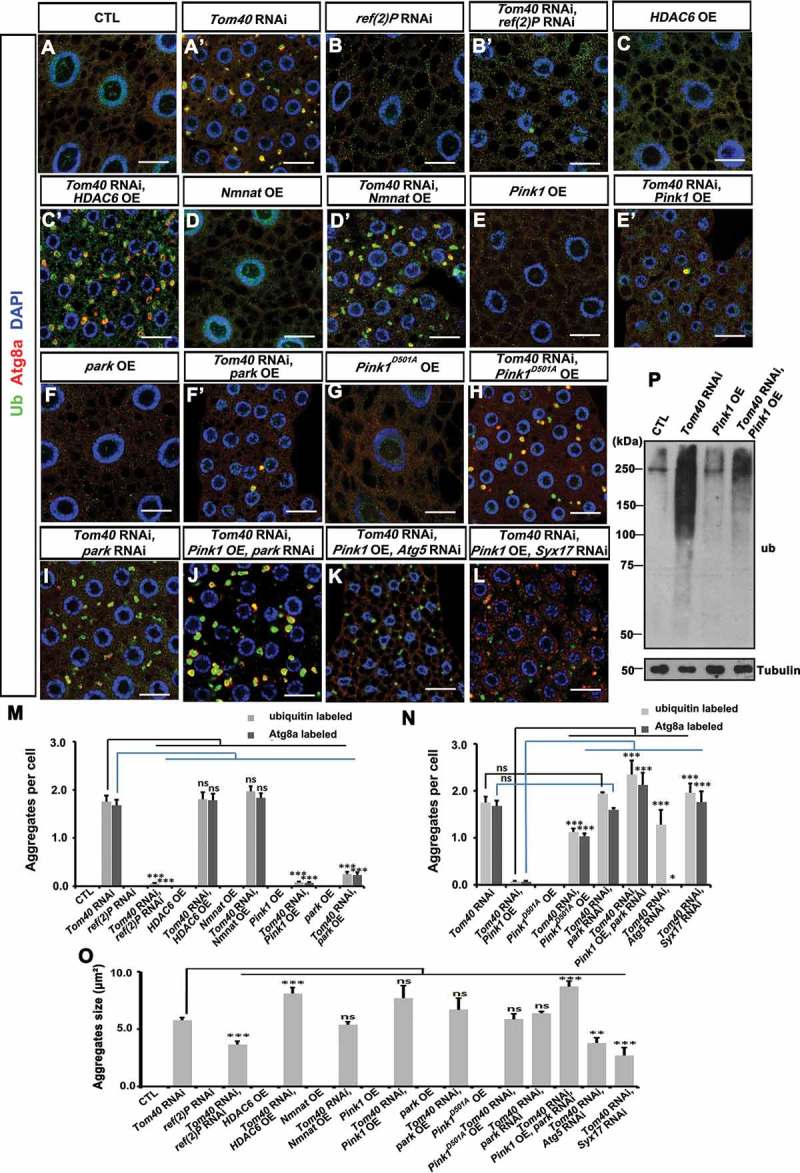
ref(2)P RNAi and Pink1-park overexpression reduce the formation of protein aggregates in Tom40 RNAi tissues. (A to L) Fat-body tissues from the animals of the indicated genotypes were stained with anti-Ub (green) and anti-Atg8a (red) antibodies. Nuclei were marked by DAPI (blue) staining. The scale bar for the IFA images: 20 μm. (M to O) The number and size of Ub- and Atg8a-positive aggregates in the fat-body tissues were quantified for the indicated genotypes. OE, overexpression; ns, not significant; *, P < 0.05; **, P < 0.01; ***, P < 0.001. (P) The ubiquitinated protein species in the fat-body tissues of the animals with the indicated genotypes were analyzed by western blot. Tubulin was used as a loading control.
Interestingly, when the key mitophagy inducer Pink1 (PTEN-induced putative kinase 1) [43] was overexpressed in Tom40 RNAi cells, protein aggregates were greatly reduced (Figure 6(E, E’, M–P)). Similarly, the expression of park (parkin), the E3 ligase required for mitophagy [44], reduced protein aggregate accumulation (Figure 6(F, F’, M, O)). In contrast, when kinase-dead Pink1 (Pink1D501A) was expressed in Tom40 RNAi cells, protein aggregates remained intact (Figure 6(G, H, N, O)). When Pink1 was overexpressed and park was knocked down in Tom40 RNAi cells, protein aggregates could still be observed (Figure 6(I, J, N, O)), indicating that Pink1 and park function in the same pathway to reduce aggregates.
To test if the reduction in aggregates depends on autophagy pathway activity, we knocked down core molecules in the autophagy pathway, such as Atg5 and Syx17, in the tissue along with Tom40 knockdown and Pink1 overexpression. The reduction of aggregates in Tom40 RNAi tissues induced by Pink1 overexpression was reversed when autophagy was blocked (Figure 6(K, L)). This suggests that Pink1-park-mediated aggregate reduction is autophagy-dependent.
Interestingly, we found that when we overexpressed Pink1 in Tom40 RNAi tissues, the remaining aggregates colocalized with Pink1 (Figure S7A,B). When it was expressed in Tom40 RNAi tissues, Pink1D501A also colocalized with Ub-positive aggregates (Figure S7C, D). These data raised a possibility that the overexpressed Pink1 may phosphorylate the aggregates and recruit park to induce the clearance of aggregates. If this is the case, we should be able to see that park is on the aggregates when it is overexpressed. However, when park was overexpressed, the remaining aggregates were not marked by park (Figure S7E, F). To exclude the possibility that the park-positive aggregates were eliminated and the remaining aggregates were park-negative, we blocked the autophagy process by Atg5 RNAi in the tissues with park expression and Tom40 RNAi. Under this condition, the aggregates were abundant and park was not on the aggregates (Figure S7G, H). These data suggest that Pink1 or park overexpression induced reduction of aggregates probably is not due to directly target the aggregates to the autophagy pathway.
TEM analysis showed that fat-body cells in fed early third-instar larvae possess many mitochondria and no autophagosomes (Figure 7(A), S7I, S7Q). In Tom40 RNAi cells, mitochondria were small and the AL double membranes enclosed electron-dense aggregates and were surrounded by many lysosomes (Figure 7(D), S7J, S7R). Overexpression of Pink1 in wild-type cells did not cause any dramatic change in morphology or number of mitochondria (Figure 7(B), S7K, S7S). However, when Pink1 was overexpressed in Tom40 RNAi tissues (Tom40 RNAi, Pink1 OE), the aggregates were no longer present and only large lysosomes and autolysosomes were observed (Figure 7(E), S7L, S7T).
Figure 7.
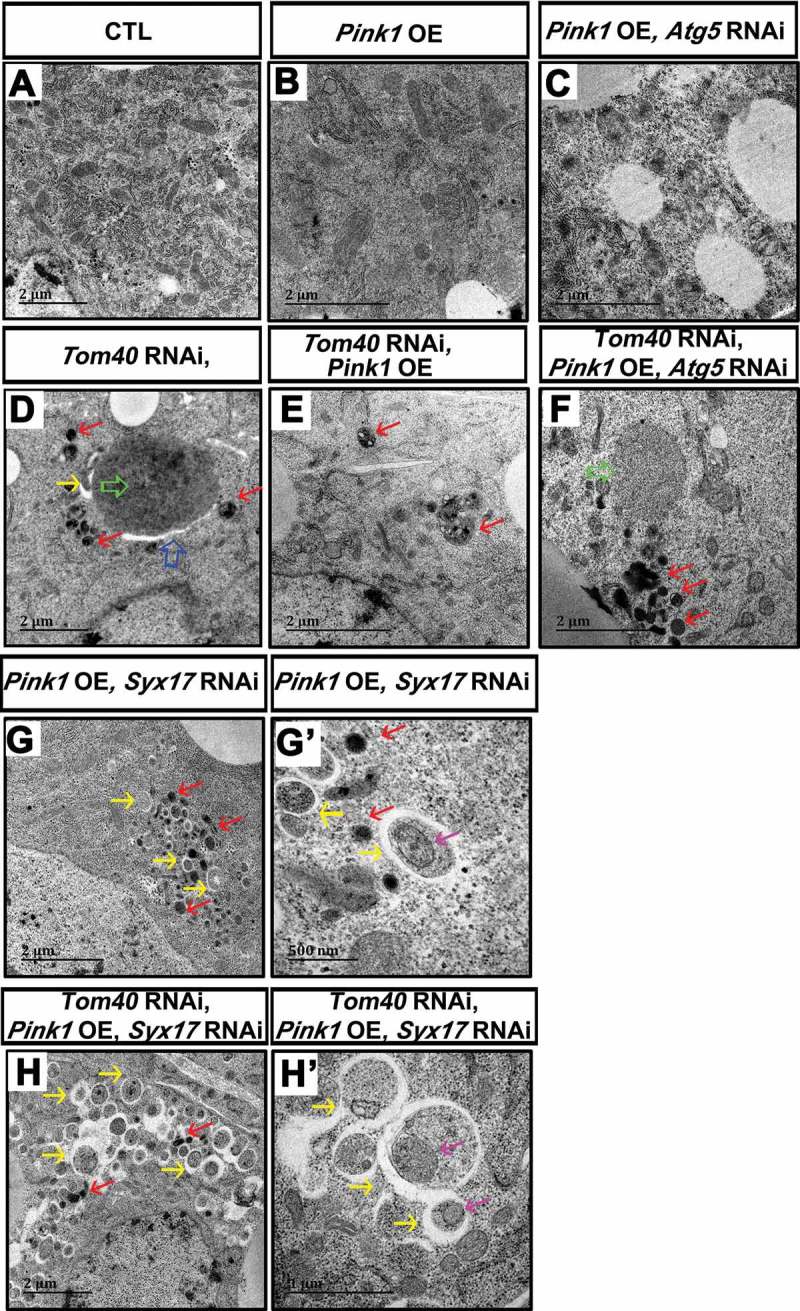
TEM analysis of the fat-body tissues in the animals with the indicated genotypes. The size of scale bar was labeled in each individual image. (G) and (G’) were tissues from animals with the same genotypes. The magnification of (G’) is larger than that of (G). (H) and (H’) were tissues from animals with the same genotypes. The magnification of (H’) is larger than that of (H). The blue arrow indicates the giant autophagosome-like structure in Tom40 RNAi tissues. The green arrows indicate the protein aggregates. The red arrows indicate lysosomes. The yellow arrows indicate small autophagosomes. The mitochondria-like structures inside autophagosomes are indicated by pink arrows. (See also Figure S5.).
We then further reduced Atg5 expression in tissues with Pink1 overexpression or both Tom40 RNAi and Pink1 overexpression to block autophagy at the initiation stage. Compared with only Pink1 overexpression, tissues of Atg5 RNAi and Pink1 overexpression exhibited more damaged mitochondria (Figure 7(C)). Tissues with Pink1 overexpression and Atg5 and Tom40 double-RNAi accumulated electron-dense aggregates near lysosomes (Figure 7(F)).
Next, we reduced Syx17 expression in Pink1 overexpression or both Tom40 RNAi and Pink1 overexpression tissues to block autophagy before the autophagosome-lysosome fusion stage. In Syx17 RNAi tissues, small amounts of autophagosomes accumulated (Figure 5(N), S7M). In contrast, Syx17 RNAi and Pink1-overexpressing tissues showed increased amounts of autophagosomes (Figure 7(G, G’), S7O), and some of them contained mitochondria-like structures (Figure 7(G’)), indicating that Pink1 overexpression may induce autophagy and mitophagy. There were more autophagosomes formed in Pink1 overexpression of Tom40 and Syx17 double-RNAi tissues compared with only Tom40 and Syx17 RNAi or Pink1 overexpression and Syx17 RNAi (Figure 7(H, H’), S7P). Many of these autophagosomes have mitochondria-like structures inside (Figure 7(H’)). These results suggest that Tom40 RNAi and Pink1 overexpression synergistically promote autophagy and mitophagy, preventing protein aggregate accumulation.
Reduction of Tom40 expression leads to neurodegeneration
The coexistence of mitochondrial defects and protein aggregate formation in Tom40 RNAi tissues appears to be similar to what is observed in the nervous system of patients with neurodegeneration. Therefore, we examined if Tom40 RNAi leads to neurodegeneration in Drosophila. We used GMR-Gal4, a Gal4 driver enables UAS transgene expression in the developing eyes, to drive the expression of UAS-Tom40 double-strand RNA (dsRNA) transgenes in developing fly eyes and examined photoreceptor cells on the 2nd and 30th days after the fly emerged from the pupa. Phalloidin staining of the retina showed that on the 2nd day, Tom40 RNAi fly eyes looked normal (Figure 8(A,B)). Thirty days after eclosion, several of the tested Tom40 RNAi cartridges lost rhabdomeres (Figure 8(A’, B’)). Detailed TEM studies confirmed degeneration in Tom40 RNAi eyes (Figure 8(C, C’, U, U’)). Moreover, we examined the Tom40 and ttm50 mutant clones of the adult fly eyes and observed similar but more severe degeneration in 2-day-old animals (Figure S8A–C’).
Figure 8.
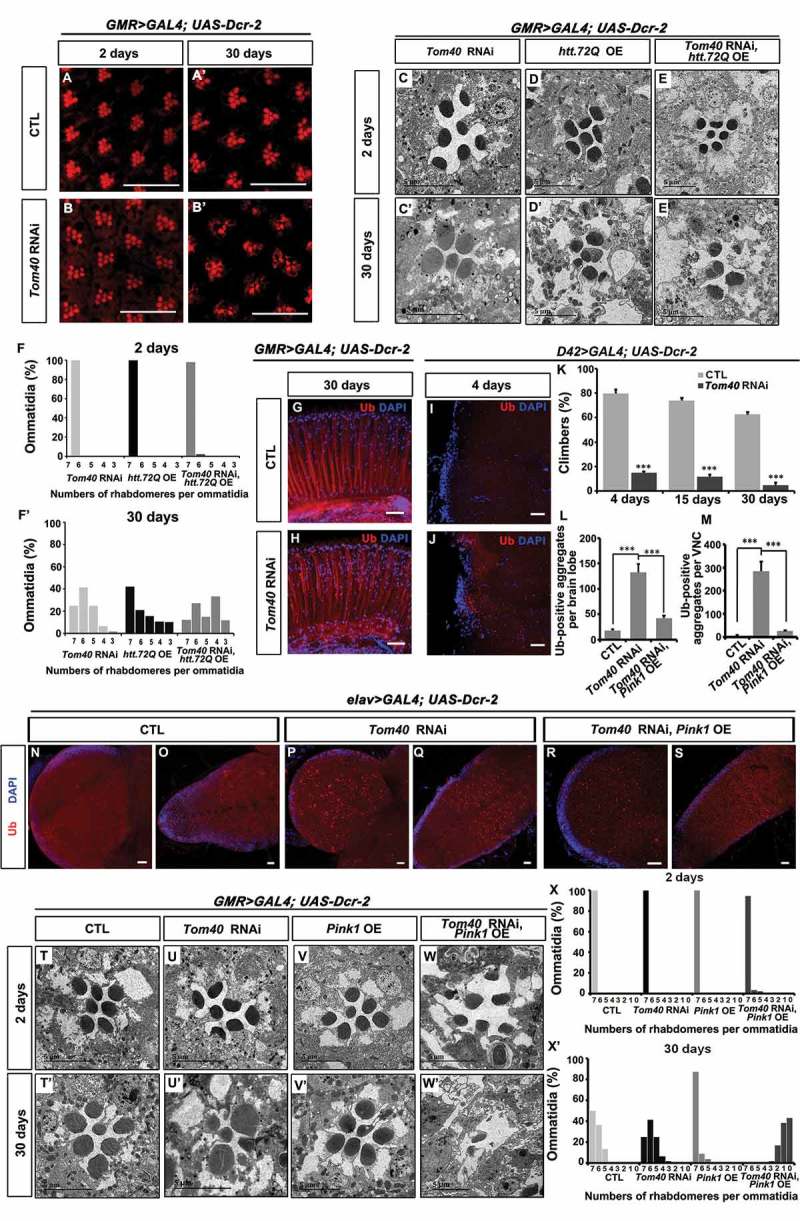
Reducing aggregates by overexpressing Pink1 enhances the neurodegeneration phenotypes in Tom40 RNAi animals. (A to B’) To knockdown Tom40 in the eye, GMR-Gal4 was used to drive Dcr-2 (Dicer-2) and Tom40 RNAi transgene expressing. The adult fly eyes of CTL and Tom40 RNAi animals were analyzed by phalloidin staining (red) at day 2 or day 30 after eclosion. (C to E’) The adult fly eyes with Tom40 RNAi and htt72Q overexpression (OE) individually or together were analyzed by TEM at day 2 or day 30 after eclosion. (F, F’) The TEM images of the 2-day- or 30-day-old adult fly eyes with the indicated genotypes were quantified by the percentage of ommatidia with the indicated numbers of rhabdomeres per ommatidia. (G, H) The adult eyes from 30-day-old CTL and Tom40 RNAi animals were stained with anti-Ub antibody (red) and DAPI (blue). (I to K) To knock down Tom40 in the motor neurons, D42-Gal4 was used to drive Dcr-2 and Tom40 RNAi transgene expression. (I, J) The 4-day-old adult ventral ganglia were stained with anti-Ub antibody (red) and DAPI (blue). (K) The climbing abilities of CTL and D42 Gal4> Tom40 RNAi animals were analyzed at different days after eclosion. ***: P < 0.001. (L to S) Pan-neural Elav-Gal4 was used to drive Dcr-2 and Tom40 RNAi transgene expression with or without Pink1 expression (OE) in neurons. (N to S) The third-instar larvae brain lobes and VNCs with the indicated genotypes were stained with anti-Ub (red) antibody and DAPI (blue) to analyze the Ub-positive protein species in the nerve system. (L, M) The Ub-positive protein aggregates in the brain lobes or VNCs of the animals with the indicated genotypes were quantified. ***: P < 0.001. (T to X’) The TEM analysis of the adult fly retina in the animals with the indicated genotypes at 2 days or 30 days after eclosion. (X, X’) The TEM images of the 2-day- or 30-day-old adult fly eyes with the indicated genotypes were quantified by the percentage of ommatidia with the indicated numbers of rhabdomeres per ommatidia. The scale bar for the IFA images: 20 μm. (See also Figure S7, S8 and S9.).
We then tested if Tom40 RNAi enhances htt polyQ protein-induced neurodegeneration, by using GMR-Gal4 to drive expression of UAS-htt72Q with or without UAS-Tom40 dsRNA and examined photoreceptor cells in 2-day-old or 30-day-old flies with TEM (Figure 8(C–F’)). There was no dramatic loss of rhabdomeres in the 2-day-old fly eyes across all 3 genotypes tested (Figure 8(C–F)). However, in the 30-day-old flies, a more pronounced loss of rhabdomeres was observed in both htt72Q-expressing and Tom40 knockdown eyes compared with that observed in eyes with htt72Q expression or Tom40 RNAi alone (Figure 8(C’–F’)). These data suggest that reduction in Tom40 expression leads to photoreceptor cell degeneration and enhanced htt ployQ protein-induced phenotypes in the eyes.
We further examined if the loss of Tom40 leads to protein aggregate formation in neurons. Staining of adult fly eyes with anti-Ub antibody confirmed that Ub-positive inclusions accumulated in Tom40 RNAi retinas (Figure 8(G, H)). When D42-Gal4 [45] was used for the knockdown of Tom40 expression in motor neurons, adult flies showed progressive climbing defects and increased levels of Ub-positive aggregates in flight motor neurons of the ventral ganglia (Figure 8(I–K)). Additionally, we used pan-neuronal Gal4 driver, elav-Gal4 [46] for Tom40 knockdown. The resulting animals only survived until the late third-instar stage, and we found large amounts of Ub-positive aggregates accumulated in the third-instar larval brain lobes and ventral nerve cord (Figure 8(L–Q)). This suggests that Tom40 maintains protein homeostasis in both fat-body cells and neurons.
Similar to what was observed in fat-body cells, we discovered that Pink1 overexpression reduced aggregate accumulation in Tom40 RNAi neurons (Figure 8(L, M, R, S)); therefore, we tested if overexpression of Pink1 can improve neuron fitness in Tom40-deficient flies. Surprisingly, overexpression of Pink1 did not slow down neurodegeneration but led to more severe degeneration phenotypes (Figure 8(T–X’)). When Pink1 was expressed alone in the eyes, the fly eye appeared normal in both young (2 days; Figure 8(V, X)) and old flies (30 days; Figure 8(V’, X’)). However, when Pink1 was expressed in Tom40 RNAi eyes, even the 2-day-old fly eyes started to display small rhabdomeres and the photoreceptor cells were filled with large autophagosome-like structures (Figure 8(W, X)). In the 30-day-old flies, most cartridges were found severely degenerated and many of them exhibited one or no rhabdomeres (Figure 8(W’, X’)). Even though it reduced aggregate formation, these results suggest that excessive autophagy and mitophagy or other effects caused by Pink1 overexpression is devastating for neurons.
Because ref(2)P RNAi reduced protein aggregates in fat-body cells, we tested if silencing ref(2)P in Tom40 RNAi tissues modifies eye degeneration phenotypes. ref(2)P RNAi alone exhibited mild photoreceptor cell degeneration (Figure S8D and E). Silencing ref(2)P together with Tom40 slightly slowed down the loss of rhabdomeres caused by Tom40 RNAi, as evidenced by the higher number of rhabdomeres found in the double-RNAi cartridges than in the Tom40 RNAi cartridges at day15 (Figure S8D and E). However, at day 30, ref(2)P and Tom40 double-RNAi eyes were similar to the Tom40 RNAi alone (Figure S8D and E), suggesting that reduction of protein aggregate formation is not sufficient to rescue the eye degeneration caused by Tom40 RNAi.
Discussion
Mitochondrial defects often lead to neurodegeneration [1]; however, the underlying mechanisms are not clear. We found that inhibition of mitochondrial protein import leads to imbalanced proteostasis in the cytosol. In Tom40 RNAi tissues, autophagy was induced and protein aggregates were engulfed by AL structures; however, the majority of autophagosomes failed to fuse with lysosomes. Interestingly, AL structures in Tom40 RNAi tissues were 10 times larger than regular autophagosomes and most of them were not sealed. It has been shown that enlarged phagophores attach to large aggregates of a selective autophagy cargo in yeast [47]. But the molecular mechanism is unknown.
When Syx17 expression was reduced, instead of forming large AL structures, numerous small autophagosomes and phagophores accumulated near the protein aggregates in Tom40 RNAi tissues. This suggests that the huge AL structures were formed through Syx17-mediated fusion between phagophores and autophagosomes (Figure S9B). It remains unclear how cytosolic protein aggregates recruited phagophores and autophagosomes and promoted their fusion with each other in Tom40 RNAi tissues. ref(2)P interacts with Atg8 through the LIR (LC3-interacting region) motif [48]; therefore, aggregate ref(2)P may play critical roles in ‘hijacking’ small autophagosomes from lysosomes and disturbing normal fusion between small autophagosomes and lysosomes. Indeed, aggregates of overexpressed ref(2)P/p62 have been shown to attract enlarged phagophores in fat cells of starved Drosophila larvae [49]. AL structures in Tom40 RNAi tissues were often not sealed, which may explain why there is no fusion between them and lysosomes. Tom40 RNAi tissues provide us with an appropriate model to further study the size control and closure of autophagosomes.
Ub-positive aggregate accumulation was not sufficient for giant AL structure formation. Reduction in ATP production and increase in ROS levels were also not sufficient to cause Tom40 RNAi-like phenotypes. Interestingly, the simultaneous reduction in proteasome activity and mitochondrial oxidative phosphorylation can mimic the cytosolic defects of Tom40 RNAi tissues.
Regarding the previously mentioned controversial reports on proteasome activity after inhibition of mitochondrial protein transport in yeast [19,20], our study showed that ubiquitinated proteins greatly increased upon Tom40 knockdown. In addition, proteasome activity was analyzed in situ in the fly fat-body using the CL1-GFP reporter. The evidence suggests that proteasome activity did not increase, but was reduced in Tom40 RNAi flies. Interestingly, although proteasome activity was reduced, mitochondrial preprotein responses were all different. As predicted, some precursors exhibited ubiquitous accumulation in the cytoplasm; however, levels of other precursors, including the mitochondrial reporter MitoGFP, were reduced. When we blocked the proteasome and autophagy pathways individually or simultaneously, we found that only the inhibition of both pathways was able to block reduction in MitoGFP levels (Figure S9A). This implied that certain levels of autophagy and proteasome activity were retained in Tom40 RNAi tissues. However, it unclear what mechanism determined the fate of preproteins when Tom40 levels were reduced.
Recently, it has been shown that misfolded cytosolic proteins induced by heat shock enter the mitochondria for degradation [50]. In the present study, we found many cytosolic proteins accumulating in the cytosolic aggregates. It would be interesting to test if these proteins were meant to be degraded in the mitochondria but failed to be transported there due to the loss of Tom40.
Furthermore, we found that Pink1 and park overexpression greatly reduces protein aggregate formation in Tom40 RNAi tissues. Pink1 and park are well known for their function in mitophagy. During mitophagy, PINK1 is accumulated on the damaged mitochondria and phosphorylates Ubiquitin and PRKN/PARKIN (mammalian ortholog of park) to recruit PRKN to the mitochondria. The activated PRKN then ubiquitinates the mitochondrial proteins and trigger the engulfment of the mitochondria [44]. We found that overexpressed Pink1 colocalized with the aggregates in the Tom40 RNAi tissues. One interesting hypothesis is that Pink1 directs the aggregates to the autophagy pathway in a same manner as it does to the damaged mitochondria. However, we could not detect the recruitments of park to the aggregates. Therefore, instead of being specific, the recruitment of overexpressed Pink1 to the aggregates may be just the same as the recruitments of other cytosolic proteins that were ready to be degradated (for example: CL1-GFP and htt polyQ proteins, Figure 4).
During mitophagy Pink1 mitochondrial localization depends on the Tom complex [44]. Loss of the Tom complex would prevent Pink1-mediated mitophagy. However, Pink1 overexpression dramatically increased mitophagy in Tom40 RNAi tissues (Figures 6, 7, S7); this can be explained by the 20% of Tom40 RNA remaining after knockdown. Phenotypes of Tom40 RNAi animals were less severe than Tom40 mutants, suggesting that part of the Tom complex was still functional in Tom40 RNAi animals. The other possibility is that overexpression of Pink1 and park in Tom40 RNAi tissues could induce autophagy by an unknown mechanism that is independent of their mitochondrial localization.
Protein aggregates are often observed in degenerating neurons or neuronal tissues [10]; however, their roles in neurodegeneration are controversial. Previous studies indicate that intermediate aggregates, and not the large inclusion bodies, are toxic [51], and many studies are now focusing on the clearance of aggregates in patients [52]. It seems reasonable that cleaning up misfolded ‘junk’ is a straightforward method for saving neurons.
ref(2)P RNAi reduced protein aggregates in Tom40 RNAi tissues; however, knockdown of ref(2)P did not prevent Tom40 RNAi-induced neurodegeneration. The loss of ref(2)P blocked misfolded proteins from forming aggregates but did not promote their clearance, which may explain why the decrease of aggregates through this method was not protective for neurons.
We also found that overexpressing Pink1 did not protect Tom40 RNAi neurons from degeneration but only damaged them further, despite the fact that protein aggregates were significantly reduced. It is possible that Pink1 overexpression caused other damage to the cells beyond reducing aggregates, for example, an increase in mitophagy. In a situation where the majority of mitochondria are healthy, an increase in mitophagy would offer protective functions [53]; however, if most mitochondria are defective, the increase in mitophagy may prove disastrous. We also cannot exclude the fact that other Pink1 substrates may promote neurodegeneration; therefore, further investigations are necessary to distinguish between these possibilities. Considering that the reduction of aggregates is not always protective, one needs to be cautious when deciding if a procedure is suitable for treating neurodegenerative diseases.
Materials and methods
Molecular biology
To produce glutathione S-transferase (GST) fusion proteins for antibodies production, cDNA fragments of full length Atg8a and ref(2)P that encodes the first 90 amino acids were subcloned into the pGEX6p-1 (GE Healthcare, 27-4597-01) vector. All the transgene vectors used in this study were constructed in the pUAST-attB plasmid as described previously [26]. The full list is available in the supplemental Tables.
Fly genetics
Tom40 and ttm50 knockout flies were produced using CRISPR/Cas9 technique as described before [54]. The Tom40-gRNA (guide RNA) (GCACGGGAAAAGCTTCCGTG) and ttm50-gRNA (GATTACCCAATGCGCGGT
GC) were designed to target the Tom40 and ttm50 coding region. The gRNA along with in vitro transcribed Cas9 mRNA were injected into w1118 embryos. The F0 and F1 heterozygous mutants were selected by sequencing.
The transgenic flies were generated by a standard procedure. The RNAi stocks were obtained from Tsinghua Fly center and Vienna Drosophila RNAi Center. The FLP (Flippase recombination enzyme)/FRT (FLP recombination target) stocks and the Gal4 stocks were obtained from the Bloomington Drosophila Stock Center. The genotypes of the fly strains generated in the paper are described in supplemental Table S2.
Immunofluorescence
Adult fly retinas were fixed in PBS (137 mM NaCl, 2.7 mM KCl, 10 mM Na2HPO4, 2 mM KH2PO4, pH 7.4) with 4% paraformaldehyde (Sigma-Aldrich, 158127) for 30 min, followed by permeabilizing in PBS with 0.4% Triton X-100 (Sangon Biotech, T0694) for 3 times. The tissues were incubated with primary antibody overnight at 4°C followed by extensive washing and incubated with secondary antibodies overnight at 4°C. After extensive washing, the samples were mounted in 80% glycerol (Sangon Biotech, A100854) with 5 ng/μL DAPI (Invitrogen, D-1306) followed by confocal microscopy (Cal Zeiss, LSM710, Oberkochen, Germany). For larval fatbody, brains, and ventral nerve cords (VNCs), all the other steps are same as the protocols used for adult fly retina except that the washing buffer was change to PBST (PBS + 0.1% Triton X-100).
Transmission electron microscopy
Fly heads were dissected and fixed at 4°C in 2% paraformaldehyde (Electron Microscopy Sciences, 15710); 2% glutaraldehyde (Electron Microscopy Sciences, 16020); 0.1 M sodium cacodylate pH 7.2 (Electron Microscopy Sciences, 12201). Then, they were post fixed in 2% OsO4 (Electron Microscopy Sciences, 19152). The 50-nm thin sections were stained with 4% uranyl acetate (Electron Microscopy Sciences, 22400) and 2.5% lead nitrate (Electron Microscopy Sciences, 17800) for electron microscopy analysis (Hitachi Ltd., HT7700, Tokyo, Japan). For the larval fatbodies, the tissues were fixed at 4°C in 2.5% glutaraldehyde. The other steps were the same as the protocol used for fly heads.
Western blot
Fat-body tissues of 3rd instar larvae were dissected in PBS, followed by centrifuging at 5000 g for 5 min at 4°C. Then PBS was removed and 2× SDS-loading buffer (100 mM Tris-HCl, pH 6.8, 20% glycerol, 4% SDS, 2% 2-mercaptoethanol, 0.02% bromophenol blue) was added. Proteins were separated by SDS-PAGE, and transferred onto a PVDF (MerckMillipore, IPVH00010) membrane. The membrane was blocked with 5% nonfat milk (Sangon Biotech, A600669) in TBST buffer (20 mM Tris-HCl, 150 mM NaCl, 0.1% Tween 20 (Sangon Biotech, A100777) and incubated with primary antibodies in 5% nonfat milk in TBST overnight at 4°C. After washing, blots were incubated with HRP-labeled secondary antibodies (Jackson Immuno Research Laboratories Inc., 111-035-003 and 40-115-035-003) and diluted 1:5,000 in 5% nonfat milk in TBST for 1 h at room temperature. Blots were then washed in TBST and incubated with ECL (Cyanagen Srl, XLS3-0020) reagents and exposed. Quantification of protein bands was done with ImageJ software.
Aggregate purification and LC-MS/MS analysis
Third-instar larvae were dissected in PBS and homogenized in Buffer A (25 mM Tris-HCl, pH 7.4, 150 mM NaCl, 1 mM EDTA, 5% glycerol and complete protease inhibitors (Sangon Biotech, C600386). The lysates then were cleared by centrifugation at 2,000 g for 5 min. To make sure the majority of Ub-positive proteins remain in the lysate, a small sample of both the lysate and the pellet was taken to examine Ub-positive proteins by western blot. The clearing lysates were adjusted to 1 mL volume with lysis buffer containing 0.5% NP-40 (Sangon Biotech, NDB0385). 200 μL anti-GFP coated beads slurry (GE Healthcare, 17-5280-01) was added to the lysate. After incubation for 3 h at 4°C, the beads were pelleted for 5 min and washed 4 times with Buffer A, followed by elution of bound protein with 2× SDS-PAGE sample buffer. Proteins were separated by SDS-PAGE, after the bands migrating about 1 cm, the gel were cut and subjected to in-gel digestion for LC-MS/MS analysis. The LC-MS/MS was analyzed with the Orbitrap Fusion™ Tribrid™ mass spectrometer (Thermo Fisher Scientific, Waltham, MA, USA) by Beijing Proteome Research Center. Standard procedures were followed.
Phalloidin staining
For whole-mount staining of fly retinas, heads were dissected in PBS and fixed in 4% paraformaldehyde for 1 h. Subsequently, the retinas were dissected and fixed for an additional 30 min. Retinas were rinsed several times with PBST (PBS + 0.4% Triton X-100) and incubated with 28 nM phalloidin (Cytoskeleton Inc., 057) overnight at 4°C followed by extensive washing. Stained samples were mounted in 80% glycerol with 5 ng/μL DAPI for microscopy analysis (Carl Zeiss, LSM710, Oberkochen, Germany).
Climbing assays
Groups of 10 males in the same age were transferred into the climbing apparatus and incubated for 5 min at room temperature for the environmental acclimatization. Gently tap the flies down to the bottom of the vial and measure the number of flies that can climb above the 8-cm mark by 10 sec after the tap. Ten trials were performed for each group, allowing for 1-min rest period between each trial. Six different groups were analyzed for each genotype. Males (4-day-old, 15-day-old and 30-day-old)were measured. The average pass rate was calculated for flies of all ages.
Statistical analysis
The number and size of ubiquitin- and Atg8a-positive structures were quantified from confocal images using ImageJ software. All the results were analyzed by the two-tailed unpaired Student t test and presented as mean values + SEM (standard error of the mean). A P value < 0.05 was considered statistically significant.
Funding Statement
This work was supported by the National Natural Science Foundation of China (NSFC) [31622034]; National Natural Science Foundation of China (NSFC) [31571383]; Natural Science Fundation of Zhejiang Province, China [LR16C070001]; National Basic Research Program of China [2014CB943100]; National key research & developmental program [2017YFC1001100]; National Natural Science Foundation of China (NSFC) [91754103]; National key research & developmental program [2017YFC1001500].
Acknowledgments
We are grateful to THFC, BDSC, and DGRC for providing fly strains and cDNA clones. We thank Dr. Xing Guo (Zhejiang University) for suggestions and reagents. We thank Drs. Xiaohang Yang (Zhejiang University) and Guanjun Gao (Shanghai Tech University) for help on the CRISPR/Cas9 system. We also want to thank Dr. G. Juhasz (Eötvös Loránd University) for the UAS-CL1-GFP flies. Dr. Tong is supported by National Natural Science Foundation of China [31622034, 31571383, 91754103], Natural Science Foundation of Zhejiang Province, China [LR16C070001], National Key Research & Developmental Program of China [2017YFC1001500, 2017YFC1001100], the National Basic Research Program of China [2014CB943100] and Fundamental research funds for the central universities.
Disclosure statement
No potential conflict of interest was reported by the authors.
Supplementary material
Supplemental data for this article can be accessed here.
References
- [1].Nunnari J, Suomalainen A.. Mitochondria: in sickness and in health. Cell. 2012. March 16;148(6):1145–1159. S0092-8674(12)00235-8 [pii]. PubMed PMID: 22424226; eng. [DOI] [PMC free article] [PubMed] [Google Scholar]
- [2].Mishra P, Chan DC.. Mitochondrial dynamics and inheritance during cell division, development and disease. Nat Rev Mol Cell Biol. 2014. October;15(10):634–646. nrm3877 [pii]. PubMed PMID: 25237825; PubMed Central PMCID: PMC4250044. eng. [DOI] [PMC free article] [PubMed] [Google Scholar]
- [3].Youle RJ, van der Bliek AM. Mitochondrial fission, fusion, and stress. Science. 2012. August 31;337(6098):1062–1065. 337/6098/1062 [pii]. PubMed PMID: 22936770; eng. [DOI] [PMC free article] [PubMed] [Google Scholar]
- [4].Dodson MW, Guo M. Pink1, Parkin, DJ-1 and mitochondrial dysfunction in Parkinson’s disease. Curr Opin Neurobiol. 2007. June;17(3):331–337. S0959-4388(07)00064-5 [pii]. PubMed PMID: 17499497; eng. [DOI] [PubMed] [Google Scholar]
- [5].Koopman WJ, Distelmaier F, Smeitink JA, et al. OXPHOS mutations and neurodegeneration. EMBO J. 2013. January 9;32(1):9–29. emboj2012300 [pii]. PubMed PMID: 23149385; PubMed Central PMCID: PMC3545297. eng. [DOI] [PMC free article] [PubMed] [Google Scholar]
- [6].Modjtahedi N, Tokatlidis K, Dessen P, et al. Mitochondrial proteins containing Coiled-Coil-Helix-Coiled-Coil-Helix (CHCH) domains in health and disease. Trends Biochem Sci. 2016. March;41(3):245–260. S0968-0004(15)00253-4 [pii]. PubMed PMID: 26782138; eng. [DOI] [PubMed] [Google Scholar]
- [7].Zuchner S, Mersiyanova IV, Muglia M, et al. Mutations in the mitochondrial GTPase mitofusin 2 cause Charcot-Marie-Tooth neuropathy type 2A. Nat Genet. 2004. May;36(5):449–451. ng1341 [pii]. PubMed PMID: 15064763; eng. [DOI] [PubMed] [Google Scholar]
- [8].Kerr JS, Adriaanse BA, Greig NH, et al. Mitophagy and Alzheimer’s disease: cellular and molecular mechanisms. Trends Neurosci. 2017. March;40(3):151–166. S0166-2236(17)30005-X [pii]. PubMed PMID: 28190529; PubMed Central PMCID: PMC5341618. eng. [DOI] [PMC free article] [PubMed] [Google Scholar]
- [9].Schapira AH, Olanow CW, Greenamyre JT, et al. Slowing of neurodegeneration in Parkinson’s disease and Huntington’s disease: future therapeutic perspectives. Lancet. 2014. August 9;384(9942):545–555. S0140-6736(14)61010-2 [pii]. PubMed PMID: 24954676; eng. [DOI] [PubMed] [Google Scholar]
- [10].Lim J, Yue Z. Neuronal aggregates: formation, clearance, and spreading. Dev Cell. 2015. February 23;32(4):491–501. S1534-5807(15)00104-5 [pii]. PubMed PMID: 25710535; PubMed Central PMCID: PMC4376477. eng. [DOI] [PMC free article] [PubMed] [Google Scholar]
- [11].Gottschalk WK, Lutz MW, He YT, et al. The broad impact of TOM40 on neurodegenerative diseases in aging. J Parkinsons Dis Alzheimers Dis. 2014. November;1(1):12 [pii] PubMed PMID: 25745640; PubMed Central PMCID: PMC4346331. eng. [DOI] [PMC free article] [PubMed] [Google Scholar]
- [12].Yano H, Baranov SV, Baranova OV, et al. Inhibition of mitochondrial protein import by mutant huntingtin. Nat Neurosci. 2014. June;17(6):822–831. nn.3721 [pii]. PubMed PMID: 24836077; PubMed Central PMCID: PMC4174557. eng. [DOI] [PMC free article] [PubMed] [Google Scholar]
- [13].Dolezal P, Likic V, Tachezy J, et al. Evolution of the molecular machines for protein import into mitochondria. Science. 2006. July 21;313(5785):314–318. 313/5785/314 [pii]. PubMed PMID: 16857931; eng. [DOI] [PubMed] [Google Scholar]
- [14].Sickmann A, Reinders J, Wagner Y, et al. The proteome of Saccharomyces cerevisiae mitochondria. Proc Natl Acad Sci U S A. 2003. November 11;100(23):13207–13212. 2135385100 [pii]. PubMed PMID: 14576278; PubMed Central PMCID: PMC263752. eng. [DOI] [PMC free article] [PubMed] [Google Scholar]
- [15].Harbauer AB, Zahedi RP, Sickmann A, et al. The protein import machinery of mitochondria-a regulatory hub in metabolism, stress, and disease. Cell Metab. 2014. March 4;19(3):357–372. S1550-4131(14)00016-3 [pii]. PubMed PMID: 24561263; eng. [DOI] [PubMed] [Google Scholar]
- [16].Schmidt O, Pfanner N, Meisinger C. Mitochondrial protein import: from proteomics to functional mechanisms. Nat Rev Mol Cell Biol. 2010. September;11(9):655–667. nrm2959 [pii]. PubMed PMID: 20729931; eng. [DOI] [PubMed] [Google Scholar]
- [17].Wiedemann N, Pfanner N. Mitochondrial machineries for protein import and assembly. Annu Rev Biochem. 2017. March 15 PubMed PMID: 28301740; eng DOI: 10.1146/annurev-biochem-060815-014352. [DOI] [PubMed] [Google Scholar]
- [18].Kutik S, Guiard B, Meyer HE, et al. Cooperation of translocase complexes in mitochondrial protein import. J Cell Biol. 2007. November 19;179(4):585–591. jcb.200708199 [pii]. PubMed PMID: 17998403; PubMed Central PMCID: PMC2080918. eng. [DOI] [PMC free article] [PubMed] [Google Scholar]
- [19].Wang X, Chen XJ. A cytosolic network suppressing mitochondria-mediated proteostatic stress and cell death. Nature. 2015. August 27;524(7566):481–484. nature14859 [pii]. PubMed PMID: 26192197; PubMed Central PMCID: PMC4582408. eng. [DOI] [PMC free article] [PubMed] [Google Scholar]
- [20].Wrobel L, Topf U, Bragoszewski P, et al. Mistargeted mitochondrial proteins activate a proteostatic response in the cytosol. Nature. 2015. August 27;524(7566):485–488. nature14951 [pii]. PubMed PMID: 26245374; eng. [DOI] [PubMed] [Google Scholar]
- [21].Topf U, Wrobel L, Chacinska A. Chatty mitochondria: keeping balance in cellular protein homeostasis. Trends Cell Biol. 2016. August;26(8):577–586. S0962-8924(16)00040-4 [pii]. PubMed PMID: 27004699; eng. [DOI] [PubMed] [Google Scholar]
- [22].Grupe A, Abraham R, Li Y, et al. Evidence for novel susceptibility genes for late-onset Alzheimer’s disease from a genome-wide association study of putative functional variants. Hum Mol Genet. 2007. April 15;16(8):865–873. ddm031 [pii]. PubMed PMID: 17317784; eng. [DOI] [PubMed] [Google Scholar]
- [23].Martin ER, Lai EH, Gilbert JR, et al. SNPing away at complex diseases: analysis of single-nucleotide polymorphisms around APOE in Alzheimer disease. Am J Hum Genet. 2000. August;67(2):383–394. S0002-9297(07)62649-4 [pii]. PubMed PMID: 10869235; PubMed Central PMCID: PMC1287185. eng. [DOI] [PMC free article] [PubMed] [Google Scholar]
- [24].Roses AD, Lutz MW, Amrine-Madsen H, et al. A TOMM40 variable-length polymorphism predicts the age of late-onset Alzheimer’s disease. Pharmacogenomics J. 2010. October;10(5):375–384. tpj200969 [pii]. PubMed PMID: 20029386; PubMed Central PMCID: PMC2946560. eng. [DOI] [PMC free article] [PubMed] [Google Scholar]
- [25].Juhasz G, Neufeld TP. Experimental control and characterization of autophagy in Drosophila. Methods Mol Biol. 2008;445:125–133. PubMed PMID: 18425447. [DOI] [PubMed] [Google Scholar]
- [26].Zhao X, Yang H, Liu W, et al. Sec22 regulates endoplasmic reticulum morphology but not autophagy and is required for eye development in Drosophila. J Biol Chem. 2015. March 20;290(12):7943–7951. PubMed PMID: 25670863; PubMed Central PMCID: PMC4367292. [DOI] [PMC free article] [PubMed] [Google Scholar]
- [27].Juhasz G, Hill JH, Yan Y, et al. The class III PI(3)K Vps34 promotes autophagy and endocytosis but not TOR signaling in Drosophila. J Cell Biol. 2008. May 19;181(4):655–666. jcb.200712051 [pii]. PubMed PMID: 18474623; PubMed Central PMCID: PMC2386105. eng. [DOI] [PMC free article] [PubMed] [Google Scholar]
- [28].Matsunaga K, Morita E, Saitoh T, et al. Autophagy requires endoplasmic reticulum targeting of the PI3-kinase complex via Atg14L. J Cell Biol. 2010. August 23;190(4):511–521. jcb.200911141 [pii]. PubMed PMID: 20713597; PubMed Central PMCID: PMC2928018. eng. [DOI] [PMC free article] [PubMed] [Google Scholar]
- [29].Scott RC, Schuldiner O, Neufeld TP. Role and regulation of starvation-induced autophagy in the Drosophila fat body. Dev Cell. 2004. August;7(2):167–178. S1534-5807(04)00245-X [pii]. PubMed PMID: 15296714; eng. [DOI] [PubMed] [Google Scholar]
- [30].Takats S, Nagy P, Varga A, et al. Autophagosomal Syntaxin17-dependent lysosomal degradation maintains neuronal function in Drosophila. J Cell Biol. 2013. May 13;201(4):531–539. jcb.201211160 [pii]. PubMed PMID: 23671310; PubMed Central PMCID: PMC3653357. eng. [DOI] [PMC free article] [PubMed] [Google Scholar]
- [31].DeVorkin L, Gorski SM. Monitoring autophagic flux using Ref(2)P, the Drosophila p62 ortholog. Cold Spring Harb Protoc. 2014. September 2;2014(9):959–966. 2014/9/pdb.prot080333 [pii]. PubMed PMID: 25183816; eng. [DOI] [PubMed] [Google Scholar]
- [32].Fang X, Zhou J, Liu W, et al. Dynamin regulates autophagy by modulating lysosomal function. J Genet Genomics. 2016. February 20;43(2):77–86. S1673-8527(15)00192-7 [pii]. PubMed PMID: 26924690; eng. [DOI] [PubMed] [Google Scholar]
- [33].Yu Z, Ren M, Wang Z, et al. Highly efficient genome modifications mediated by CRISPR/Cas9 in Drosophila. Genetics. 2013. September;195(1):289–291. genetics.113.153825 [pii]. PubMed PMID: 23833182; PubMed Central PMCID: PMC3761309. eng. [DOI] [PMC free article] [PubMed] [Google Scholar]
- [34].Yamamoto S, Jaiswal M, Charng WL, et al. A drosophila genetic resource of mutants to study mechanisms underlying human genetic diseases. Cell. 2014. September 25;159(1):200–214. S0092-8674(14)01113-1 [pii]. PubMed PMID: 25259927; PubMed Central PMCID: PMC4298142. eng. [DOI] [PMC free article] [PubMed] [Google Scholar]
- [35].Sandoval H, Yao CK, Chen K, et al. Mitochondrial fusion but not fission regulates larval growth and synaptic development through steroid hormone production. Elife. 2014. October 14:3 PubMed PMID: 25313867; PubMed Central PMCID: PMC4215535. eng DOI: 10.7554/eLife.03558 [DOI] [PMC free article] [PubMed] [Google Scholar]
- [36].Zhang K, Li Z, Jaiswal M, et al. The C8ORF38 homologue Sicily is a cytosolic chaperone for a mitochondrial complex I subunit. J Cell Biol. 2013. March 18;200(6):807–820. jcb.201208033 [pii]. PubMed PMID: 23509070; PubMed Central PMCID: PMC3601355. eng. [DOI] [PMC free article] [PubMed] [Google Scholar]
- [37].Sugiyama S, Moritoh S, Furukawa Y, et al. Involvement of the mitochondrial protein translocator component tim50 in growth, cell proliferation and the modulation of respiration in Drosophila. Genetics. 2007. June;176(2):927–936. genetics.107.072074 [pii]. PubMed PMID: 17435247; PubMed Central PMCID: PMC1894619. eng. [DOI] [PMC free article] [PubMed] [Google Scholar]
- [38].Pandey UB, Nie Z, Batlevi Y, et al. HDAC6 rescues neurodegeneration and provides an essential link between autophagy and the UPS. Nature. 2007. June 14;447(7146):859–863. nature05853 [pii]. [DOI] [PubMed] [Google Scholar]
- [39].Zhang S, Binari R, Zhou R, et al. A genomewide RNA interference screen for modifiers of aggregates formation by mutant Huntingtin in Drosophila. Genetics. 2010. April;184(4):1165–1179. genetics.109.112516 [pii]. PubMed PMID: 20100940; PubMed Central PMCID: PMC2865916. eng. [DOI] [PMC free article] [PubMed] [Google Scholar]
- [40].Zhang H, Baehrecke EH. Eaten alive: novel insights into autophagy from multicellular model systems. Trends Cell Biol. 2015. July;25(7):376–387. S0962-8924(15)00047-1 [pii]. PubMed PMID: 25862458; PubMed Central PMCID: PMC4475674. eng. [DOI] [PMC free article] [PubMed] [Google Scholar]
- [41].Katsuragi Y, Ichimura Y, Komatsu M. p62/SQSTM1 functions as a signaling hub and an autophagy adaptor. FEBS J. 2015. December;282(24):4672–4678. PubMed PMID: 26432171; eng. 10.1038/nature05853. PubMed PMID: 17568747; eng. [DOI] [PubMed] [Google Scholar]
- [42].Zhai RG, Zhang F, Hiesinger PR, et al. NAD synthase NMNAT acts as a chaperone to protect against neurodegeneration. Nature. 2008. April 17;452(7189):887–891. nature06721 [pii]. PubMed PMID: 18344983; PubMed Central PMCID: PMC3150538. eng. [DOI] [PMC free article] [PubMed] [Google Scholar]
- [43].Pickrell AM, Youle RJ. The roles of PINK1, parkin, and mitochondrial fidelity in Parkinson’s disease. Neuron. 2015. January 21;85(2):257–273. S0896-6273(14)01088-5 [pii]. PubMed PMID: 25611507; PubMed Central PMCID: PMC4764997. eng. [DOI] [PMC free article] [PubMed] [Google Scholar]
- [44].Durcan TM, Fon EA. The three ‘P’s of mitophagy: PARKIN, PINK1, and post-translational modifications. Genes Dev. 2015. May 15;29(10):989–999. 29/10/989 [pii]. PubMed PMID: 25995186; PubMed Central PMCID: PMC4441056. eng. [DOI] [PMC free article] [PubMed] [Google Scholar]
- [45].Nitz DA, Van Swinderen B, Tononi G, et al. Electrophysiological correlates of rest and activity in Drosophila melanogaster. Curr Biol. 2002. November 19;12(22):1934–1940. S0960-9822(02)01300-3 [pii]. PubMed PMID: 12445387; eng. [DOI] [PubMed] [Google Scholar]
- [46].Sink H, Rehm EJ, Richstone L, et al. sidestep encodes a target-derived attractant essential for motor axon guidance in Drosophila. Cell. 2001. April 6;105(1):57–67. S0092-8674(01)00296-3 [pii]. PubMed PMID: 11301002; eng. [DOI] [PubMed] [Google Scholar]
- [47].Suzuki K, Akioka M, Kondo-Kakuta C, et al. Fine mapping of autophagy-related proteins during autophagosome formation in Saccharomyces cerevisiae. J Cell Sci. 2013. June 1;126(Pt 11):2534–2544. PubMed PMID: 23549786. [DOI] [PubMed] [Google Scholar]
- [48].Kirkin V, Lamark T, Sou YS, et al. A role for NBR1 in autophagosomal degradation of ubiquitinated substrates. Molecular Cell. 2009. February 27;33(4):505–516. PubMed PMID: 19250911. [DOI] [PubMed] [Google Scholar]
- [49].Nagy P, Varga A, Kovacs AL, et al. How and why to study autophagy in Drosophila: it’s more than just a garbage chute. Methods. 2015. March;75:151–161. PubMed PMID: 25481477; PubMed Central PMCID: PMC4358840. [DOI] [PMC free article] [PubMed] [Google Scholar]
- [50].Ruan L, Zhou C, Jin E, et al. Cytosolic proteostasis through importing of misfolded proteins into mitochondria. Nature. 2017. March 16;543(7645):443–446. PubMed PMID: 28241148. [DOI] [PMC free article] [PubMed] [Google Scholar]
- [51].Ross CA, Poirier MA. Opinion: what is the role of protein aggregation in neurodegeneration? Nat Rev Mol Cell Biol. 2005. November;6(11):891–898. nrm1742 [pii]. PubMed PMID: 16167052; eng. [DOI] [PubMed] [Google Scholar]
- [52].Taylor JP, Hardy J, Fischbeck KH. Toxic proteins in neurodegenerative disease. Science. 2002. June 14;296(5575):1991–1995. 296/5575/1991 [pii]. PubMed PMID: 12065827; eng. [DOI] [PubMed] [Google Scholar]
- [53].Santos RX, Correia SC, Carvalho C, et al. Mitophagy in neurodegeneration: an opportunity for therapy? Curr Drug Targets. 2011. June;12(6):790–799. BSP/CDT/E-Pub/00227 [pii]. PubMed PMID: 21269269; eng. [DOI] [PubMed] [Google Scholar]
- [54].Yu Z, Ren M, Wang Z, et al. Highly efficient genome modifications mediated by CRISPR/Cas9 in Drosophila. Genetics. 2013;195:289–291. PubMed PMID: 23833182; PubMed Central PMCID: PMC3761309. [DOI] [PMC free article] [PubMed] [Google Scholar]
Associated Data
This section collects any data citations, data availability statements, or supplementary materials included in this article.