Abstract
Recent studies have shown that real-time, two-dimensional shear-wave elastography (2D-SWE) can monitor liver fibrosis by measuring tissue elasticity (i.e., elastic modulus). Two clinical studies of 2D-SWE in the liver have shown that there are several practical issues that can compromise quantitation of liver tissue elasticity. Both general ultrasound (US) limitations and limitations in the 2D-SWE method itself resulted in significant variability in estimated liver elasticity. The most common US limitations were: poor acoustic window, limited penetration, and rib/lung shadows. The most common 2D-SWE limitations were: reverberations under the liver capsule, respiratory/cardiac motion, and vessel pulsation/loss of SWE signal. Based on these studies, scan protocols have been optimized to minimize the influence of these limitations on liver elasticity quantification. These refined protocols should move non-invasive SWE closer to becoming the preferred tool to diagnose and manage many chronic diseases of the liver.
Electronic supplementary material
The online version of this article (doi:10.1007/s13534-017-0028-1) contains supplementary material, which is available to authorized users.
Keywords: Fibrosis, Shear-wave elasticity imaging, Acoustic radiation force, Shear modulus, Shear-wave speed, Liver stiffness
Introduction
In patients with chronic viral hepatitis, quantifying the extent of liver fibrosis is important in deciding when to start treatment and, subsequently, assess treatment response [1, 2]. Liver biopsy remains the gold standard to evaluate fibrosis even though it has severe limitations in terms of cost, patient pain, sampling error, as well as intra- and interobserver variability in diagnostic accuracy [3]. Moreover, severe complications have been reported. Given these limitations, assessing liver stiffness with noninvasive ultrasound elastography has gained much interest.
Liver elasticity (i.e., elastic modulus) generally increases as scar replaces normal tissue. Elasticity can be probed non-invasively using a number of image-based techniques [4–13]. Thus, there is the potential to replace serial biopsy with noninvasive elastography to monitor liver fibrosis. This hypothesis has been extensively tested for more than a decade using a number of ultrasound-based techniques well-suited to the liver.
Shear-wave elastography measures the velocity of elastic shear waves launched in liver parenchyma by an external mechanical force. Shear-wave speed is directly related to the elastic shear modulus of a medium according to the expression:
| 1 |
where μ is the local shear modulus, V s is the local shear wave propagation speed, and ρ is the mass density. In nearly incompressible soft tissue, such as the liver, the Young’s elastic modulus, E, is simply three times the shear modulus (i.e., E = 3μ = 3ρV2s). Thus, tissue elasticity can be directly computed in a region from the reconstructed shear-wave velocity in that region.
Transient elastography (TE) (Echosens, Paris, France) was the first ultrasound method available to assess liver elasticity by launching shear waves at the skin surface via a mechanical push. It has entered clinical practice in Europe [4–6, 9]. Several studies have shown significant positive correlation between TE and the stage of liver fibrosis [4–6]. A key limitation in clinical practice, however, is the high rate of uninterpretable results, approximately 20% of cases according to the largest series to date [6].
Shear-wave elastography was commercially introduced in 2009 on the Aixplorer ultrasound system (SuperSonic Imagine S.A., Aix-en-Provence, France) and has now become available on many high-end ultrasound scanners [12, 13]. Unlike TE, however, ultrasound scanners can launch internal shear waves using acoustic radiation force (ARF) [12–20]. Point-shear wave elastography (point-SWE) provides a single point estimate of a small region of liver tissue and has been implemented by a few ultrasound manufacturers [13]. However, modern two-dimensional (2D) shear-wave elastography (SWE) systems can estimate shear-wave speed and, therefore, Young’s modulus on a pixel-by-pixel basis using displacement images acquired immediately after an ultrasound push pulse launches a propagating shear wave. This technology can produce non-invasive, quantitative maps of liver fibrosis that have partially replaced serial biopsy as the preferred method to monitor parenchymal liver disease such as fibrosis related to chronic hepatitis C (CHC) and other chronic liver diseases [13].
2D-SWE may be ideally suited to serial monitoring of liver fibrosis and has demonstrated better performance than TE [8]. However, its predictive value can be compromised by several practical considerations. For example, patient body habitus can influence 2D-SWE-based liver stiffness measurements [8]. 2D-SWE has the advantage over TE and point-SWE approaches in enabling the user to potentially visualize, identify and avoid SWE artifacts described here, possibly improving liver tissue stiffness measurement reliability and reproducibility. In this study, we explore potential sources of artifact in 2D-SWE of the liver and discuss how they can be minimized in routine clinical scans.
Methods
The results presented here come from two separate studies. The first was part of a single-center, cross-sectional study [8]. From June 2010 through January 2012, all consecutive patients with confirmed CHC scheduled for liver biopsy at the Infectious Diseases Department of the Policlinico San Matteo at the University of Pavia (Pavia, Italy) were enrolled. Inclusion criteria were the presence of hepatitis C virus RNA in blood serum and, at least transiently, elevated serum alanine aminotransferase (ALT) levels. Patients with human immunodeficiency virus (HIV) coinfection and those under treatment were excluded from enrolment. This series of patients was part of an accuracy study described in [8]. The second was a single-center study not yet published. From September 2010 through December 2011, liver transplant patients receiving biopsy in the Department of Radiology at the University of Washington (Seattle, Washington) were recruited to additionally have 2D-SWE performed before biopsy.
Patient characteristics, epidemiological data, and biochemical tests were recorded. Liver biopsy was performed on the same day as real-time 2D-SWE as a day-case procedure. At the University of Pavia, all real-time 2D-SWE measurements were performed by G.F. At the University of Washington, all real-time 2D-SWE measurements were performed by O.K. Real-time 2D-SWE studies were performed using the Aixplorer US system with a convex broadband probe (SC6-1). The study protocols were approved by each institution’s ethics committees. All participants gave their informed written consent. This study was not sponsored by any manufacturer.
Shear waves are launched within the liver using acoustic radiation force generated by focused, long-duration US pulses [14]. A series of push pulses creates nearly plane shear waves in the imaging plane propagating over a region of interest. The shear-wave speed is then estimated using a Doppler-like acquisition sequence over the region of interest [14–20]. This estimate at each point within the region can be used with Eq. (1), and the simple relationship between shear and Young’s moduli, to compute the Young’s elastic modulus (often called the elasticity) in kilo-Pascal (kPa) at each point. Modulus estimates are then color-coded, creating a quantitative 2D-SWE image of either the estimated shear-wave speed or tissue elasticity (kPa) displayed in box form over a conventional B-mode image.
The size and position of the 2D-SWE image is user adjustable, enabling a tradeoff between frame rate and extent of view. In this study, we used a 3.5 × 2.5 cm 2D-SWE box. 2D-SWE measurements were performed through intercostal spaces on the right lobe of the liver with the patient lying in the supine position and the right arm in maximal abduction. The patient was then asked to stop their breath at a point in the respiratory cycle where a uniform region of liver tissue was in the scan plane. An optimal acoustic window was obtained by quickly tilting the probe in the intercostal space to maximize B-mode brightness during the breath hold. The 2D-SWE mode was then enabled, where 4–5 frames were acquired before freezing to produce a temporally stable 2D-SWE elasticity estimate.
Properly placing the 2D-SWE box within liver parenchyma is critical for accurate estimates of liver elasticity. As discussed below, several potential artifacts can be minimized with proper box placement. Liver elasticity was estimated from the average Young’s modulus over a circular ROI (2 cm in diameter) within the 2D-SWE box, when scanning conditions permitted. It was reduced in diameter if limitations in viable signal within the 2D-SWE box prohibited a 2-cm diameter. Measurements were classified as failed when little or no signal was obtained in the 2D-SWE box. Because of temporal persistence, the displayed 2D-SWE image and measurements represent a few time-averaged frames (typically three). The entire real-time 2D-SWE examination lasted approximately 5 min per patient. SWE images were acquired in the left lobe of a subset of patients to assess potential difficulties in acquiring consistent results in both lobes of the liver.
The following five features were assessed for each acquisition: the presence of reverberation artifact beneath the liver capsule within the 2D-SWE acquisition box; the loss of 2D-SWE signal with increasing depth; the absence of contiguous signal within the 2D-SWE acquisition box; the presence of a vessel within the 2D-SWE acquisition box; and lastly the presence of a vessel in the 2D-SWE acquisition box impacting the size and/or placement of the measurement ROI. The percentage that each 2D-SWE feature occurred is calculated and reported for each study group. The percentage of failed measurements is also reported for each study group. A failed measurement had one or multiple 2D-SWE features described above preventing the placement of a measurement ROI.
Results
Based on measurements from 81 subjects, representing a subset of patients from the University of Pavia study [8] and 51 subjects from the University of Washington, a number of potential artifact sources were identified for 2D-SWE of the liver. Four to eight acquisitions were recorded for each subject in both studies. Both general US limitations and limitations in the 2D-SWE method itself resulted in significant variability in estimated liver elasticity. The most common US limitations were: poor acoustic window, limited penetration, and rib/lung shadows. The most common 2D-SWE limitations were: reverberations under the liver capsule, respiratory/cardiac motion, and vessel pulsation/loss of the SWE signal. Table 1 lists the frequency of occurrence for each limitation within each study. The percentages reported in Table 1 were relative to the total number of measurements made within each study.
Table 1.
Five features assessed for each 2D-SWE acquisition. The percentage that each 2D-feature occurred is calculated and reported here for each study group
| Failed measure (%) | Reverb (%) | Penetration (%) | Acoustic window (%) | Vessel presence (%) | Vessel impacting ROI (%) | |
|---|---|---|---|---|---|---|
| Site A | 30.4 | 39.2 | 16.9 | 19.9 | 92.6 | 42.0 |
| Site B | 2.2 | 6.4 | 2.0 | 5.8 | 95.5 | 68.4 |
Figure 1 illustrates the two types of vessel SWE artifacts impacting the ROI measurement size and placement reported in the last column of Table 1. The first being the pulsations surrounding the branches of the portal vein and the second being SWE signal drop-out within the vessel, forcing reduced measurement size and placement. SWE signal drop-out within the vessel is due to the blood being non-viscous and not supporting shear waves. As a result, the placement and size of the measurement ROI were altered to avoid the vessel and minimize both the pulsatility artifact and SWE signal drop-out (Fig. 1).
Fig. 1.
2D-SWE of right lobe of the liver, where the size and diameter of the ROI is limited by vessel pulsation, vessel drop-out and an acoustic shadow to the right of the image as seen on B-mode
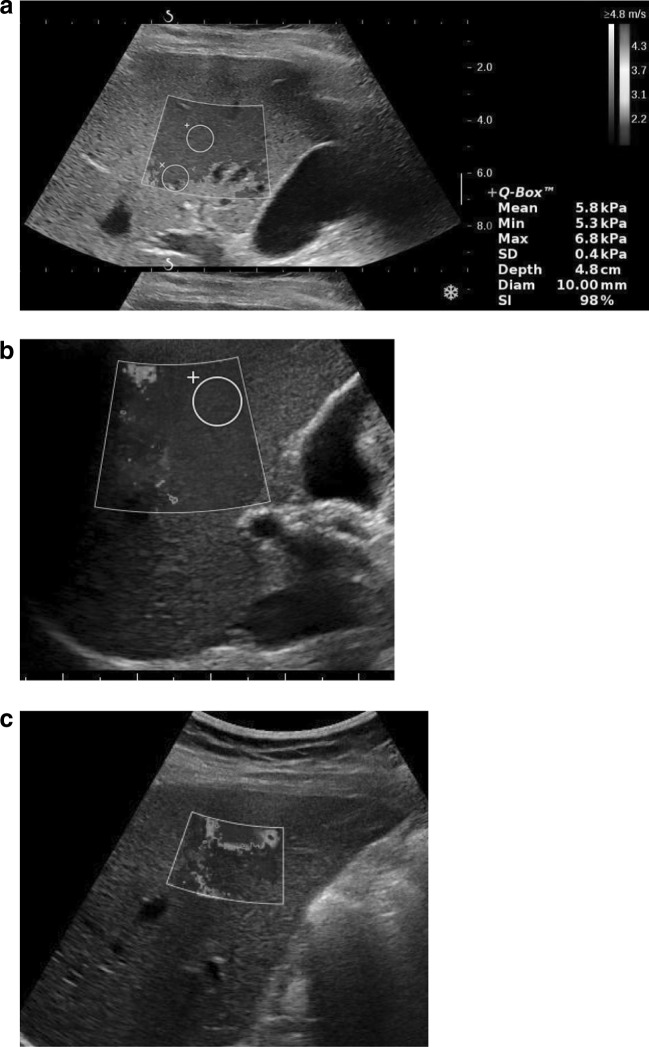
Figure 2 presents several typical 2D-SWE images of the right lobe of the liver. Clearly, there are issues with penetration in Fig. 2a, as consistent elasticity estimates cannot be obtained near the bottom of the SWE acquisition box. The most consistent modulus estimates are generally obtained near the elevational focus of the transducer, as the largest displacements are generated here by the push pulses [21–23].
Fig. 2.
Three 2D-SWE images illustrating: a limitation in depth and dropout from vessels, b lateral rib shadow, and c combination of reverberation below liver capsule up to the limit of penetration, possibly affected by proximal fascial tissue shadowing
The effect of rib/lung shadowing is show in Fig. 2b. Here, the rib shadows a significant region along the left side of the box. Because a well-defined push beam, as well as robust detection beams, cannot be formed in this region, modulus estimates are highly variable. The measurement ROI must be positioned away from this region to obtain more reliable modulus estimates, as show in this figure.
Cardiac motion and reverberations become a significant problem in trying to obtain 2D-SWE images in the left lobe of the liver, as illustrated in Fig. 2c. Here reverberations corrupt the entire upper part of the SWE box, producing erroneous estimates. Deeper in the box, shadowing greatly reduces the intensity of the push beam and, consequently, yields highly variable elasticity values. Clearly, no useful measurements can be obtained when artifacts are this significant. The results shown in Fig. 2c would be considered a failed study.
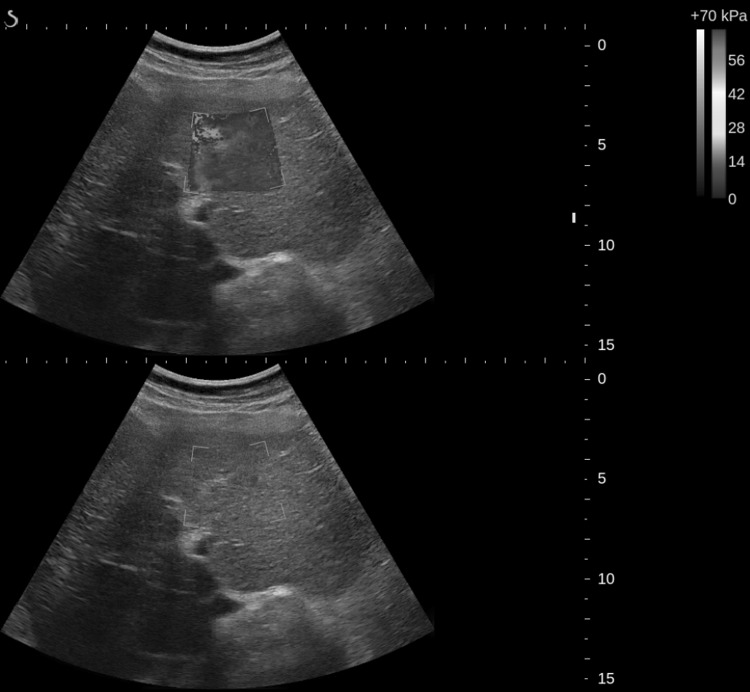
Current SWE guidelines recommend avoiding measurements in the left lobe of the liver [9]. The images presented in Fig. 3 show three consecutive 2D-SWE frames in a real-time sequence in the left lobe with cardiac and respiratory motion. A real-time movie associated with this case is also included as part of supplementary materials (MOVIE). As noted above, data are temporally filtered so that each display frame represents a time average of about 4–5 data acquisition frames. Clearly, the modulus varies significantly from frame to frame due to significant tissue motion over the averaging period. It is hard to find a stable ROI for quantitative elasticity estimation given this level of motion.
Fig. 3.
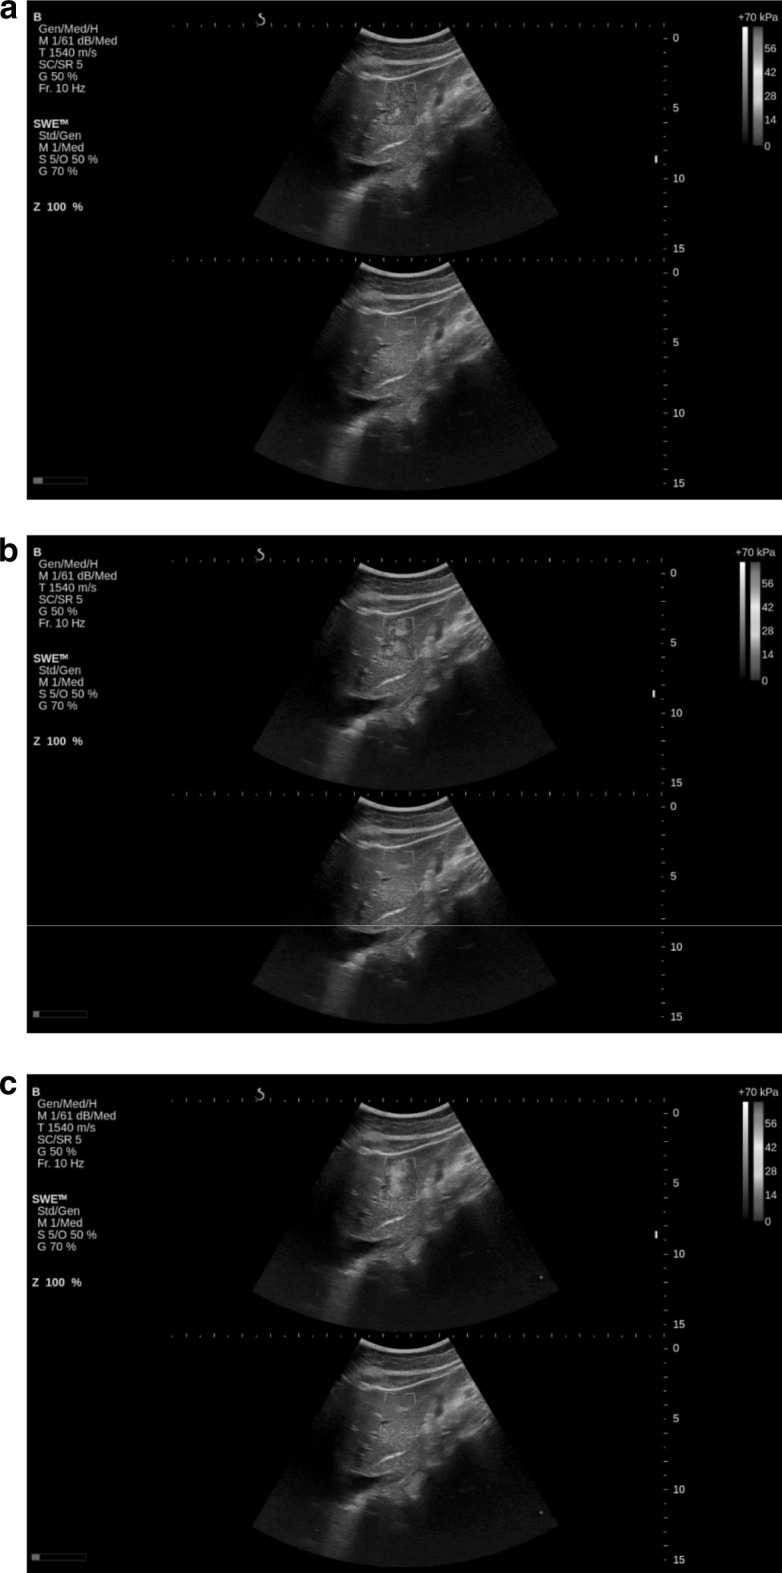
Three consecutive 2D-SWE images in time illustrating temporal variations from cardiac pulsations in the left lobe of the liver
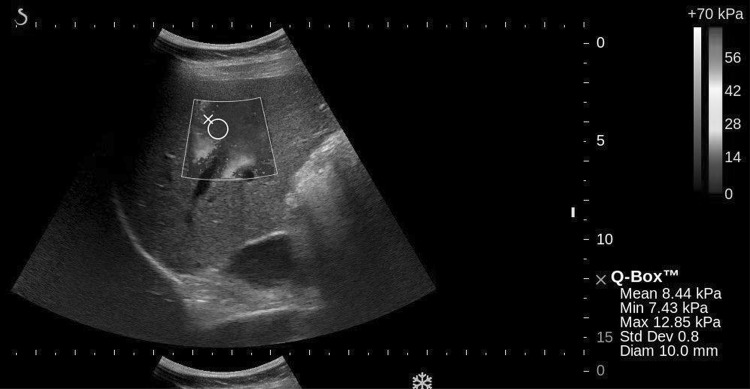
Finally, localized motion near a major blood vessel can also significantly influence 2D-SWE images. Figure 4 illustrates a situation where the reverberation SWE artifact combined with both vessel SWE artifacts significantly restricts ROI placement and forces it to be reduced in size to 10 mm. Here, real-time modulus estimates near the vessel at the bottom of the SWE box change significantly from frame to frame due to induced local motion from vessel pulsatility. Unlike global tissue motion, this motion is localized so that there may still be regions within the SWE box that produce fairly stable elasticity estimates. The combination of reverberation and vessel SWE artifacts along with limitations in penetration can result in failed exams in larger and more difficult to scan patients. These observations, as well as those related to the results in Figs. 2 and 3, suggest an optimal data acquisition strategy for clinical measurements, as discussed in the next section.
Fig. 4.
2D-SWE image illustrating restricted ROI placement between reverberations below the liver capsule and a vessel
Discussion
Using the results from clinical cross-sectional studies of 2D-SWE imaging in the liver, we have identified several sources of significant artifacts that may limit the quantitative reliability of elasticity estimates for CHC detection and treatment management. As presented in Figs. 1, 2, 3 and 4, both general US limitations and 2D-SWE limitations can produce significant variation in elasticity estimates. Limited penetration and reverberations appear to be the most important because they affect both push-beam quality and the reliability of displacement estimates. Reverberations can sometimes greatly increase measurement depths, pushing ROIs closer to penetration limits at depths where larger vessels have more pulsatile artifacts. Motion artifacts related to breathing and pulsatile vessel motion are also substantial, especially for measurements on the left lobe, but they can be minimized for measurements on the right lobe with proper positioning of both the SWE box and the ROI used for quantitative elasticity estimates. Due to the complications described in acquiring SWE liver stiffness estimates in the left lobe, the literature and clinical use have focused on the right lobe and the manufacturer of the Aixplorer system recommends use only in the right lobe [9].
In larger and difficult to scan patients, the interplay of limited penetration, reverberation and vessels together can combine to contribute to bias and failed measurements. If measurements must be made adjacent to vessels, especially portal, the risk of bias and variability increases. Vessels influenced the placement and size of the measurement ROI for a substantial number of cases in both studies. In particular, 49% of acquisitions in one study and 68% in the other required that ROI placement and size be adjusted to avoid tissue near a vessel.
Larger vasculature was observed to impact surrounding liver tissue stiffness estimates in two ways. First, the increased stiffness of the portal vessel wall itself can bias estimates, as illustrated in Fig. 5 where the modulus appears much higher near the wall. In addition, pulsatility associated with vessel wall motion leads to variable modulus estimates (e.g., Fig. 1). Overall, the extent of reverberations and vessel SWE artifacts can be difficult to assess and visualize, leading to measurement bias and variability.
Fig. 5.
2D-SWE image illustrating out of plane vessel pulsations and increase in tissue elasticity surrounding the portal vein
These observations lead to a protocol to minimize artifacts in measurements on the right lobe, yielding more reliable quantitative liver elasticity estimates to better diagnose and manage CHC using 2D-SWE. In particular, real-time B-Mode imaging can help guide placement of the SWE box and real-time 2D-SWE images can help visually assess the consistency of elasticity estimates with time to minimize motion artifacts.
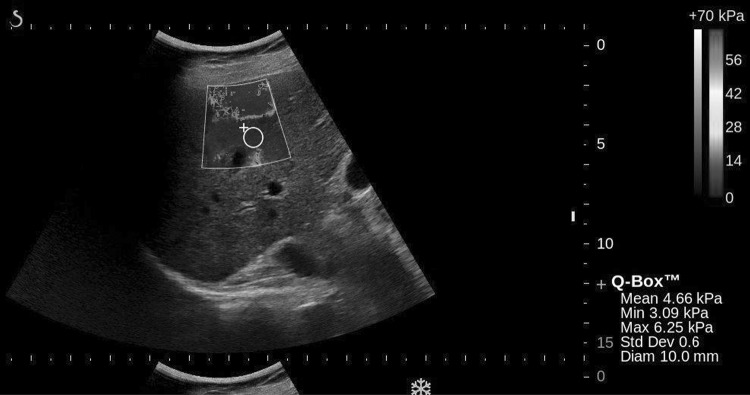
In the first step of the protocol, the B-Mode image is used to find a homogeneous liver region at least 2 cm beyond the capsule and spanning the elevational focal zone of the transducer. Acoustic access is continuously adjusted until the B-Mode brightness is maximized for both capsule echoes and speckle over the continuous liver region. The SWE box is then placed in a homogeneous region clear of major vessels such that a large area within the box does not exhibit pulsatile changes in estimated elasticity. Finally, the ROI for elasticity quantitation is placed in a region as close to the elevational focus as possible while maintaining a stable mean estimate with time. An example, of a 2D-SWE exam using this approach, is presented in Fig. 6, where both stable and repeatable measurements were obtained.
Fig. 6.
2D-SWE illustrating a region of tissue where three reliable independent measurements were made of a patient with F3 fibrosis
Recent clinical studies are beginning to show that 2D-SWE measurements can be more reliable if artifacts of the type described above are minimized. For example, by identifying artifacts and avoiding them, 2D-SWE was shown superior in diagnostic performance to TE in a large, prospective clinical study looking at liver elasticity in nonalcoholic fatty liver disease using a data acquisition strategy paralleling the one described here [24]. Indeed, using real-time B-Mode and 2D-SWE images to reduce possible artifacts and optimally guide data acquisition should move non-invasive elastography closer to becoming the preferred tool to diagnose and manage many chronic diseases of the liver. Guidelines for the use of ultrasound 2D-SWE in assessing liver fibrosis state the potential for improved performance over TE. However, these same guidelines note that more studies are needed to confirm early findings [9].
Our two studies found marked differences in the rate of occurrence of artifacts and failed measurements. The site A study consisted of 2D-SWE measurements in liver transplant patients having a mean BMI of 29 ± 7. The site B study consisted of 2D-SWE measurements of CHC patients with a mean BMI of 25.5 ± 3.8, representing a statistically significant reduction in BMI compared to the site A study (p < 0.05). In addition to imaging a more challenging patient population (i.e., higher BMI), the site A study was it’s first exposure to liver elastography as well as being a smaller cohort. Remaining air in the abdomen was visualized in two patients following transplant, but did not impact 2D-SWE measurements. In contrast, site B’s 2D-SWE measurements were performed with previous TE and liver elastography experience both from clinical use and research. It is likely these two factors, experience and patient population, contributed to the marked difference in 2D-SWE artifacts and failed measurements encountered between the two sites.
Although the technique has not changed, improvements both by the manufacturer of the equipment used in this study and others have been made since these two studies were performed. A key advancement has been the implementation by several manufacturers of either quality maps or indices to inform the user that a successful tissue stiffness estimate has been obtained. In addition, improvements in probe technologies, system architectures and processing have improved the penetration and robustness of 2D-SWE to image a broader range of difficult patients. The ultrasound system used in these two studies, the Aixplorer system, was the first to implement 2D-SWE for liver stiffness measurements and thus has the most literature both validating and describing it’s use [25].
In summary, two clinical studies of 2D-SWE in the liver have shown that there are several significant sources of artifact that can compromise quantitation of liver tissue elasticity. The primary ones have been identified and scan protocols have been optimized to minimize their influence on liver elasticity quantification. These refined protocols should move non-invasive 2D-SWE closer to becoming the preferred tool to diagnose and manage many chronic diseases of the liver.
Electronic supplementary material
Below is the link to the electronic supplementary material.
Acknowledgements
This work was supported in part by NIH RO1EB016034, R01CA170734, R01HL121226, RO1HL125339, R01EY026532, and Life Sciences Discovery Fund 3292512. We also thank Jeff Thiel and Manjiri Dighe of the University of Washington, for assistance in capturing clinical data.
References
- 1.Ghany MG, Strader DB, Thomas DL, Seeff LB, American Association for the Study of Liver Diseases Diagnosis, management, and treatment of hepatitis C: an update. Hepatology. 2009;49(4):1335–1374. doi: 10.1002/hep.22759. [DOI] [PMC free article] [PubMed] [Google Scholar]
- 2.American Association for the Study of Liver Diseases; Infectious Diseases Society of America. [Accessed 16 Feb 2017]; Recommendations for testing, managing, and treating hepatitis C. http://www.hcvguidelines.org. Published 2016. [DOI] [PMC free article] [PubMed]
- 3.Bedossa P, Dargere D, Paradise V. Sampling variability of liver fibrosis in chronic hepatitis C. Hepatology. 2003;38:1449–1457. doi: 10.1016/j.hep.2003.09.022. [DOI] [PubMed] [Google Scholar]
- 4.Castera L, Pinzani M, Bosch J. Noninvasive evaluation of portal hypertension using transient elastography. J Hepatol. 2012;56:696–703. doi: 10.1016/j.jhep.2011.07.005. [DOI] [PubMed] [Google Scholar]
- 5.Ferraioli G, Tinelli C, Dal Bello B, Zicchetti M, Lissandrin R, Filice G, Filice C. Performance of liver stiffness measurements by transient elastography in chronic hepatitis. World J Gastroenterol. 2013;19(1):49–56. doi: 10.3748/wjg.v19.i1.49. [DOI] [PMC free article] [PubMed] [Google Scholar]
- 6.Castera Laurent. Noninvasive methods to assess liver disease in patients with hepatitis B or C. Gastroenterology. 2012;142(6):1293–1302. doi: 10.1053/j.gastro.2012.02.017. [DOI] [PubMed] [Google Scholar]
- 7.Barr RG, Ferraioli G, Palmeri ML, Ehmans RL, Goodman ZD, Myers R, Rubin J, Garra B, Garcia-Tsao G, Wilson SR, Rubens D, Levine D. Elastography assessment of liver fibrosis: Society of Radiologists in Ultrasound consensus conference statement. Radiology. 2015;276(3):845–861. doi: 10.1148/radiol.2015150619. [DOI] [PubMed] [Google Scholar]
- 8.Ferraioli G, Tinelli C, Dal Bello B, Zicchetti M, Filice G, Filice C, on behalf of the Liver Fibrosis Study Group Accuracy of real-time shear wave elastography for assessing liver fibrosis in chronic hepatitis C: a pilot study. Hepatology. 2012;56(6):2125–2133. doi: 10.1002/hep.25936. [DOI] [PubMed] [Google Scholar]
- 9.Ferraioli G, Filice C, Castera L, Choi BI, Sporea I, Wilson S, Cosgrove D, Dietrich CF, Amy D, Bamber JC, Barr R, Chou YH, Ding H, Farrokh A, Friedrich-Rust M, Hall TJ, Nakashima K, Nightingale KR, Palmeri ML, Schafer F, Shiina T, Suzuki S, Kudo M. WFUMB guidelines and recommendations on the clinical use of ultrasound elastography PART 3: liver. Ultrasound Med Biol. 2015;41(5):1161–1179. doi: 10.1016/j.ultrasmedbio.2015.03.007. [DOI] [PubMed] [Google Scholar]
- 10.Petitclerc L, Sebastiani G, Gilbert G, Cloutier G, Tang A. Liver fibrosis: review of current imaging and MRI quantification techniques. J Magn Reson Imaging. 2017;45(5):1276–95. [DOI] [PubMed]
- 11.Bert F, Stahmeyer JT, Rossol S. Ultrasound elastography used for preventive non-invasive screening in early detection of liver fibrosis. J Clin Med Res. 2016;8(9):650–655. doi: 10.14740/jocmr2625w. [DOI] [PMC free article] [PubMed] [Google Scholar]
- 12.Ferraioli G, Parekh P, Levitov AB, Filice C. Shear wave elastography for evaluation of liver fibrosis. J Ultrasound Med. 2014;33(2):197–203. doi: 10.7863/ultra.33.2.197. [DOI] [PubMed] [Google Scholar]
- 13.Friedrich-Rust M, Poynard T, Castera L. Critical comparison of elastography methods to assess chronic liver disease. Nat Rev Gastroenterol Hepatol. 2016;13(7):402–11. [DOI] [PubMed]
- 14.Bercoff J, Muller M, Tanter M, Fink M. Study of viscous and elastic properties of soft tissues using supersonic shear imaging. IEEE Ultrason Symp. 2003;1:925–928. [Google Scholar]
- 15.Deffieux T, Montaldo G, Tanter M, Fink M. Shear wave spectroscopy for in vivo quantification of human soft tissues visco-elasticity. IEEE TMI. 2009;28(3):313–322. doi: 10.1109/TMI.2008.925077. [DOI] [PubMed] [Google Scholar]
- 16.Gennisson JL, Deffieux T, Fink M, Tanter M. Ultrasound elastography: principles and techniques. Diagn Interv Imaging. 2013;94:487–495. doi: 10.1016/j.diii.2013.01.022. [DOI] [PubMed] [Google Scholar]
- 17.Bercoff J, Chaffai S, Tanter M, Sandrin L, Catheline S, Fink M, Gennisson JL, Meunier M. In vivo breast tumor detection using transient elastography. Ultrasound Med Biol. 2003;29(10):1387–1396. doi: 10.1016/S0301-5629(03)00978-5. [DOI] [PubMed] [Google Scholar]
- 18.Sarvazyan AP, Rudenko OV, Swanson SD, Fowlkes JB, Emelianov SY. Shear wave elasticity imaging: a new ultrasonic technology of medical diagnostics. Ultrasound Med Biol. 1998;24(9):1419–1435. doi: 10.1016/S0301-5629(98)00110-0. [DOI] [PubMed] [Google Scholar]
- 19.Nightingale K, McAleavey S, Trahey G. Shear-wave generation using acoustic radiation force: in vivo and ex vivo results. Ultrasound Med Biol. 2003;29(12):1715–1723. doi: 10.1016/j.ultrasmedbio.2003.08.008. [DOI] [PubMed] [Google Scholar]
- 20.Bercoff J, Tanter M, Fink M. Supersonic shear imaging: a new technique for soft tissue elasticity mapping. IEEE Trans Ultrason Ferroelectr Freq Control. 2004;51(4):396–409. doi: 10.1109/TUFFC.2004.1295425. [DOI] [PubMed] [Google Scholar]
- 21.Hall TJ, Milkowski A, Garra B, Carson PL, Palmeri M, Nightingale K, Lynch T, Alturki A, Andre M, Audiere S, Bamber J, Barr RG, Bercoff J, Bercoff J, Bernal M, Brum J, Chan HW, Chen S, Cohen-Bacrie C, Couade M, Daniels AU, deWall RJ, Dillman JR, Ehman RL, Franchi-Abella SF, Fromageau J, Gennisson JL, Henry JP, Ivancevich N, Kalin J, Kohn S, Kugel JL, Lee KS, Liu NL, Loupas T, Mazernik J, McAleavey S, Miette V, Metz S, Morel BM, Nelson T, Nordberg E, Oudry J, Padwal M, Rouze N, Samir A, Sandrin L, Schaccitti J, Schmitt C, Shamdasani V, Song P, Switalski P, Wang M, Wear K, Xie H, Zhao H. RSNA/QIBA: Shear wave speed as a biomarker for liver fibrosis staging. Prague: IEEE International Ultrasonics Symposium; 2013. [Google Scholar]
- 22.Song P, et al. Two-dimensional shear-wave elastography on conventional ultrasound scanners with time-aligned sequential tracking (TAST) and comb-push ultrasound shear elastography (CUSE) IEEE Trans Ultrason Ferroelectr Freq Control. 2015;62(2):290–302. doi: 10.1109/TUFFC.2014.006628. [DOI] [PMC free article] [PubMed] [Google Scholar]
- 23.Zhao H, Song P, Urban MW, Kinnick RR, Yin M, Greenleaf JF, Chen S. Bias observed in time-of-flight shear wave speed measurements using radiation force of a focused ultrasound beam. Ultrasound Med Biol. 2011;37(11):1884–1892. doi: 10.1016/j.ultrasmedbio.2011.07.012. [DOI] [PMC free article] [PubMed] [Google Scholar]
- 24.Cassinotto C, Boursier J, de Ledinghen V, Lebigot J, Lapuyade B, Cales P, Hiriart J-B, Michalak S, Le Bail B, Cartier V, Mouries A, Oberti F, Fouchard-Hubert I, Vergniol J, Aube C. Liver stiffness in nonalcoholic fatty liver disease: a comparison of supersonic shear imaging, FibroScan, and ARFI with liver biopsy. Hepatology. 2016;63(6):1817–1827. doi: 10.1002/hep.28394. [DOI] [PubMed] [Google Scholar]
- 25.European Federations of Societies for Ultrasound in Medicine and Biology; [Accessed 28 March 2017]; EFSUMB Guidelines and Recommendations on the Clinical Use of Ultrasound Elastography. http://www.efsumb.org/guidelines/guidelines-elastography.asp. Published 2017.
Associated Data
This section collects any data citations, data availability statements, or supplementary materials included in this article.


