Abstract
Data from magnetoencephalography (MEG) and electroencephalography (EEG) suffer from a rather limited signal-to-noise-ratio (SNR) due to cortical background activities and other artifacts. In order to study the effect of the SNR on the size and distribution of dipole clusters reconstructed from interictal epileptic spikes, we performed simulations using realistically shaped volume conductor models and extended cortical sources with different sensor configurations. Head models and cortical surfaces were derived from an averaged magnetic resonance image dataset (Montreal Neurological Institute). Extended sources were simulated by spherical patches with Gaussian current distributions on the folded cortical surface. Different patch sizes were used to investigate cancellation effects from opposing walls of sulcal foldings and to estimate corresponding changes in MEG and EEG sensitivity distributions. Finally, white noise was added to the simulated fields and equivalent current dipole reconstructions were performed to determine size and shape of the resulting dipole clusters. Neuronal currents are oriented perpendicular to the local cortical surface and show cancellation effects of source components on opposing sulcal walls. Since these mostly tangential aspects from large cortical patches cancel out, large extended sources exhibit more radial components in the head geometry. This effect has a larger impact on MEG data as compared to EEG, because in a spherical head model radial currents do not yield any magnetic field. Confidence volumes of single reconstructed dipoles from simulated data at different SNRs show a good correlation with the extension of clusters from repeated dipole reconstructions. Size and shape of dipole clusters reconstructed from extended cortical sources do not only depend on spike and timepoint selection, but also strongly on the SNR of the measured interictal MEG or EEG data. In a linear approximation the size of the clusters is proportional to the inverse SNR.
Keywords: Electroencephalography (EEG), Magnetoencephalography (MEG), Epileptic spikes, Equivalent current dipole (ECD), Dipole cluster, Signal-to-noise-ratio (SNR)
Introduction
Source reconstruction results from non-invasive magnetoencephalography (MEG) and electroencephalography (EEG) are often used in presurgical evaluations to guide the implantation of grid and depth electrodes in patients that suffer from focal epilepsy and are candidates for resective surgery [1–4]. Point-like equivalent current dipoles (ECD) are schematic oversimplifications of sources of the measured signals whereas epileptogenic cortical areas usually cover several square-centimeters [5–9]. Dipole clusters representing repeated source reconstructions from similar interictal spikes have been used to estimate size and shape of the extended cortical structures involved in the generation of epileptic discharges [2, 3, 10]. Both size and shape measures obviously depend on spike selection and on the reconstruction timepoint relative to the spike maximum. Sometimes timepoints on the rising slope at 50% of the maximum spike amplitude are chosen representing a compromise between the best Signal-to-Noise-Ratio (SNR) at the maximum and a possible propagation that could have happened after spike-onset during the early aspects of the spikes [11, 12]. If there is propagation the reconstruction results at the peak latency do not represent the most interesting location of the onset, however, due to the best SNR the most stable and reliable results can be achieved. Dipole reconstructions from earlier latencies with smaller SNR are more interesting but tend to be less reliable and stable.
In a simulation study we examined the effects of extended cortical source patches on MEG-fields and EEG-potentials and dipolar source reconstructions as well as the influence of the rather limited SNR of unaveraged spike-signals on size and shape of corresponding dipole clusters. First, we compared field and potential maps and the sensitivity of MEG magnetometers, planar gradiometers, an extended EEG 10/20 montage, and the combined modalities for extended cortical sources. Different magnetometer and gradiometer types were used in order to find systematic differences between them.
Next, dipole clusters at different Signal-to-Noise-Ratios (SNRs) were computed from an extended source located at the tip of the left temporal lobe for both MEG- and EEG-set-ups. Finally, we compared the extent of a dipole cluster from 20 interictal temporal lobe EEG spikes with a dipole cluster from the averaged spike signal with white noise added to achieve an SNR similar to the unaveraged data.
Methods
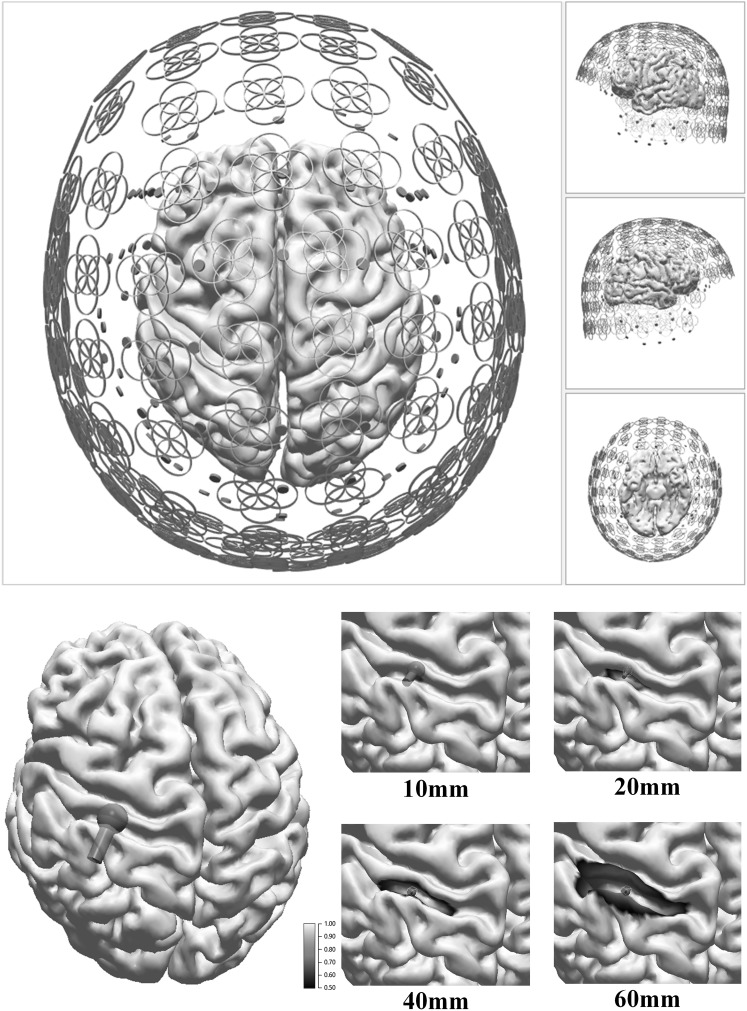
For the field/potential map and sensitivity studies from extended cortical sources we used the sensor geometry of an Elekta Neuromag TRIUX MEG-system with 102 magnetometers and 2 × 10² crossed planar first order gradiometers, an extended EEG 10/20 montage with 81 electrodes, and the combined modalities. A realistically shaped boundary element method (BEM) head model with three compartments (6685 nodes overall: skin 1968, outer skull 1771, inner skull 2946 nodes [13]), derived from the averaged, T1-weighted MRI (Montreal Neurological Institute [14]), was used and sources on the folded cortical surface (30,381 nodes, mean node distance 2.8 mm) with spatial Gaussian intensity profiles [15, 16] were investigated. A patch is composed of dipolar sources at the nodes of the triangulated cortical surface mesh with orientation perpendicular to the local surface. Figure 1 displays the sensor set-up and the cortical surface with different patch sizes (0–60 mm diameter) for a source location in the left central sulcus area. Temporal aspects of the typical spike-wave complexes other than the different SNRs at the rising slope of the spikes were not considered.
Fig. 1.
Upper row Experimental set-up with schematic MEG-(coils) and EEG-sensors (pellets). Lower row Cortical surface segmented from T1-weighted MRI and cortical extended sources in the left central sulcus area with diameter 0, 10, 20, 40, 60 mm-area: 0, 1, 3, 13, 28 cm2 (FWHM areas as indicated by the color coded surfaces). The pole symbols show the corresponding ECD reconstructions. (Color figure online)
Relative sensitivities of the different MEG- and EEG-sensor configurations were computed for extended patches centered at all cortical nodes [17]. The overall source strengths (integrated over the curved area of the cortical patch) were kept constant for all patch diameters and thus normalized to point-like sources (0 mm diameter). Mean global field power values representing the standard deviations of the signals were calculated and finally averaged over all 30,381 cortical positions as a function of the source diameter.
As an example for dipole clusters from realistically shaped extended sources, a patch with 30 mm diameter (7 cm2 area) at the tip of the left temporal lobe was used, white noise was added and field/potential maps for different SNRs were computed. For these simulations the geometry of a 248 channel MEG system (4D Neuroimaging, first order axial gradiometers) and an EEG montage with 44 electrodes were used. 200 repetitions with random noise were performed and ECDs were fitted for SNRs in the range of 3.7 to 12 and compared to the noise-free scenario and confidence ellipsoids [18] for an SNR of 6 were estimated. In order to take care of the different number of sensors of the MEG and EEG set-ups, the SNRs were weighted by the square root of the sensor-count. The SNRs represent the amplitude ratios of the simulated field or voltage signals averaged over all channels.
Finally, from a 26 channel EEG recording, 20 spikes were detected by a template matching algorithm and 20 ECDs were fitted at the peak latencies to form a dipole cluster at the tip of the left temporal lobe. A similar BEM model as above was used for this example. For comparison, a dipole cluster was computed from 20 repetitions by adding white noise to the averaged spike signal in order to achieve a comparable SNR (~6) as estimated from the ongoing EEG-recording.
All data and image processing, simulations, and source reconstructions were performed with the CURRY 8 software package (Compumedics USA, Charlotte, NC, USA).
Results
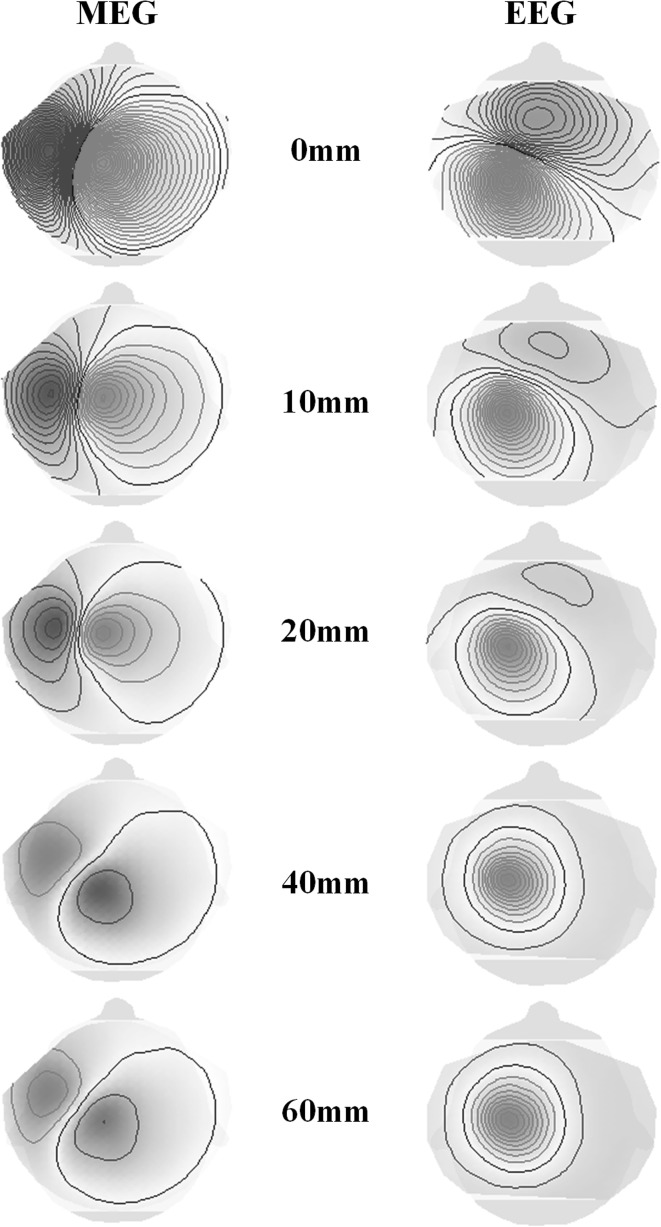
With increasing patch diameter, cancellation of tangentially oriented sources on opposing sulcal walls leads to a more and more radial orientation (with respect to the head surface) of the overall activity and decreasing MEG- and EEG-sensitivities [17]. From a purely tangential, point-like source in the left central sulcus area, the EEG-maps change from a tangential to a radial source map, whereas the MEG-fields show decreasing intensities and even a polarity inversion for larger source diameters happens in this example (between 20 and 40 mm). The combined MEG- and EEG-ECD reconstructions for increasing patch sizes in this case show increasing radial dipole components and decreasing dipole strengths as can already be seen from the MEG-fields and EEG-potentials (Figs. 1, 2).
Fig. 2.
Field maps of magnetometers (MEG) and EEG potential maps for increasing cortical patch sizes (0–60 mm, compare Fig. 1). Contour line increments: 0.2 fT and 0.005 µV respectively. (Color figure online)
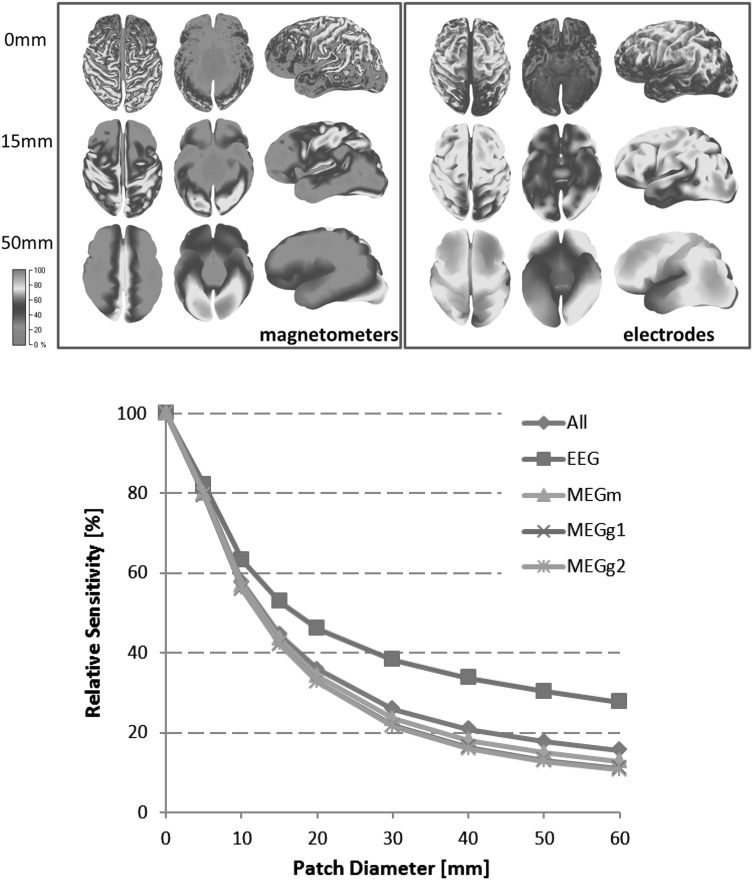
The relative sensitivities of the different MEG- and EEG-sensor configurations averaged over all 30,381 cortical positions were computed as a function of the source diameter and normalized to point-like sources are displayed in Fig. 3. MEG is most sensitive to tangential sources in superficial sulcal walls and less sensitive to radial components at the gyri and deeper sources. EEG reveals a more homogeneous sensitivity being most sensitive to radial components on the superficial gyri.
Fig. 3.
Upper row Sensitivity maps for MEG and EEG for three different cortical patch diameters (0, 15, and 50 mm-area: 0, 2, 20 cm2) (top, bottom, and left side views), color scale in percent. Lower row Averaged relative sensor sensitivities normalized to point-like sources for increasing patch sizes for EEG, magnetometers (MEGm) and gradiometers (MEGg) and combined modalities (All). (Color figure online)
Figure 3 visualizes that signals from larger patches show a smaller gain due to cancellation of tangential components on opposing sulcal walls. The increasing source area overcompensates this effect and leads to increasing MEG- and EEG-signals for larger patches. The patch position on the cortical surface strongly influences the signal, however, on average an increase in diameter from 10 to 20 mm (0.8–3.1 cm2) leads to an amplitude increase by a factor 2.4 for the MEG and 2.9 for the EEG instead of the geometrical factor of 4. An increase from 10 to 40 mm (0.8–12.6 cm2) leads to a factor of 5.1 (MEG) and 8.9 (EEG) instead of 16. Due to the larger number of MEG sensors the combination of MEG and EEG only slightly improves the averaged MEG-sensitivities.
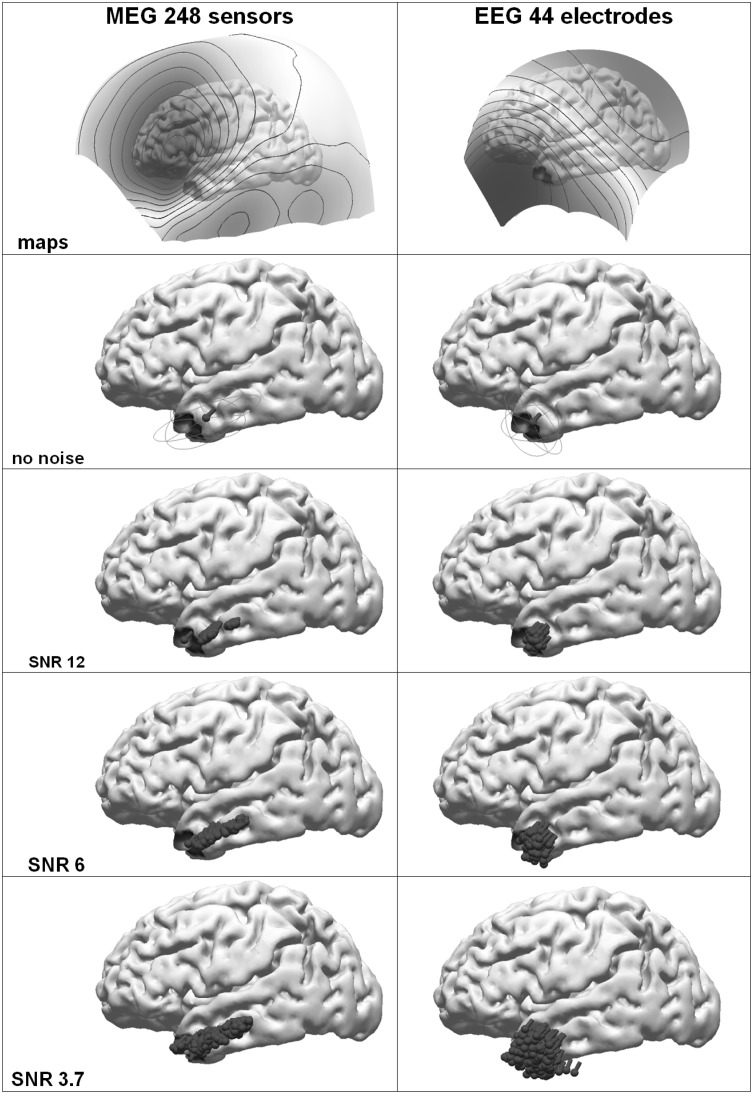
As an example for dipole clusters from extended sources on realistically shaped cortical surfaces, a 30 mm diameter patch (7 cm2) in the left temporal lobe area was used and field/potential maps were computed. White noise was added to better simulate measured data. Figure 4 shows the field and potential maps for MEG and EEG together with the patch and the ECD reconstructions for different SNRs. In the noise-free case all 200 dipoles localize at the same position since of course the input fields/potentials do not change. The point-like sources localize more posteriorly in the white matter as compared to the real patch position.
Fig. 4.
Dipole clusters from an extended cortical patch (diameter 30 mm, area 7 cm2, FWHM area indicated by color coding similar to Fig. 1) at the tip of the left temporal lobe with different Signal-to-Noise-Ratios. Left MEG (248 gradiometer coils), right EEG (44 electrodes). Top to bottom Potential/field maps, contour line increments: 100 fT and 3 µV respectively, ECDs (no noise, confidence ellipsoid for SNR 6), and dipole clusters for different SNRs (200 repetitions). (Color figure online)
Confidence ellipsoids for an SNR of 6 show a more isotropic, spherical shape for the EEG as compared to the MEG, where an elongation in the anterior-posterior direction along the zero-field direction can be seen. This means, that the source location is less stable in that direction as compared to the direction connecting positive and negative field extrema. With increasing noise, the dipole clusters reveal an increasing spread, the EEG-clusters cover a more symmetric volume and the MEG-clusters exhibit a more elongated shape as expected from the confidence ellipsoid. In a linear approximation, the lengths of the axes of the ellipsoids are proportional to the inverse of the SNR [18].
The comparison between an ECD-cluster from 20 epileptic spikes (timepoints at the peak latencies) and a cluster computed by adding noise (20 repetitions) to the computed forward potential map of the ECD reconstructed from the average of all spikes shows a very similar behavior (Fig. 5). The underlying potential distribution in the second case without noise is of course always the same and would lead to the same ECD without any scatter.
Fig. 5.
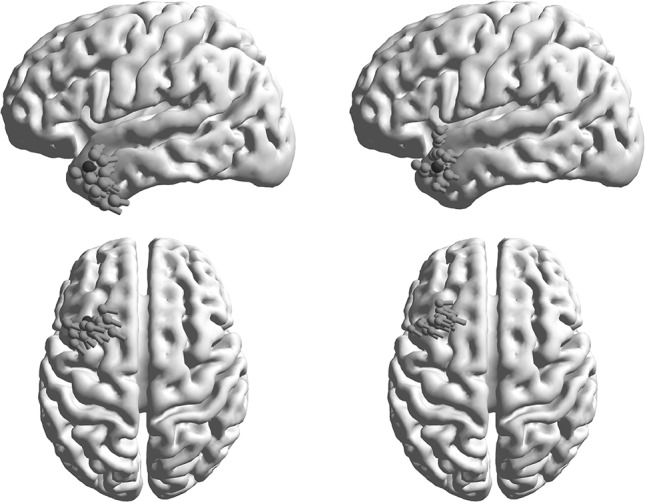
Comparing dipole clusters from 20 left temporal lobe EEG-spikes (left) and ECD reconstructions from averaged spike dipole data with noise added to achieve a similar SNR (20 repetitions, right). Cortical surfaces are shown in left and top perspectives, ECDs are overlaid as green, brighter pole symbols, the ECD from the averaged spikes is displayed as a darker, red pole. (Color figure online)
Discussion and conclusions
In the almost spherical head geometry MEG is sensitive to tangential dipole components only and in the example of a source in the central sulcus area shown in Fig. 2 by chance even a field reversal transition occurred when increasing the patch diameter from 20 and 40 mm, indicating that tangential components from different walls of the central sulcus ‘survive’ cancellation at these patch sizes. In comparison, the EEG potential maps change from tangential to radial patterns with decreasing field strengths, revealing the dominant radial components of the larger patch sizes. The normalized overall sensitivity for extended sources decreases with the patch size due to cancellation effects of tangential components for both MEG and EEG. However, EEG is more sensitive to the remaining radial aspects and thus increasing source sizes have a larger effect on MEG than on EEG [19].
Due to cancellation, the detectable signals increase slower than expected from increasing patch areas. For patches larger than 40 mm in diameter the relative sensitivity for EEG is about twice as large as for MEG on average. Of course there is a strong dependency on where the sources are located in the gray matter layer of the cortical surface. Gyri with more radial orientations are always better visible by EEG, tangential sources in superficial sulci are better visible by MEG in general [20].
Fitting point-like dipoles to fields or potentials from extended sources leads to different localizations for MEG and EEG (Fig. 4). Due to the different sensitivities of MEG for radial and tangential current components as compared to the more homogeneous orientational sensitivity of EEG, EEG localizes closer to the center of the activated patch, where MEG localizes the tangential aspects of the extended sources only.
Temporal phase shifts between MEG- and EEG-signals can also be explained by the source orientation specific sensitivity properties of the different measuring modalities. If the EEG leads the MEG, a radial source component appears first followed by propagation or increasing area with tangential aspects. If both MEG and EEG are in phase, tangentially oriented areas are involved and a possible synchronous radial aspect could also contribute and be seen in the EEG. If MEG leads the EEG, a tangential component appears first, followed by propagation or increasing area with radial aspects. Weak tangential EEG-components may be hidden in background activity from radially oriented sources that are suppressed by the MEG [19].
With decreasing SNR repeated ECD-fits show an increasing scatter and lead to increasing dipole clusters with different size and shape, depending on the modality and the area of the cortical source. In the example with an extended source at the tip of the left temporal lobe, both MEG and EEG localize posteriorly to the original source location. EEG shows a more symmetric cluster distribution, MEG exhibits larger posterior displacements and the dipole results are less stable along the anterior-posterior direction of the MEG zero field line.
Finally, an example comparing ECDs from several epileptic spikes originating from the left temporal lobe area and from the averaged spike signal with white noise added show very similar looking dipole clusters, so neglecting the role of the SNR can result in misleading interpretations. If the same extended area without noise or background activity is repeatedly activated, always the same point-like dipole would result without any scatter. Noise/background activity or activation of different aspects of the epileptic zone lead to distributed dipole clusters, however, size and shape depend on the SNR, the used modality, the position, shape and extend of the cortical source patch. Spike selection and the time-point used for dipole reconstruction of course also strongly influence the ECD-cluster. If for example, latencies at 50% of the spike maxima are used to avoid propagation effects [11, 12], the cluster size from the reduced SNR would double in a linear approximation [18].
Compliance with ethical standards
Conflict of interest
The CURRY software used in this submission is a commercial product of Compumedics USA, Charlotte, NC, USA. The authors of this paper are employees of Compumedics Germany GmbH, Hamburg, Germany. Both Compumedics Germany GmbH and Compumedics USA are subsidiaries of Compumedics Ltd., Melbourne, Australia.
References
- 1.Knowlton RC, Razdan SN, Limdi N, Elgavish RA, Killen J, Blount J, et al. Effect of epilepsy magnetic source imaging on intracranial electrode placement. Ann Neurol. 2009;65:716–723. doi: 10.1002/ana.21660. [DOI] [PMC free article] [PubMed] [Google Scholar]
- 2.Murakami H, Wang ZI, Marashly A, Krishnan B, Prayson RA, Kakisaka Y, Mosher JC, Bulacio J, Gonzalez-Martinez JA, Bingaman WE, Najm IM, Richard C, Burgess RC, Alexopoulos AV. Correlating magneto-encephalography to stereo-electroencephalography in patients undergoing epilepsy surgery. Brain. 2016;139:2935–47. [DOI] [PMC free article] [PubMed]
- 3.El Tahry R, Wang ZI, Kakisaka Y, Murakami H, Shibata S, Krishnan B, Kotagal P, Alexopoulos A, Burgess RC. A single tight MEG cluster may only represent a fragment of type I FCD. Clin Neurophysiol. 2016;127:2570–2572. doi: 10.1016/j.clinph.2016.04.007. [DOI] [PubMed] [Google Scholar]
- 4.Iwasaki M, Nakasato N, Shamoto H, Nagamatsu K, Kanno A, Hatanaka K, et al. Surgical implications of neuromagnetic spike localization in temporal lobe epilepsy. Epilepsia. 2002;43:415–424. doi: 10.1046/j.1528-1157.2002.30801.x. [DOI] [PubMed] [Google Scholar]
- 5.Cooper R, Winter AL, Crow HJ, et al. Comparison of subcortical, cortical and scalp activity using chronically indwelling electrodes in man. Electroencephalogr Clin Neurophysiol. 1965;18:217–228. doi: 10.1016/0013-4694(65)90088-X. [DOI] [PubMed] [Google Scholar]
- 6.Baumgartner C, Barth DS, Levesque MF, Sutherling WW. Detection of epileptiform discharges on magnetoencephalography in comparison to invasive measurements. In: Hoke M, Erne SN, Okada YC, Romani GL, editors. Biomagnetism: clinical aspects. Amsterdam: Elsevier; 1992. pp. 67–71. [Google Scholar]
- 7.Mikuni N, Nagamine T, Ikeda A, et al. Simultaneous recording of epileptiform discharges by MEG and subdural electrodes in temporal lobe epilepsy. Neuroimage. 1997;5:298–306. doi: 10.1006/nimg.1997.0272. [DOI] [PubMed] [Google Scholar]
- 8.Oishi M, Otsubo H, Kameyama S, et al. Epileptic spikes: magnetoencephalography versus simultaneous electrocorticography. Epilepsia. 2002;43:1390–1395. doi: 10.1046/j.1528-1157.2002.10702.x. [DOI] [PubMed] [Google Scholar]
- 9.Tao JX, Ray A, Hawes-Ebersole S, Ebersole JS. Intracranial EEG substrates of scalp EEG interictal spikes. Epilepsia. 2005;46:669–676. doi: 10.1111/j.1528-1167.2005.11404.x. [DOI] [PubMed] [Google Scholar]
- 10.Vadera S, Jehi L, Burgess RC, Shea K, Alexopoulos AV, Mosher J, Gonzalez-Martinez J, Bingaman W. Correlation between magnetoencephalography-based “clusterectomy” and postoperative seizure freedom. Neurosurg Focus. 2013;34:E9. doi: 10.3171/2013.4.FOCUS1357. [DOI] [PubMed] [Google Scholar]
- 11.Lantz G, Spinelli L, Seeck M, de Peralta Menendez RG, Sottas CC, Michel CM. Propagation of interictal epileptiform activity can lead to erroneous source localizations: a 128-channel EEG mapping study. J Clin Neurophysiol. 2003;20:311–319. doi: 10.1097/00004691-200309000-00003. [DOI] [PubMed] [Google Scholar]
- 12.Ray A, Tao JX, Hawes-Ebersole SM, Ebersole JS. Localizing value of scalp EEG spikes: a simultaneous scalp and intracranial study. Clin Neurophysiol. 2007;118:69–79. doi: 10.1016/j.clinph.2006.09.010. [DOI] [PubMed] [Google Scholar]
- 13.Fuchs M, Kastner J, Wagner M, Hawes S, Ebersole JS. A standardized boundary element method volume conductor model. Clin Neurophysiol. 2002;113:702–712. doi: 10.1016/S1388-2457(02)00030-5. [DOI] [PubMed] [Google Scholar]
- 14.Fonov VS, Evans AC, McKinstry RC, Almli CR, Collins DL. Unbiased nonlinear average age-appropriate brain templates from birth to adulthood. Neuroimage. 2009;47:S102. doi: 10.1016/S1053-8119(09)70884-5. [DOI] [Google Scholar]
- 15.Wagner M, Kohler T, Fuchs M, Kastner J. An extended source model for current density reconstructions. In: Nenonen J, Ilmoniemi RJ, Katila T, editors. Biomag 2000: proceedings of the 12th international conference on biomagnetism. Finland: Helsinki University of Technology; 2001. pp. 749–752. [Google Scholar]
- 16.Fuchs M, Wagner M, Kastner J. Development of volume conductor and source models to localize epileptic foci. J Clin Neurophysiol. 2007;24:101–119. doi: 10.1097/WNP.0b013e318038fb3e. [DOI] [PubMed] [Google Scholar]
- 17.Ahlfors SP, Han J, Lin FH, Witzel T, Belliveau JW, Hämäläinen MS, Halgren E. Cancellation of EEG and MEG signals generated by extended and distributed sources. Hum Brain Mapp. 2010;31(1):140–149. doi: 10.1002/hbm.20851. [DOI] [PMC free article] [PubMed] [Google Scholar]
- 18.Fuchs M, Wagner M, Kastner J. Confidence limits of dipole source reconstruction results. Clin Neurophysiol. 2004;115:1442–1451. doi: 10.1016/j.clinph.2004.01.019. [DOI] [PubMed] [Google Scholar]
- 19.Ebersole JS, Ebersole SM. Combining MEG and EEG source modeling in epilepsy evaluations. J Clin Neurophysiol. 2010;27:360–371. doi: 10.1097/WNP.0b013e318201ffc4. [DOI] [PubMed] [Google Scholar]
- 20.Ebersole JS. Equivalent dipole modeling: a new EEG method for epileptogenic focus localization. In: Pedley TA, Meldrum BS, editors. Recent advances in epilepsy. 5. Edinburgh: Churchill Livingstone; 1991. pp. 51–72. [Google Scholar]


