Abstract
In this paper, we focus on classifying cardiac arrhythmias. The MIT-BIH database is used with 14 original classes of labeling which is then mapped into 5 more general classes, using the Association for the Advancement of Medical Instrumentation standard. Three types of features were selected with a focus on the time–frequency aspects of ECG signal. After using the Wigner–Ville distribution the time–frequency plane is split into 9 windows considering the frequency bandwidth and time duration of ECG segments and peaks. The summation over these windows are employed as pseudo-energy features in classification. The “subject-oriented” scheme is used in classification, meaning the train and test sets include samples from different subjects. The subject-oriented method avoids the possible overfitting issues and guaranties the authenticity of the classification. The overall sensitivity and positive predictivity of classification is 99.67 and 98.92%, respectively, which shows a significant improvement over previous studies.
Keywords: Cardiac arrhythmia, Classification, Decision tree, Ensemble learner, Time–frequency analysis, Wigner–Ville distribution
Introduction
Cardiac arrhythmias are group of heart conditions in which the electrical activities of the heart become irregular. Arrhythmias usually occur as a result of a malfunction in the conduction system or when a pulse is originated from where it wasn’t supposed to. Some arrhythmias can be extremely dangerous and some of them can happen in an everyday life of a healthy person. However, studies show that about 80% of sudden cardiac death is the result of ventricular arrhythmias. Thus, the early and accurate detection of arrhythmias is crucial [1].
Electrocardiogram (ECG) is the recording of the electrical activity of the heart which occurs almost periodically through each heartbeat. Thus, the ECG signal is an excellent source to identify arrhythmias. Some arrhythmias don’t show any persistent trace in the ECG signal and consequently a continuous monitoring of ECG is necessary for some cases. Detection and classification of different abnormalities in ECG has long been investigated by researchers in the field of biomedical signal processing. Our goal in this paper is to introduce a new prospective in cardiac arrhythmia detection and help to improve the classification process.
Notable works has been done in analyzing the time-domain features of ECG signal which include RR intervals, QT segments, QRS complexes and other morphological features [2–4]. On the other hand, the spectral domain offers a different insight and its parameters give a distinctive representation of signal which can be used for better diagnosis. Besides the subtle time-domain changes of some arrhythmias will have an evident impact on the ECG spectrum.
The most well-known tool for investigating a signal in frequency domain is the Fourier Transform (FT), which in spite of a detailed frequency information, provides no link to the time domain. Meaning, one wouldn’t know when different frequencies of signal occur. Each arrhythmia is triggered in a specific part of the heart’s conduction system and each part of the ECG signal corresponds to a specific part of depolarization or repolarization, FT can’t provide the sufficient information for an accurate detection. This problem can be solved with the help of time–frequency (TF) techniques. Short-time Fourier transform (STFT) is a popular TF technique, could be used to compute the energy distribution of the ECG signal; the features are then extracted from the energy distribution and used in classification algorithms. There is a tradeoff in time and frequency resolutions in STFT, limiting authenticity of the features [5]. Wavelets resolve this issue by employing a time-scale resolution scheme for signal analysis. Papers adopting STFT and wavelet techniques for ECG signal processing and arrhythmia classifications report significant improvements compared to single domain studies [6–9].
As a supervised classification problem, many machine learning algorithms have been proposed in literature. Support vector machine (SVM) [7, 10, 11], self-organizing map (SOP) [12], artificial neural networks (ANNs) [6, 13], linear discriminant analysis (LDA) [2, 14], conditional random filed (CRF) [15], decision trees [16]. Using the same dataset and exploring various features and dimensionality reduction algorithms helps in forming a fast-evolving field for ECG arrhythmia classification.
In this paper, we propose the use of time–frequency windowing for pseudo-energy feature extraction and then employ an ensemble of decision trees for classification. The results show that our proposed method is a more effective method in the analysis and classification of ECG signals.
The paper is organized as follows; Sect. 2 has the background materials, in Sect. 3 we introduce our method. Section 4 provides the classification results and the paper is concluded in Sect. 5.
Background
Higher order statistics
The conventional lower (first and second) order statistics are well-known in the field of bio-signal processing. However, for nonlinear signals the lower order statistics are not sufficient for a proper representation. Hence the third and fourth order statistics respectively known as skewness and kurtosis are proven to be useful by many papers [9, 10, 16, 17].
For a random variable, , the third and fourth order statistics are defined as,
| 1 |
in which denoted the expected value. Skewness provides a measurement of the lopsidedness of the distribution and kurtosis gives a relative measurement of the signal’s distribution with a Gaussian distribution of the same variance. These higher order statistics can be estimated as,
| 2 |
where ’s are realizations of the random variable and and are the estimates of the mean and variance respectively.
Wigner–Ville distribution
Wigner–Ville distribution (WVD) is a simple form of the Cohen’s class of bilinear time–frequency representations with a wide use in various applications. The WVD of the signal with zero mean is defined as:
| 3 |
where is the complex conjugate of .
In an ideal case, the WV distribution has an infinite resolution in time and frequency domains because of the absence of averaging over any finite time duration [18].
Ensemble learners
An ensemble of learners is a method for supervised classification which uses a combination of various weak learners to form a strong one. A weak learner is defined as a classifier which can label the results only a slightly better than a random guess. These weak learners are combined by different methods such as weighted sum or majority voting. The important issue in constructing an ensemble learner is the diversity among the weak learners, because combining same weak learners would give us no gain. The diversity can be achieved by different representations of the train set, called bagging (bootstrap aggregating) [19]. Bagging was introduced in 1984 by Breiman [19] and is the most common bootstrap ensemble method. In order to achieve diversity in bagging, each weak learner is trained using a random subset of the main train samples. Given the train set for our supervised classifier, bagging generates new training sets by sampling uniformly from . with replacement. These new bootstrap samples each are different from the original set, yet they resemble it in dtribution and variability and are used to train the weak learners. The weak learners are then combined by voting to form the classifier [20–22].
Methods
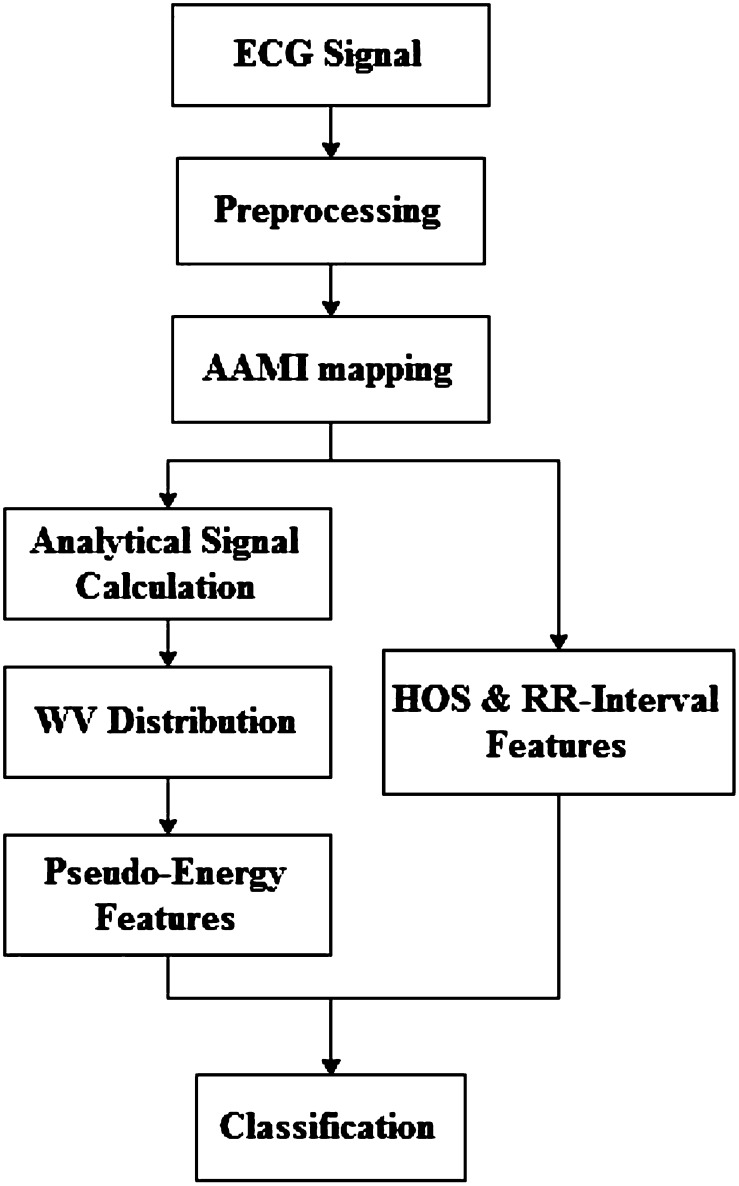
In this section, we introduce the methodology used in the paper. First, we talk about our dataset and then we follow the overall processing steps as illustrated in Fig. 1. After preprocessing, which is baseline wandering removal and beat segmentation, we extract three sets of features, RR-interval, time–frequency and higher order statistical features. These features are then fed into a classifier which is the final part of the algorithm.
Fig. 1.
Flowchart of the proposed algorithm
Dataset
We have used the MIT-BIH arrhythmia dataset [23] in our study, which includes various common and life-threatening arrhythmias. The database has 48 ECG recordings, each 30 min long, consisting two leads. For 45 recordings, the first lead is modified lead II (MLII) and for the rest it is modified lead V5. The second lead is a pericardial lead (V1 for 40 of them, V2, V4 or V5 for the others). In this paper only the first lead of the database has been used. The original labeling of the dataset has 14 classes of different rhythms listed as in Table 1. However, the Association for the Advancement of Medical Instrumentation (AAMI) [24, 25] recommends 5 more general classes of rhythms as follows. “N” beats originated from the sinus node, “S”, supraventricular ectopic beats, “V”, ventricular ectopic beats, “F”, fusion beats and “Q”, unclassified beats. This standard is adopted by many papers such as [2, 6–8, 11, 14–16, 26]. The mapping from the 14 original labels to AAMI standard labels are shown in Table 2. The heartbeat arrhythmia classification is most commonly viewed as a supervised classification problem. Thus, in random division of the train and test sets it is highly possible that the heartbeats from the same subject would appear in both sets and having correlated samples in both sets would cause overfitting and lead to promising results which are unreachable in practice. To avoid this problem a “subject-oriented” method is introduced in [2] which uses a patient-based division of the dataset, so a more realistic classifier can be trained using this scheme. The train and test sets for this method are shown respectively as DS1 and DS2 in Table 2. Using this scheme our results will be comparable with other arrhythmia classification algorithms such as [11, 14–16].
Table 1.
MIT-BIH arrhythmia database information (AAMI-approved data only)
| Heartbeat type | Anna | Total # | |
|---|---|---|---|
| Normal rhythm | NOR | N | 74,068 |
| Left bundle branch block | LBBB | L | 8066 |
| Right bundle branch block | RBBB | R | 7246 |
| Atrial premature contraction | APC | A | 2513 |
| Premature ventricular contraction | PVC | V | 6897 |
| Aberrated atrial premature beat | AP | a | 150 |
| Ventricular flutter wave | VF | ! | 472 |
| Fusion of ventricular and normal beat | VFN | F | 802 |
| Non-conducted P-wave (blocked APC) | BAP | x | 193 |
| Nodal (junctional) escape beat | NE | j | 229 |
| Ventricular escape beat | VE | E | 106 |
| Nodal (junctional) escape beat | NP | J | 83 |
| Atrial escape beat | AE | e | 16 |
| Unclassified beat | UN | Q | 17 |
| Total | 100,858 |
aAnnotation that is used for each arrhythmia in the database
Table 2.
AAMI recommended labeling with training set (DS1) and testing set (DS2) used in subject-oriented scheme
| AAMI class | MIT-BIH class | Total # |
|---|---|---|
| N | NOR, LBBB, RBBB, AE, NE | 89,625 |
| S | APC, AP, BAP, NP | 2939 |
| V | PVC, VE, VF | 7475 |
| F | VFN | 802 |
| Q | UN | 17 |
| DS1 | 101, 106, 108, 109, 112, 114, 115, 116, 118, 119, 122, 124, 201, 203, 205, 207, 208, 209, 215, 220, 223, 230 | |
| DS2 | 100, 103, 105, 111, 113, 117, 121, 123, 200, 202, 210, 212, 213, 214, 219, 221, 222, 228, 231, 232, 233, 234 | |
Data preprocessing
The MIT-BIH arrhythmia dataset is band-pass filtered at 0.1–100 Hz and then digitized at 360 samples per second [23]. We have removed the baseline wandering of these signals using two stages of median filtering as proposed by [27].
The MIT-BIH database also includes an annotation file associated with each sample. This file has the information about the type of the rhythms and the occurrence sample of the major local maxima for each individual heartbeat.
Beat segmentation
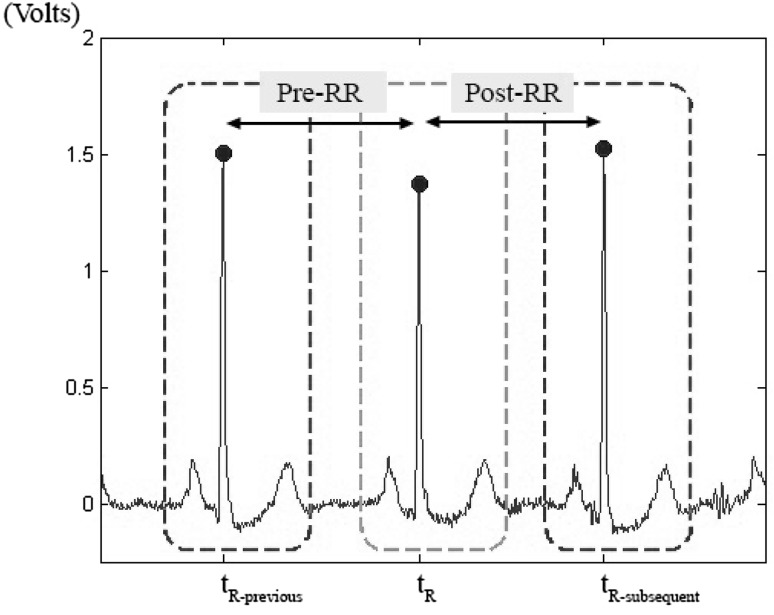
We use the annotation files as our reference in beat segmentation. The local maximums of each heartbeat (R peaks for most of cases) are extracted from the annotation files and a fixed number of samples before and after each R peak is defined for beat segmentation. While [11] uses 100 samples before R peaks and 200 samples after R peaks (total of 0.83 s), [16] selects 235 total samples (0.25 s before and 0.40 s after R peaks). Since we are using 2-dimensional time–frequency representations we choose the total amount of 256 samples (102 samples before R peaks and 153 after that) to ease the computational processes. A sample of beat segmentation is shown in Fig. 2.
Fig. 2.
Short sample from “101 m.mat” showing the beat segmentation and Pre-RR and Post-RR features
Feature extraction
In this section we introduce the features we have used in classification. Time–frequency characteristics of ECG signals along with the RR interval and statistical features are extracted for classification.
RR interval features
In this paper, we have used two RR-interval features as the only representatives of the time domain traits of the signal. The time distance between respective R peaks bare indispensable information about the subjects’ health and consequently the type of the rhythms. “RR variability” or “heart rate variability (HRV)” are the clinical terms used to investigate changes in the occurrence time of the R peaks which indicates the importance of these time domain features. RR based features are very popular in cardiac arrhythmia classifications and are used in various papers such as [2, 6, 8, 10–12, 14–16, 28].
Two RR based features are extracted as pre-RR and post-RR. Pre-RR is defined as the time distance between the R peak of the current heartbeat with the R peak of previous one; and the post-RR is defined as the same distance for the current and the subsequent heartbeats. Pre-RR and post-RR features are shown in Fig. 2 for a sample heartbeat.
HOS features
We have used three higher order statistical (HOS) features because they have proven to be less sensitive to the morphological changes of signal [29]. In addition, the nonlinear nature of these features can help in better highlighting the dynamic aspects of ECG signal [30]. Skewness, kurtosis and 5th order moment of each signal is extracted and put into the feature vector.
Time–frequency features
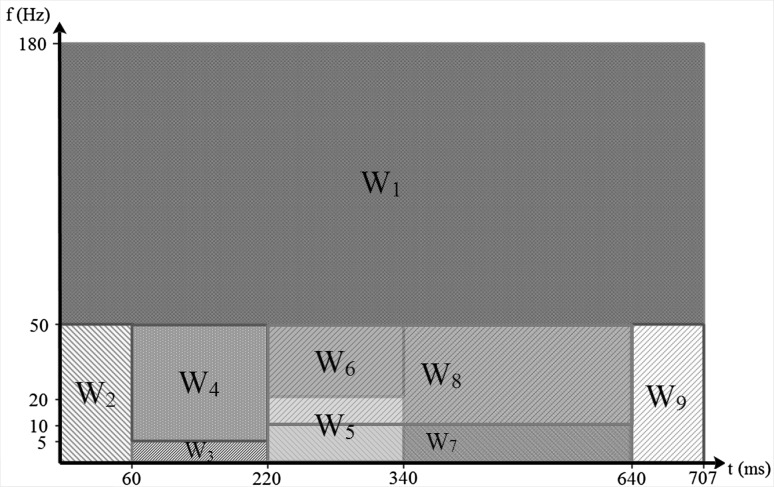
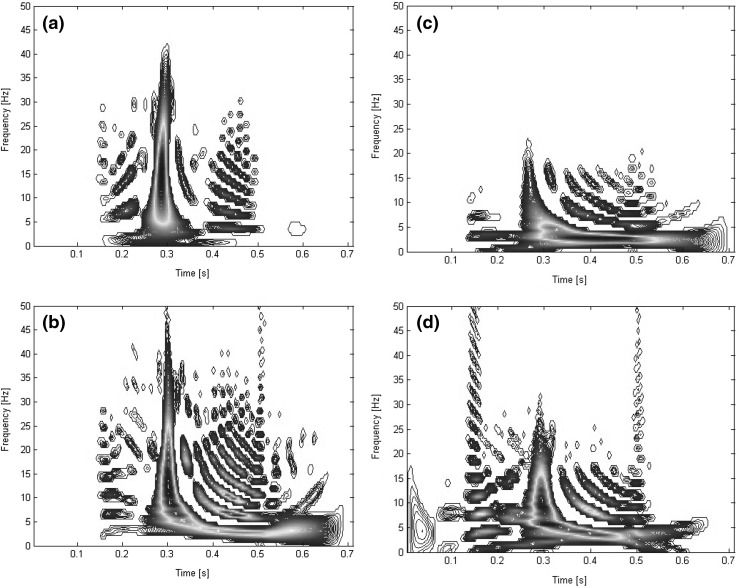
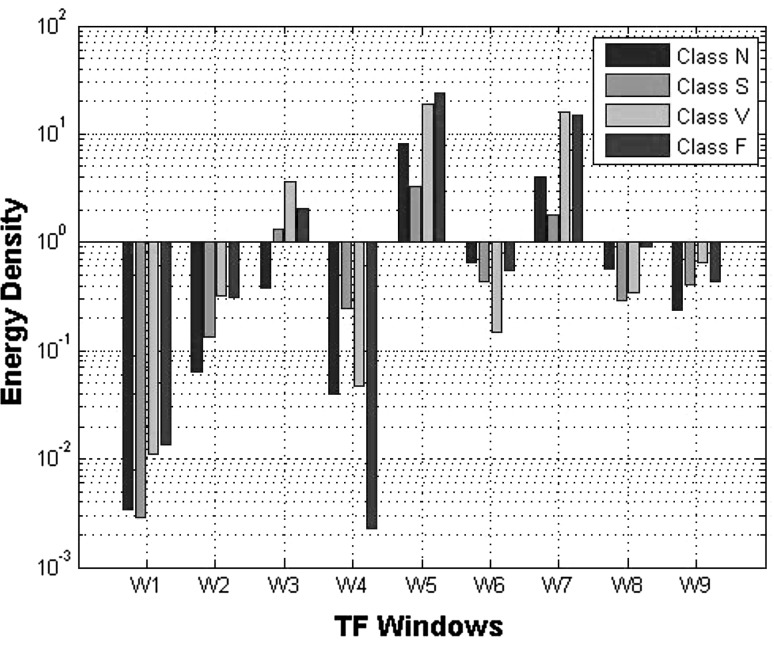
We have used Wigner–Ville distribution to get a time–frequency representation of signal and extract pseudo-energy features. Each signal is represented as a matrix after using Eq. (3) and is summed over 9 windows as shown in Fig. 3. covers the high frequency i.e. frequencies higher than 50 Hz. is over the beginning part of the signal before the potential PR segment; is a window of 62 ms width over frequencies lower than 50 Hz. . and lie on the PR segment with 160 ms width and frequencies lower than 5 Hz and mid-frequency between 5 and 50 Hz. P and T waves have most of their energies over the frequency band lower than 5 Hz and that is why we have considered two windows over this time period. and cover the potential occurrence time of the QRS complex with 120 ms width and with frequencies lower and higher than 20 Hz. and are over the QT segment with 420 ms long and frequency margin of 10 Hz. Finally, covers the part after the potential QT segment with frequencies lower than 50 Hz. Figure 4 illustrates three samples of WVD for each class of “N”, “S” and “V” with frequencies lower than 50 Hz.
Fig. 3.
Time–frequency windowing for feature extraction
Fig. 4.
Wigner–Ville distribution for a sample first lead (lead II) of a class N, b class S and c class V
The summation over each window provides a measure of energy during that time within the specific frequency range and can be a good feature for differentiating arrhythmias. Figure 5 shows the mean energy density for all 9 windows of four main rhymes in our trainset. Although the Wigner–Ville distribution is criticized for producing cross terms, the computational advantages it offers over the other methods such as Choi-Williams distribution are critical specially in a big database as MIT-BIH.
Fig. 5.
Mean of energy density for 4 windows and three main arrhythmia classes
It should be mentioned that in order to reduce the computational costs and avoid the cross terms between positive and negative frequencies the original signals are not used in WV distribution. First the analytical signals are calculated for each heartbeat then the WVD is used. Analytical signals have the same spectrum for positive frequencies and zero spectrum for the negative frequencies can be calculated as in Eq. (4)
| 4 |
where is the analytical signal, is the Hilbert transform and is the convolution symbol.
Classification results
As shown in Table 3 the total number of 100,858 heartbeats from five different AAMI-recommended groups of arrhythmia are used in classification. The test and train sets are selected as in Table 2, proposed by [2]. 14 extracted features are normalized and put into the feature vector for a supervised classification. An ensemble of 100 decision trees are combined in bagging scheme to form a stable and accurate classifier. By reducing the variance, bagging avoids overfitting problems. The prior probability for each class is set to 0.2; of course, better results can be achieved by setting prior probabilities proportional to the population of each class or unbalancing the misclassification cost in favor of life threatening arrhythmias. However, we didn’t want to involve any knowledge of class populations in the classification procedures.
Table 3.
Results of classification
| Class | Total # | Train | Test | Se (%) | Pp (%) |
|---|---|---|---|---|---|
| N | 89,625 | 45,807 | 43,818 | 99.79 | 99.14 |
| S | 2939 | 999 | 1940 | 94.28 | 95.96 |
| V | 7475 | 4257 | 3218 | 95.37 | 94.14 |
| F | 802 | 414 | 388 | 12.11 | 51.09 |
| Q | 17 | 8 | 9 | 100 | 100 |
| Total | 100,858 | 51,485 | 49,373 | 99.67 | 98.92 |
Performance metrics
Various approaches are adopted in literature to evaluate the classification results. In this paper, we have considered sensitivity and positive predictivity to compare the algorithm with previous studies. Sensitivity (Se) can be defined as the measure of successfully classified positive samples,
| 5 |
in which is the total number of misclassified positive samples and is the total number of correctly classified positive samples. Positive predictivity (Pp) measures success rate among samples classified as positive and can be defined as,
| 6 |
where is the total number of falsely classified negative samples.
Results
The results of classification are shown in Table 3 which has the total sensitivity and positive predictivity of 99.67 and 98.92%. The Table 4 illustrates the confusion matrix, the high amount of misclassified samples for class “F” is evident. However, there are only 693 misclassified beats in total which is 1.4% of the test set. Table 5 shows the overall results of our method compared with previous works. Only the results for three main classes of “N”, “S” and “V” are mentioned in papers so the and are compared for these classes. The proposed method shows a significant improvement of classification accuracy over our previous work [16] and other papers with same database, indicating the importance of TF role in ECG analysis.
Table 4.
Confusion matrix for the results
| Reference | Predicted results | ||||
|---|---|---|---|---|---|
| N | S | V | F | Q | |
| N | 43,726 | 42 | 6 | 44 | 0 |
| S | 41 | 1829 | 70 | 0 | 0 |
| V | 120 | 28 | 3069 | 1 | 0 |
| F | 219 | 7 | 115 | 47 | 0 |
| Q | 0 | 0 | 0 | 0 | 9 |
Table 5.
Comparative results of subject-oriented classification
Conclusion
In this paper, we have proposed a new algorithm based on time–frequency representation to extract features for cardiac arrhythmia classification. Considering the normal time duration of QRS complex, PR interval and QT interval and the normal bandwidth of each P wave, T wave and QRS complex, 9 TF windows are selected. The summation over these windows along with RR-interval and HOS features are used in classification. An ensemble of decision trees is used with subject-oriented scheme. The results show extremely high accuracy in the three main classes of “N”, “S” and “V”, which contain over 99% of the database. The “F” class on the other hand has many misclassified samples as it is the case in other papers too. The TF features as a measure of energy are proven to be effective for heartbeat classification.
Contributor Information
Safa Sultan Qurraie, Phone: +61424780293, Email: safa.sultanqurraie@tabrizu.ac.ir.
Rashid Ghorbani Afkhami, Phone: +61416359024, Email: rashid.ghorbaniafkhami@uon.edu.au.
References
- 1.Jenkins D, Gerred S. Normal ECG. http://www.ecglibrary.com/norm.php. Accessed Febr 2015.
- 2.de Chazal P, O’Dwyer M, Reilly R. Automatic classification of heartbeats using ECG morphology and heartbeat interval features. IEEE Trans Biomed Eng. 2004;51(7):1196–1206. doi: 10.1109/TBME.2004.827359. [DOI] [PubMed] [Google Scholar]
- 3.de Oliveira L, Andreao R, Sarcinelli-Filho M. Premature ventricular beat classification using a dynamic Bayesian network. In: Annual international conference of the IEEE engineering in medicine and biology society, EMBC, Boston, MA; 2011. [DOI] [PubMed]
- 4.Zeng XD, Chao S, Wong F. Ensemble learning on heartbeat type classification. In: International conference on system science and engineering (ICSSE), Macao; 2011.
- 5.Cohen L. Time-frequency distributions—a review. Proc IEEE. 2002;77(7):941–981. doi: 10.1109/5.30749. [DOI] [Google Scholar]
- 6.Ince T, Kiranyaz S, Gabbouj M. A generic and robust system for automated patient-specific classification of ECG signals. IEEE Trans Biomed Eng. 2009;56(5):1415–1426. doi: 10.1109/TBME.2009.2013934. [DOI] [PubMed] [Google Scholar]
- 7.Jiang X, Zhang L, Zhao Q, Albayrak S. ECG arrhythmias recognition system based on independent component analysis feature extraction. In: TENCON 2006 IEEE Region 10 Conference, Hong Kong; 2006.
- 8.Yang S, ShenH. Heartbeat classification using discrete wavelet transform and kernel principal component analysis. In: TENCON Spring Conference, 2013 IEEE, Sydney, NSW; 2013.
- 9.Thomas M, Das MKAS. Automatic ECG arrhythmia classification using dual tree complex wavelet based features. Int J Electron Commun (AEÜ) 2015;69(4):715–721. doi: 10.1016/j.aeue.2014.12.013. [DOI] [Google Scholar]
- 10.Osowski S, Hoai LT, Markiewicz T. Support vector machine-based expert system for reliable heartbeat recognition. IEEE Trans Biomed Eng. 2004;51(4):582–589. doi: 10.1109/TBME.2004.824138. [DOI] [PubMed] [Google Scholar]
- 11.Ye C, Kumar B, Coimbra M. Heartbeat classification using morphological and dynamic features of ECG signals. IEEE Trans Biomed Eng. 2012;59(10):2930–2941. doi: 10.1109/TBME.2012.2213253. [DOI] [PubMed] [Google Scholar]
- 12.Lagerholm M, Peterson C, Braccini G, Edenbrandt L. Clustering ECG complexes using Hermite functions and self-organizing maps. IEEE Trans Biomed Eng. 2002;47(7):838–848. doi: 10.1109/10.846677. [DOI] [PubMed] [Google Scholar]
- 13.Jiang W, Kong S. Block-based neural networks for personalized ECG signal classification. IEEE Trans Neural Netw. 2007;18(6):1750–1761. doi: 10.1109/TNN.2007.900239. [DOI] [PubMed] [Google Scholar]
- 14.Llamedo M, Martinez J. Heartbeat classification using feature selection driven by database generalization criteria. IEEE Trans Biomed Eng. 2011;58(3):616–625. doi: 10.1109/TBME.2010.2068048. [DOI] [PubMed] [Google Scholar]
- 15.de Lannoy G, Francois D, Delbeke J, Verleysen M. Weighted conditional random fields for supervised interpatient heartbeat classification. IEEE Trans Biomed Eng. 2012;59(1):241–247. doi: 10.1109/TBME.2011.2171037. [DOI] [PubMed] [Google Scholar]
- 16.Ghorbani Afkhami R, Azarnia G, Tinati MA. Cardiac arrhythmia classification using statistical and mixture modeling features of ECG signals. Pattern Recognit Lett. 2016;70:45–51. doi: 10.1016/j.patrec.2015.11.018. [DOI] [Google Scholar]
- 17.Ghorbani Afkhami R, Tinati MA. ECG based detection of left ventricular hypertrophy using higher order statistics. In: 23rd Iranian Conference on Electrical Engineering (ICEE), Tehran; 2015.
- 18.Pachori RB, Nishad A. Cross-terms reduction in the Wigner–Ville distribution using tunable-Q wavelet transform. Sig Process. 2016;120:288–304. doi: 10.1016/j.sigpro.2015.07.026. [DOI] [Google Scholar]
- 19.Breiman L, Friedman J, Stone CJ, Olshen R. Classification and regression trees. London: Chapman and Hall; 1984. [Google Scholar]
- 20.Zaunseder S, Huhle R, Malberg H. CinC challenge—assessing the usability of ECG by ensemble decision trees. In: Computing in cardiology, Hangzhou; 2011.
- 21.Maimon O, Rokach L. Data mining and knowledge discovery handbook. Berlin: Springer; 2010. [Google Scholar]
- 22.Opitz D, Maclin R. Popular ensemble methods: an empirical study. J Artif Intell Res. 1999;11:169–198. [Google Scholar]
- 23.Mark R, Moody G. MIT-BIH database and software catalog. http://ecg.mit.edu/dbinfo.html (1997). Accessed Feb 2015.
- 24.“Recommended practice for testing and reporting performance results of ventricular arrhythmia detection algorithms,” Association for the Advancement of Medical Instrumentation, 1987.
- 25.“Testing and reporting performance results of cardiac rhythm and ST segment measurement algorithms,” Association for the Advancement of Medical Instrumentation, 1998.
- 26.Rodriguez J, Goñi A, Illarramendi A. Real-time classification of ECGs on a PDA. IEEE Trans Inf Technol Biomed. 2005;9(1):23–34. doi: 10.1109/TITB.2004.838369. [DOI] [PubMed] [Google Scholar]
- 27.Awodeyi A, Alty S, Ghavami M. Median filter approach for removal of baseline wander in photoplethysmography signals. In: European Modelling Symposium (EMS), Manchester; 2013.
- 28.Prasad G, Sahambi J. Classification of ECG arrhythmias using multi-resolution analysis and neural networks. In: Conference on Convergent Technologies for the Asia-Pacific Region, TENCON, vol. 1, p. 227–231, 2003.
- 29.Martis R, Acharya R, Ray A. Application of higher order cumulants to ECG signals for the cardiac health diagnosis. In: International Conference of the IEEE EMBS, Boston; 2011. [DOI] [PubMed]
- 30.Ebrahimzadeh A, Khazaee A. Higher order statistics for automated classification of ECG beats. In: International conference on electrical and control engineering (ICECE), Yichang; 2011.


