

Abstract
Photoacoustic microscopy (PAM) has become an increasingly popular technology for biomedical applications, providing anatomical, functional, and molecular information. In this concise review, we first introduce the basic principles and typical system designs of PAM, including optical-resolution PAM and acoustic-resolution PAM. The major imaging characteristics of PAM, i.e. spatial resolutions, penetration depth, and scanning approach are discussed in detail. Then, we introduce the major biomedical applications of PAM, including anatomical imaging across scales from cellular level to organismal level, label-free functional imaging using endogenous biomolecules, and molecular imaging using exogenous contrast agents. Lastly, we discuss the technical and engineering challenges of PAM in the translation to potential clinical impacts.
Keywords: Photoacoustic microscopy, Structural imaging, Functional imaging, Molecular imaging, Endogenous biomolecules, Exogenous contrast agents
Introduction
Photoacoustic signals are acoustic waves excited by pulsed or amplitude-modulated optical radiations. The amplitude and phase of the generated photoacoustic signals not only depend on the light sources but also the optical, thermal and mechanical properties of the excited objects. While photoacoustic effect has been a known physical phenomenon for over a century [1], it is only in the past three decades that photoacoustic tomography (PAT) has gained momentum, due to the development of modern laser technologies, inverse reconstruction algorithms and sensitive ultrasonic detectors. PAT is now one of the fastest growing technologies for biomedical imaging [2–5]. Compared to other biomedical imaging technologies, such as magnetic resonance tomography [6], ultrasonic imaging [7], and X-ray computed tomography [8, 9], PAT provides complementary merits by combining the strengths of optical imaging and ultrasonic imaging [2]. The implementation of a typical PAT system always combines optical excitation and acoustical detection [3], leading to the following three features. First, PAT relies on optical absorption, hence it can provide high-contrast spectral properties of biological tissues, including the physiological functions [10] and the molecular compositions [11]. Second, PAT detects the local acoustic pressure induced by pulsed-laser excitation, hence it can provide relatively large penetration depth, as acoustic pressure waves has two to three orders of magnitude less attenuation than light in tissues [12]. Third, PAT system is highly scalable by combining different light delivery and acoustics detection methods [4], hence it can perform multi-scale imaging with a flexible spatial resolution and penetration depth.
According to the configurations of optical excitation and acoustic detection methods, the implementations of PAT system can be classified into three groups, including photoacoustic computed tomography (PACT), optical-resolution photoacoustic microscopy (OR-PAM), and acoustic-resolution photoacoustic microscopy (AR-PAM). PACT employs wide-field optical illumination and parallel acoustic detection, providing relatively low spatial resolutions (hundreds of micrometers) and deep penetration depth (several centimeters); PAM employs either tightly/loosely focused optical illumination and focused acoustic detection, providing high spatial resolutions (from several micrometers to tens of micrometers) and relatively shallow penetration depth (from one to several millimeters). The complementary imaging characteristics of PACT and PAM systems make photoacoustic imaging a promising technology for a variety of biomedical applications [2]. In this concise review paper, we will focus on PAM. First, we will introduce the basic principles and system designs of PAM systems. Second, the major imaging parameters of PAM systems (including OR- and AR-PAM) will be discussed in detail. Third, the major biomedical imaging applications of PAM will be introduced. Lastly, technical and engineering challenges in PAM are presented.
Principle of PAM
For a PAM system, optical excitation and acoustic detection are the basic configurations. The PA signals, i.e. the acoustic waves, are generated by optical absorption of the target. If the optical excitation satisfies the stress and thermal confinements [5], the generated initial acoustic pressure amplitude can be expressed as
| 1 |
where is the Grüeneisen parameter, is the percentage of absorbed light energy that is converted into heat through non-radiative relaxation, is the absorption coefficient, and is the local optical fluence. The amplitude of the initial pressure is linear to the optical absorption and the local optical fluence, providing PAM with high optical-absorption-based contrast mechanism.
In PAM, the implementations of focused optical excitation and acoustic detection are similar to confocal microscopy. The confocal configuration maximizes the detection sensitivity. Figure 1 shows the typical setups of OR- and AR-PAM. The difference between OR- and AR-PAM is the size of the focused laser spot on the target. OR-PAM employs tightly focused light as the excitation source, as shown in Fig. 1a and b, and its lateral resolution is determined by the focused light spot size, which is approximately given by . Here λo is the light wavelength and NAo is the numerical aperture (NA) of the optical objective. A larger optical NA can provide a better lateral resolution. For example, an NA of 0.1 provides a lateral resolution of ~ 3 µm [13] and 1.23 provides ~ 0.22 µm [14] at 532 nm. OR-PAM in transmission mode (Fig. 1a) is only applicable to thin tissue slices due to the limited penetration, while the reflection mode (Fig. 1b) is capable of imaging larger tissue volumes. AR-PAM employs weakly focused or collimated light beam, as shown in Fig. 1c. The optical beam spot of AR-PAM is larger than the acoustic focal spot. As a result, the lateral resolution of AR-PAM is acoustically determined by the acoustical focal spot size, which is given by . Here is the acoustic wavelength. NAa is the NA of the focused ultrasonic transducer. The lateral resolution of AR-PAM is more than ten times worse than OR-PAM. The axial resolutions of OR- and AR-PAM are both determined by the bandwidth () of the ultrasonic transducer, which is given by [15]. c is the speed of sound.
Fig. 1.

The schematics of typical PAM systems. a Transmission-mode OR-PAM. UT, ultrasonic transducer. b Reflection-mode OR-PAM. SOL, silicone oil layer. c Reflection-mode AR-PAM.
Figures reproduced with permission from [16]
The optical spot size of PAM system also determines the optical fluence that can be safely delivered into the tissue. Due to the safety concern for in vivo study, the optical fluence is limited by the maximum permissible exposure (MPE) regulated by American National Standard for Safe Use of Lasers [17]. Compared to OR-PAM, more optical energy can be used for AR-PAM, due to the larger optical spot size. Generally, the pulse energy is less than 1 µJ for OR-PAM and less than 1 mJ for AR-PAM [3]. Because AR-PAM can harness the PA signals generated by scattered photons, it can achieve larger penetration depth. Nevertheless, the PA signals also suffer from tissue attenuation before reaching the transducer. The acoustic penetration depth of AR-PAM system is inversely proportional to the central frequency of the transducer [18], as low-frequency acoustic waves have weaker scattering. For example, by using a 5-MHz transducer, the imaging depth of AR-PAM is ~ 30 mm [4].
The working distance of a PAM system depends on the focal length of the objective or ultrasonic transducer. A relatively large working distance can be obtained by using low-NA optical objective and ultrasonic transducer, at the cost of lateral resolution. The field of view (FOV) of the PAM system is determined by scanning either the sample or the light/sound. Most of the reported conventional PAM systems use stepper motor stages, with a maximum scanning speed of ~ 5 cm/s. To provide high-quality images, the scanning step size for PAM should be at most half of the lateral resolution [19], which is on the order of several micrometers for OR-PAM and tens of micrometers for AR-PAM. Therefore, it is time consuming to scan a large FOV using conventional PAM systems. The imaging speed can be improved by using scanning mirrors with various driving mechanisms [20–30]. For example, a commercial Galvanometer mirror has been used to provide a B-scan rate of 60 Hz over an ~ 4-mm scanning range [28]. Another OR-PAM system employed a water-immersible MEMS scanning mirror, providing a B-scan rate of 400 Hz over a 3-mm scanning range [27]. Recently, a 2-axis waterproof MEMS scanner was developed for handheld OR-PAM [30].
The imaging characteristics of PAM systems can be tuned optically or acoustically. A longer excitation wavelength provides a larger penetration depth in the near-infrared (NIR) window of 650-950 nm [31]. In addition to spatial resolution, different optical and acoustic NAs can also affect the imaging depth. A high optical/acoustic NA induces a short depth of focus (DOF), so depth scanning may be necessary for volumetric imaging if a high NA is used.
Biomedical applications
In the following sections, the major biomedical applications of PAM are presented, including (1) structural imaging across scales from single cells to organs, (2) label-free functional imaging, and (3) the molecular imaging with exogenous contrast agents.
Structural imaging
Single cell imaging
Single cell imaging requires at least a submicron/subwavelength spatial resolution [32], hence it is usually implemented by using OR-PAM systems. The submicron/subwavelength OR-PAM can be achieved by either using a high optical NA [14, 33–36] or a transducer with a ultra-high central frequency [37]. The former is more commonly used for single cell imaging [32]. Due to the limited working distance and small penetration, OR-PAM systems with high-NA objectives, as shown in Fig. 1a, were usually implemented in the transmission mode [14, 33–36, 38, 39]. Zhang et al. reported the first subwavelength OR-PAM by employing a 1.23-NA objective [14], obtaining a lateral resolution of 0.22 µm. The single cell imaging capability was demonstrated on individual melanoma cells and red blood cells (RBCs) ex vivo (Fig. 2). Compared to the optical microscopy (OM) images, PAM images show a higher contrast between cells and the background. Later, the similar OR-PAM configuration was applied to image the mitochondria [35], MC3T3 osteoblast cells [36], and MCF7 cells [39].
Fig. 2.

Ex vivo images of melanoma cells and RBCs obtained by OR-PAM with an optical NA of 1.23. a Melanoma cells on a glass slide. From left to right: PAM image, OM (0.5 NA) image, and a composite of the PAM image and the fluorescence OM image. The blue regions show the fluorescent stained nucleus. CN: cell nucleus. b PAM and OM (1.0 NA) images of RBCs. Figures adapted with permission from [14]. (Color figure online)
The high-optical-NA OR-PAM, however, has a poor axial resolution, due to the limited ultrasonic detection bandwidth. To address this issue, Strohm et al. [37] reported another approach for resolving single cells by using ultrahigh frequency ultrasonic transducers. In this case the lateral resolution was also acoustically determined, as the laser spot size was larger than the acoustical spot size. The central frequencies of the employed ultrasonic transducers were up to 1200 MHz, while the NA of the objective was fixed at 0.25. The lateral and axial resolutions both reached at 1 µm. The images of a single melanoma cell obtained at different ultrasonic frequencies were shown in Fig. 3a, b. Alternatively, Shelton et al. employed an objective with an NA of 0.8 to image a single bovine RBC [34], taking advantage of multi-photon optical absorption. This non-linear multiphoton OR-PAM has provided a lateral resolution of ~ 0.4 µm and an optically-determined axial resolution of ~ 1.5 µm, as shown in Fig. 3c and d. Nevertheless, both the high-frequency OR-PAM and multi-photon PAM have reduced penetration depth, compared with traditional OR-PAM systems.
Fig. 3.
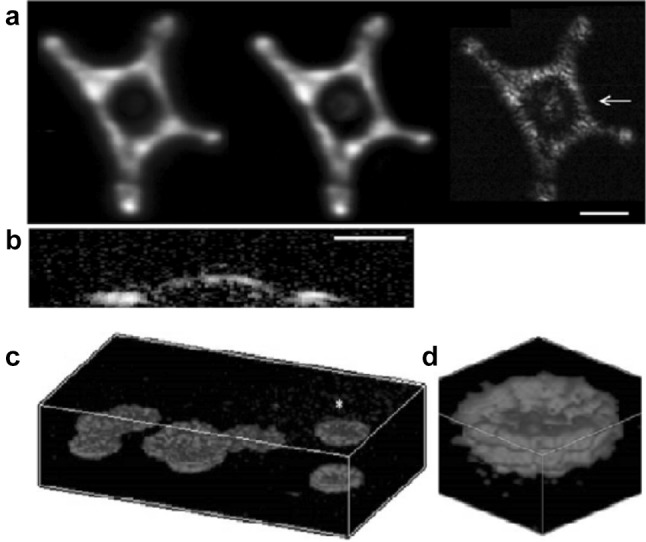
Images of melanoma cells obtained by high-frequency OR-PAM and red blood cells obtained by multiphoton OR-PAM. a Top-view MAP images obtained by the 200-, 375- and 1200-MHz ultrasonic transducers. Scale bar, 30 µm. b A cross-sectional image around the cell nucleus as indicated by the arrow in (a). Scale bar, 15 µm. c Volumetric images of several RBCs on a glass slide within the volume of 50 × 50 × 20 µm3. d Close-up image of a single RBC marked with a yellow asterisk in (c).
Figures reproduced with permissions from [34, 37]. (Color figure online)
Several other methods, based on nonlinear effects or sophisticated signal detection, have improved the axial resolution of OR-PAM [38, 40–42]. Shelton et al. [40] used the nonlinear transient absorption to achieve an axial resolution of 6 µm; Zhu et al. [42] developed a multi-view OR-PAM enhanced by a deconvolution method, providing an axial resolution of 4.7 µm; Yao et al. [41] developed photo-imprint OR-PAM using the intensity-dependent photobleaching effect and obtained an axial resolution of 0.37 µm; Dong et al. [38] employed an ultra-wideband micro-ring resonator ultrasonic detector to achieve an axial resolution of 2.12 µm.
Microvasculature imaging
The microvascular system is responsible for exchanging oxygen, nutrients and metabolism waste with the surrounding tissues. Imaging microvasculature can provide physiological and pathophysiological information for diagnosing many diseases [43], such as uremia [44], diabetes [45] and rheumatoid arthritis [46]. PAM has played an important role in the imaging and characterization of the microvasculature [47]. The diameters of micro vessels generally fall in the range of 2–100 µm [48], hence both OR-PAM and AR-PAM are capable of imaging microvasculature. OR-PAM is usually employed for superficial microvasculature imaging [49], while AR-PAM is usually employed for subcutaneous microvasculature imaging [50–54].
The mouse ear is a widely used model for OR-PAM, as it has abundant capillary network. The thickness of the mouse ear is around 0.2–0.3 mm [55]. Therefore, the capillaries in the ear skin can be imaged by OR-PAM without losing the lateral resolution [47], as shown in Fig. 4. The top-view MAP image was shown in Fig. 4a, and the corresponding volumetric image was shown in Fig. 4b. Small vessels can be clearly resolved with high imaging contrast. OR-PAM has also been used for imaging the mouse brain [27] and eyes [49]. AR-PAM is usually used for the deep-penetration imaging of microvasculature. Zhang et al. for the first time used AR-PAM to image the human hand in vivo, showing the microvascular network at a depth of ~ 400-650 µm below the skin surface [54], as shown in Fig. 5. The largest vessel is 350 µm in diameter, and the smallest is within 50 µm. From the B-scan image in Fig. 5c, the three layers of skin surface, stratum corneum and vessels can be clearly identified.
Fig. 4.

A typical in vivo OR-PAM image of the microvasculature in a mouse ear. a Top-view MAP image. b Volumetric image.
Figures adopted with permission from [47]
Fig. 5.

A typical in vivo AR-PAM image of the microvasculature in a human palm. a Photograph of a human hand. Solid rectangle indicates the imaged area. b Top-view MAP image after removing the skin surface and the stratum corneum. c B-scan image along the dashed line in (b). d Top-view MAP images from different layers.
Figures reproduced with permission from [54]
Whole organ imaging
As most endogenous biomolecules are non-fluorescent and the organs are larger than 1 mm, it is generally a challenge for traditional optical microscopy to image the whole organs. PAM is a potential technology for addressing the above issues. Wong et al. [56] demonstrated the whole-organ imaging capability of a microtomy-assisted OR-PAM (ma-OR-PAM), using UV light as the optical excitation source. The microtomy was used for automatically shaving off the thin layer of tissue after being imaged. Compared to optical sectioning microscopy, the ma-OR-PAM can generate high-resolution three-dimension (3D) images of whole organs embedded in agarose, by simultaneous imaging DNA/RNA, hemoglobin and lipids, with a lateral resolution of 0.9 µm. Agarose was used for keeping the tissue fresh. A 3D ma-OR-PAM image of an unstained agarose-embedded mouse brain is shown in Fig. 6. The imaged volume of the mouse brain was 9.5 × 7.5 × 11.0 mm3. The volumetric image of the mouse brain is shown in Fig. 6a, obtained with a sectioning thickness of 0.2 mm. The lateral ventricles, hippocampus, and cerebellum can be observed in the 3D image. The high-resolution 3D image can also provide histology-like imaging of cell nuclei, blood vessels, axons, and other anatomical structures of the organs.
Fig. 6.

3D ma-OR-PAM image of an unstained agarose-embedded mouse brain. a Volumetric image of a mouse brain with a sectioning thickness of 200 µm. b–k Ten representative coronal views as positioned by the dashed lines in (a).
Figures adopted with permission from [56]
Label-free functional imaging
Since almost all endogenous biomolecules in biological tissues can absorb light at their corresponding wavelengths, they can potentially provide absorption contrast for PAM without labelling. The optical absorption spectra of major endogenous biomolecules [16] are shown in Fig. 7. The multispectral PAM can be implemented with multiple-wavelength excitation [57, 58] and the relative concentrations of the biomolecules can be quantified through a variety of signal inmixing methods. Label-free functional studies, such as monitoring the oxygen saturation of hemoglobin (sO2) and oxygen metabolism, can be performed using PAM with intrinsic contrast agents. We will introduce two representative applications of PAM in functional studies.
Fig. 7.

Optical absorption spectra of major endogenous biomolecules in tissues.
Figure adopted with permission from [16]
Brain activity imaging
PAM is an effective tool to visualize the brain activities with high resolution and relatively deep penetration. OR-PAM has been widely used for brain imaging, in which the mouse scalp is typically removed but the skull is intact. Yao et al. developed a fast-speed OR-PAM using a water-immersible MEMS scanning mirror to monitor blood perfusion and oxygenation activities of a mouse brain in vivo [27], as shown in Fig. 8. It was observed that the PA amplitude in the contralateral somatosensory region and sagittal sinus region increased until the end of the electrical stimulations. The sO2 variations responded to the stimulations were quantified using a single-wavelength pulse-width-based method. The changes of cerebral blood flow (CBF), oxygen extraction fraction (OEF) and cerebral metabolic rate of oxygen (CMRO2) in the core responding region were also measured. AR-PAM has also been used for functional brain imaging, with improved penetration but compromised resolution [59–61]. For example, Liao et al. reported AR-PAM of rat brain hemodynamic changes during forepaw electrical stimulation [59], and Stein et al. used AR-PAM to monitor the blood oxygenation dynamics in hypoxic and hyperoxic challenges [61]. Compared to the single-wavelength pulse-width-based method, multiple-wavelength excitation method is more sensitive to the wavelength-dependent optical attenuation in tissue, but it doesn’t require the extremely short laser pulse. Nevertheless, both methods have found successful applications for functional brain imaging.
Fig. 8.

In vivo OR-PAM of the mouse brain responses to the electrical stimulations of the hindlimbs. a Fractional PA amplitude response to left hindlimb stimulation (LHS) and right hindlimb stimulation (RHS). LH, left hemisphere; RH, right hemisphere. b Depth-resolved response. c sO2 changes in response to the stimulations. d The changes of cerebral blood flow (CBF), oxygen extraction fraction (OEF) and cerebral metabolic rate of oxygen (CMRO2) in the core responding region.
Figure adopted with permission from [27]
Blood flow imaging
Most diseases have adverse effect on the blood flow and thus disrupt the normal oxygen metabolic activities of cells. It is therefore clinically significant to measure the blood flow and oxygen metabolism for diagnosis and therapeutic purposes [62]. PAM is a promising technology for this task because it does not require additional exogenous contrast agents to label the blood or oxygen [13, 63–69]. For example, Yao et al. developed a metabolic OR-PAM system that can simultaneously measure sO2 and blood flow in vivo [13], as shown in Fig. 9. In particular, the blood flow was measured based on the photoacoustic Doppler bandwidth broadening with bidirectional motor scanning. By combining the essential anatomical and functional parameters of the tissue, the metabolic rate of oxygen can be quantified in absolutely value, as first demonstrated in a hyperthermia model and a tumor model [13].
Fig. 9.

In vivo OR-PAM images of the oxygen saturation of hemoglobin and blood flow speed measured on a mouse ear. a The total concentration of hemoglobin acquired at 584 nm. b The measured sO2 in the area indicated by the dashed box in (a). c The measured flow speed in the area indicated by the dashed box in (b). d The profile of the flow speed along the dashed line indicated in (c).
Figures reproduced with permission from [13]
Molecular imaging with exogenous contrast agents
Although PAM is capable of high-resolution imaging with endogenous contrast, many diseases and physiological processes usually lack sufficient intrinsic PA contrasts [11, 70], such as tumor cell receptor expression and protease activity. Various exogenous PA contrast agents, from small-molecule dyes to gold, polymer and carbon nanostructures to liposome encapsulations [11, 63, 71–75], have been invented to enhance the specificity and sensitivity of PAM. The development of PA contrast agents can be of great importance to advance the molecular imaging applications of PAM, especially for detecting early-stage cancers and tracking immunotherapy mechanisms against diseases. We will only list two representative applications below. More comprehensive studies can be referred to the recent review articles [70, 76].
Molecular imaging of gene expression
Cai et al. [77] demonstrated the capability of AR-PAM for noninvasive and simultaneous imaging of a subcutaneous lacZ-expressing tumor and its surrounding microvasculature networks in vivo. The lacZ gene is a widely used reporter gene in biology and its expression can be studied by several chromogenic assays. In this study, Cai et al. employed the X-gal as the molecular probe which absorbed the light in the wavelength range between 605 and 655 nm. The lacZ-expressing tumor cells were subcutaneously injected into the mouse. The AR-PAM images of the malignant tumor and surrounding tissues acquired at 584 and 635 nm were shown in Fig. 10. The tumor only contributed to the PA signals at 635 nm. The fused MAP image of the two wavelengths shows the spatial distributions of the tumor and the surrounding microvasculature. With the dual-wavelength excitation scheme, the expression of the lacZ gene was successfully identified.
Fig. 10.

In vivo AR-PAM images showing the lacZ-expressing tumor and the surrounding microvascular networks. a MAP image of the lacZ-expressing tumor acquired at 635 nm. b MAP image of the surrounding microvasculature acquired at 584 nm. c Fused MAP image of the two wavelengths. d Fused 3D image of the two wavelengths.
Figures adopted with permission from [77]
Molecular imaging of tumors targeted by bioconjugate gold nanocages
There have been numerous nanostructures developed as exogenous contrast agents for PAT [11, 70, 71]. Gold nanocages (AuNCs) have been demonstrated as one effective contrast agent for molecular PA imaging [78]. Kim et al. [72] have conducted a study to quantify the contrast enhancement of the active and passive targeting of AuNCs to B16 melanomas. The AuNCs was bioconjugated with [Nle4, D-Phe7]-α-melanocyte-stimulating hormone ([Nle4, D-Phe7]-α-MSH-AuNCs) for active targeting and poly (ethylene glycol) (PEG-AuNCs) for passive targeting. The MAP images of the B16 melanomas targeted by [Nle4, D-Phe7]-α-MSH-AuNCs and PEG-AuNCs are shown in Fig. 11, which were acquired by the dual-wavelength AR-PAM (570 nm for microvasculature and 778 nm for AuNCs). It was observed that [Nle4, D-Phe7]-α-MSH-AuNCs provided three-times higher contrast enhancement than PEG-AuNCs. Except for the gold nanocages, other nanostructures, such as the palladium nanosheets [11], semiconducting polymer nanoparticles [75], silver nanoplate [71] and carbon nanotube [79] were also demonstrated as effective PA contrast agents.
Fig. 11.

In vivo AR-PAM images of the melanomas targeted by [Nle4, D-Phe7]-α-MSH-AuNCs and PEG-AuNCs, respectively. a Photographs of the nude mice bearing melanoma. b–d MAP images of the melanomas and surrounding microvasculature after injection of [Nle4, D-Phe7]-α-MSH-AuNCs. f–h MAP images of the melanomas and surrounding microvasculature after injection of PEG-AuNCs.
Figures adopted with permission from [72]
Conclusion and Challenges
In conclusion, PAM is a powerful tool for anatomical, functional and molecular imaging for preclinical studies, with great potential for clinical applications. In this concise review, we have introduced the basic principles and the major imaging characteristics of PAM. The major biomedical imaging applications of PAM, from multiscale structure imaging to functional imaging using endogenous biomolecules to molecular imaging using exogenous contrast agents, have been presented with representative examples.
The strong momentum of PAM development is fueled by its increasingly popular applications in the life sciences and its commercialization. PAT has enabled biomedical studies that require high-resolution imaging at depths far beyond the optical diffusion limit and filled a void of high-resolution optical imaging in deep tissue. We strongly believe that PAM will find broad impact in fundamental research and clinical practice.
Nevertheless, to tap the full potential of PAM, there are still several technical and engineering challenges in PAM that need to be addressed.
Limited detection view Most of AR-PAM with weakly focused light and OR-PAM systems using low-NA optical objectives suffer from the limited view problem [80, 81]. The PA signals from vertical structures aligned with the acoustic axis cannot be detected due to interference cancellation of coherent pressure waves. Limited view can be corrected by using either multi-view transducers or structure illumination [82], requiring complex system design. Recently, deep learning has been validated as a promising tool to correct the imaging artifacts in traditional optical imaging [83], which may also be a possible solution for PAM to correct the limited view.
Imaging speed and field of view Most of the reported PAM systems are only applicable to small-region imaging (< 10 × 10 mm2), limited by small scanning range or the slow scanning speed. For scanning mirror-based OR-PAM systems, the field of view can be enlarged by increasing the rotation angles of scan mirrors, which, however, may suffer from the limited detection region of the ultrasonic transducer. For PAM systems using stepper scanning motor stages, the scanning speed is limited by the motor translation speed and the required step size. For samples with curvature surfaces, such as the brain, the imaging requires even more time by performing depth scanning. Nevertheless, a fast PAM with ultra-wide field of view is highly desired for preclinical or clinical researches.
Miniaturization For most small animal imaging studies based on table-top PAM, the animals are typically in anesthesia to avoid any motion artifacts. However, the anesthetic status affects the normal physiological functions, such as the metabolism and neuron activities. Therefore, the imaging results of anesthetized animals may lack fidelity, compared with the results obtained with freely behaving animals. The current table-top PAM systems are not able to image the awake animals in motion. This issue can be addressed by miniaturizing PAM systems and mounting it onto the animal body or head, similar to miniaturized two-photon microscopy [84]. The miniaturization of PAM system can benefit tremendously for functional brain studies.
Acknowledgements
We thank Neel Kurupassery for editing the manuscript.
Funding
This study was funded by Duke MEDx fund (to J.Y.).
Conflict of interest
The authors declare that they have no conflict of interests.
Ethical approval
This article does not contain any studies with human participants or animals performed by any of the authors.
References
- 1.Mcqueen DH. Acoustical theory of the photoacoustic effect in gaseous and liquid-media. J Phys D Appl Phys. 1979;12:1673–1678. doi: 10.1088/0022-3727/12/10/008. [DOI] [Google Scholar]
- 2.Yang JM, Favazza C, Chen RM, Yao JJ, Cai X, Maslov K, Zhou QF, Shung KK, Wang LHV. Simultaneous functional photoacoustic and ultrasonic endoscopy of internal organs in vivo. Nat Med. 2012;18:1297–1302. doi: 10.1038/nm.2823. [DOI] [PMC free article] [PubMed] [Google Scholar]
- 3.Wang LHV, Yao JJ. A practical guide to photoacoustic tomography in the life sciences. Nat Methods. 2016;13:627–638. doi: 10.1038/nmeth.3925. [DOI] [PMC free article] [PubMed] [Google Scholar]
- 4.Wang LV. Multiscale photoacoustic microscopy and computed tomography. Nat Photonics. 2009;3:503–509. doi: 10.1038/nphoton.2009.157. [DOI] [PMC free article] [PubMed] [Google Scholar]
- 5.Xu MH, Wang LHV. Photoacoustic imaging in biomedicine. Rev Sci Instrum. 2006;77:041101. doi: 10.1063/1.2195024. [DOI] [Google Scholar]
- 6.Holland GN, Moore WS, Hawkes RC. Nuclear magnetic-resonance tomography of the brain. J Comput Assist Tomogr. 1980;4:1–3. doi: 10.1097/00004728-198002000-00001. [DOI] [PubMed] [Google Scholar]
- 7.Mulz D, Hiller D, Ermert H, Schnizlein B, Schrott KM. Ultrasound computer tomography–new image-producing possibilities. Ultraschall Med. 1984;5:11–13. doi: 10.1055/s-2007-1012058. [DOI] [PubMed] [Google Scholar]
- 8.Dierolf M, Menzel A, Thibault P, Schneider P, Kewish CM, Wepf R, Bunk O, Pfeiffer F. Ptychographic X-ray computed tomography at the nanoscale. Nature. 2010;467:436–482. doi: 10.1038/nature09419. [DOI] [PubMed] [Google Scholar]
- 9.Huang D, Swanson EA, Lin CP, Schuman JS, Stinson WG, Chang W, Hee MR, Flotte T, Gregory K, Puliafito CA, Fujimoto JG. Optical coherence tomography. Science. 1991;254:1178–1181. doi: 10.1126/science.1957169. [DOI] [PMC free article] [PubMed] [Google Scholar]
- 10.Christison GB, Mackenzie HA. Laser photoacoustic determination of physiological glucose-concentrations in human whole-blood. Med Biol Eng Comput. 1993;31:284–290. doi: 10.1007/BF02458048. [DOI] [PubMed] [Google Scholar]
- 11.Nie LM, Chen M, Sun XL, Rong PF, Zheng NF, Chen XY. Palladium nanosheets as highly stable and effective contrast agents for in vivo photoacoustic molecular imaging. Nanoscale. 2014;6:1271–1276. doi: 10.1039/C3NR05468C. [DOI] [PubMed] [Google Scholar]
- 12.Daft CM, Briggs GA, O’Brien WD., Jr Frequency dependence of tissue attenuation measured by acoustic microscopy. J Acoust Soc Am. 1989;85:2194–2201. doi: 10.1121/1.397868. [DOI] [PubMed] [Google Scholar]
- 13.Yao JJ, Maslov KI, Zhang Y, Xia YN, Wang LV. Label-free oxygen-metabolic photoacoustic microscopy in vivo. J Biomed Opt. 2011;16:076003. doi: 10.1117/1.3594786. [DOI] [PMC free article] [PubMed] [Google Scholar]
- 14.Zhang C, Maslov K, Wang LV. Subwavelength-resolution label-free photoacoustic microscopy of optical absorption in vivo. Opt Lett. 2010;35:3195–3197. doi: 10.1364/OL.35.003195. [DOI] [PMC free article] [PubMed] [Google Scholar]
- 15.Li C, Wang LV. Photoacoustic tomography and sensing in biomedicine. Phys Med Biol. 2009;54:R59–R97. doi: 10.1088/0031-9155/54/19/R01. [DOI] [PMC free article] [PubMed] [Google Scholar]
- 16.Yao J, Wang LV. Sensitivity of photoacoustic microscopy. Photoacoustics. 2014;2:87–101. doi: 10.1016/j.pacs.2014.04.002. [DOI] [PMC free article] [PubMed] [Google Scholar]
- 17.Thomas RJ, Rockwell BA, Marshall WJ, Aldrich RC, Zimmerman SA, Rockwell RJ. A procedure for laser hazard classification under the Z136.1-2000 American National Standard for Safe Use of Lasers. J Laser Appl. 2002;14:57–66. doi: 10.2351/1.1436484. [DOI] [Google Scholar]
- 18.Foster FS, Pavlin CJ, Lockwood GR, Ryan LK, Harasiewicz KA, Berube L, Rauth AM. Principles and applications of ultrasound backscatter microscopy. Ieee T Ultrason Ferroelectr. 1993;40:608–617. doi: 10.1109/58.238115. [DOI] [PubMed] [Google Scholar]
- 19.Jerri AJ. Shannon sampling theorem—its various extensions and applications—tutorial review. Proc Ieee. 1977;65:1565–1596. doi: 10.1109/PROC.1977.10771. [DOI] [Google Scholar]
- 20.Kim JY, Lee C, Park K, Lim G, Kim C. Fast optical-resolution photoacoustic microscopy using a 2-axis water-proofing MEMS scanner. Sci Rep Uk. 2015;5:7932. doi: 10.1038/srep07932. [DOI] [PMC free article] [PubMed] [Google Scholar]
- 21.Ma R, Sontges S, Shoham S, Ntziachristos V, Razansky D. Fast scanning coaxial optoacoustic microscopy. Biomed Opt Express. 2012;3:1724–1731. doi: 10.1364/BOE.3.001724. [DOI] [PMC free article] [PubMed] [Google Scholar]
- 22.Rao B, Li L, Maslov K, Wang LH. Hybrid-scanning optical-resolution photoacoustic microscopy for in vivo vasculature imaging. Opt Lett. 2010;35:1521–1523. doi: 10.1364/OL.35.001521. [DOI] [PMC free article] [PubMed] [Google Scholar]
- 23.Wang LD, Maslov K, Yao JJ, Rao B, Wang LHV. Fast voice-coil scanning optical-resolution photoacoustic microscopy. Opt Lett. 2011;36:139–141. doi: 10.1364/OL.36.000139. [DOI] [PMC free article] [PubMed] [Google Scholar]
- 24.Wang Y, Maslov K, Zhang Y, Hu S, Yang LM, Xia YN, Liu JA, Wang LHV. Fiber-laser-based photoacoustic microscopy and melanoma cell detection. J Biomed Opt. 2011;16:011014. doi: 10.1117/1.3525643. [DOI] [PMC free article] [PubMed] [Google Scholar]
- 25.Yang DW, Xing D, Yang SH, Xiang LZ. Fast full-view photoacoustic imaging by combined scanning with a linear transducer array. Opt Express. 2007;15:15566–15575. doi: 10.1364/OE.15.015566. [DOI] [PubMed] [Google Scholar]
- 26.Yao J, Maslov KI, Puckett ER, Rowland KJ, Warner BW, Wang LV. Double-illumination photoacoustic microscopy. Opt Lett. 2012;37:659–661. doi: 10.1364/OL.37.000659. [DOI] [PMC free article] [PubMed] [Google Scholar]
- 27.Yao JJ, Wang LD, Yang JM, Maslov KI, Wong TTW, Li L, Huang CH, Zou J, Wang LV. High-speed label-free functional photoacoustic microscopy of mouse brain in action. Nat Methods. 2015;12:407–410. doi: 10.1038/nmeth.3336. [DOI] [PMC free article] [PubMed] [Google Scholar]
- 28.Kim JY, Lee C, Park K, Han S, Kim C. High-speed and high-SNR photoacoustic microscopy based on a galvanometer mirror in non-conducting liquid. Sci Rep. 2016;6:34803. doi: 10.1038/srep34803. [DOI] [PMC free article] [PubMed] [Google Scholar]
- 29.Lee D, Lee C, Kim S, Zhou Q, Kim J, Kim C. In vivo near infrared virtual intraoperative surgical photoacoustic optical coherence tomography. Sci Rep. 2016;6:35176. doi: 10.1038/srep35176. [DOI] [PMC free article] [PubMed] [Google Scholar]
- 30.Park K, Kim JY, Lee C, Jeon S, Lim G, Kim C. Handheld photoacoustic microscopy probe. Sci Rep. 2017;7:13359. doi: 10.1038/s41598-017-13224-3. [DOI] [PMC free article] [PubMed] [Google Scholar]
- 31.Hai PF, Yao JJ, Maslov KI, Zhou Y, Wang LHV. Near-infrared optical-resolution photoacoustic microscopy. Opt Lett. 2014;39:5192–5195. doi: 10.1364/OL.39.005192. [DOI] [PMC free article] [PubMed] [Google Scholar]
- 32.Strohm EM, Moore MJ, Kolios MC. Single cell photoacoustic microscopy: a review. Ieee J Sel Top Quantum. 2016;22:6801215. doi: 10.1109/JSTQE.2015.2497323. [DOI] [Google Scholar]
- 33.Danielli A, Maslov K, Garcia-Uribe A, Winkler AM, Li C, Wang L, Chen Y, Dorn GW, 2nd, Wang LV. Label-free photoacoustic nanoscopy. J Biomed Opt. 2014;19:086006. doi: 10.1117/1.JBO.19.8.086006. [DOI] [PMC free article] [PubMed] [Google Scholar]
- 34.Shelton RL, Mattison SP, Applegate BE. Volumetric imaging of erythrocytes using label-free multiphoton photoacoustic microscopy. J Biophotonics. 2014;7:834–840. doi: 10.1002/jbio.201300059. [DOI] [PubMed] [Google Scholar]
- 35.Zhang C, Zhang YS, Yao DK, Xia Y, Wang LV. Label-free photoacoustic microscopy of cytochromes. J Biomed Opt. 2013;18:20504. doi: 10.1117/1.JBO.18.2.020504. [DOI] [PMC free article] [PubMed] [Google Scholar]
- 36.Zhang YS, Yao J, Zhang C, Li L, Wang LV, Xia Y. Optical-resolution photoacoustic microscopy for volumetric and spectral analysis of histological and immunochemical samples. Angew Chem Int Ed Engl. 2014;53:8099–8103. doi: 10.1002/anie.201403812. [DOI] [PMC free article] [PubMed] [Google Scholar]
- 37.Strohm EM, Berndl ES, Kolios MC. High frequency label-free photoacoustic microscopy of single cells. Photoacoustics. 2013;1:49–53. doi: 10.1016/j.pacs.2013.08.003. [DOI] [PMC free article] [PubMed] [Google Scholar]
- 38.Dong BQ, Li H, Zhang Z, Zhang K, Chen SY, Sun C, Zhang HF. Isometric multimodal photoacoustic microscopy based on optically transparent micro-ring ultrasonic detection. Optica. 2015;2:169–176. doi: 10.1364/OPTICA.2.000169. [DOI] [PMC free article] [PubMed] [Google Scholar]
- 39.Yang S, Ye F, Xing D. Intracellular label-free gold nanorods imaging with photoacoustic microscopy. Opt Express. 2012;20:10370–10375. doi: 10.1364/OE.20.010370. [DOI] [PubMed] [Google Scholar]
- 40.Shelton RL, Applegate BE. Ultrahigh resolution photoacoustic microscopy via transient absorption. Biomed Opt Express. 2010;1:676–686. doi: 10.1364/BOE.1.000676. [DOI] [PMC free article] [PubMed] [Google Scholar]
- 41.Yao JJ, Wang LD, Li CY, Zhang C, Wang LHV. Photoimprint photoacoustic microscopy for three-dimensional label-free subdiffraction imaging. Phys Rev Lett. 2014;112:014302. doi: 10.1103/PhysRevLett.112.014302. [DOI] [PMC free article] [PubMed] [Google Scholar]
- 42.Zhu LR, Li L, Gao L, Wang LHV. Multiview optical resolution photoacoustic microscopy. Optica. 2014;1:217–222. doi: 10.1364/OPTICA.1.000217. [DOI] [PMC free article] [PubMed] [Google Scholar]
- 43.Schnackenberg CG. Physiological and pathophysiological roles of oxygen radicals in the renal microvasculature. Am J Physiol Reg I. 2002;282:R335–R342. doi: 10.1152/ajpregu.00605.2001. [DOI] [PubMed] [Google Scholar]
- 44.Amann K, Tornig J, Kugel B, Gross ML, Tyralla K, El-Shakmak A, Szabo A, Ritz E. Hyperphosphatemia aggravates cardiac fibrosis and microvascular disease in experimental uremia. Kidney Int. 2003;63:1296–1301. doi: 10.1046/j.1523-1755.2003.00864.x. [DOI] [PubMed] [Google Scholar]
- 45.Andersen HU, Lanng S, Pressler T, Laugesen CS, Mathiesen ER. Cystic fibrosis-related diabetes—the presence of microvascular diabetes complications. Diabetes Care. 2006;29:2660–2663. doi: 10.2337/dc06-0654. [DOI] [PubMed] [Google Scholar]
- 46.Elices MJ, Tsai V, Strahl D, Goel AS, Tollefson V, Arrhenius T, Wayner EA, Gaeta FCA, Fikes JD, Firestein GS. Expression and functional-significance of alternatively spliced Cs1 fibronectin in rheumatoid-arthritis microvasculature. J Clin Invest. 1994;93:405–416. doi: 10.1172/JCI116975. [DOI] [PMC free article] [PubMed] [Google Scholar]
- 47.Hu S, Wang LV. Photoacoustic imaging and characterization of the microvasculature. J Biomed Opt. 2010;15:011101. doi: 10.1117/1.3281673. [DOI] [PMC free article] [PubMed] [Google Scholar]
- 48.Colantuoni A, Bertuglia S, Intaglietta M. Variations of rhythmic diameter changes at the arterial microvascular bifurcations. Pflug Arch Eur J Physiol. 1985;403:289–295. doi: 10.1007/BF00583602. [DOI] [PubMed] [Google Scholar]
- 49.Jeon S, Song HB, Kim J, Lee BJ, Managuli R, Kim JH, Kim JH, Kim C. In vivo photoacoustic imaging of anterior ocular vasculature: a random sample consensus approach. Sci Rep. 2017;7:4318. doi: 10.1038/s41598-017-04334-z. [DOI] [PMC free article] [PubMed] [Google Scholar]
- 50.Bost W, Lemor R, Fournelle M. Optoacoustic imaging of subcutaneous microvasculature with a class one laser. IEEE Trans Med Imaging. 2014;33:1900–1904. doi: 10.1109/TMI.2014.2326552. [DOI] [PubMed] [Google Scholar]
- 51.Zhang EZ, Laufer JG, Pedley RB, Beard PC. In vivo high-resolution 3D photoacoustic imaging of superficial vascular anatomy. Phys Med Biol. 2009;54:1035–1046. doi: 10.1088/0031-9155/54/4/014. [DOI] [PubMed] [Google Scholar]
- 52.Zhang HF, Maslov K, Li ML, Stoica G, Wang LV. In vivo volumetric imaging of subcutaneous microvasculature by photoacoustic microscopy. Opt Express. 2006;14:9317–9323. doi: 10.1364/OE.14.009317. [DOI] [PubMed] [Google Scholar]
- 53.Zhang HF, Maslov K, Wang LV. In vivo imaging of subcutaneous structures using functional photoacoustic microscopy. Nat Protoc. 2007;2:797–804. doi: 10.1038/nprot.2007.108. [DOI] [PubMed] [Google Scholar]
- 54.Zhang HF, Maslov K, Stoica G, Wang LV. Functional photoacoustic microscopy for high-resolution and noninvasive in vivo imaging. Nat Biotechnol. 2006;24:848–851. doi: 10.1038/nbt1220. [DOI] [PubMed] [Google Scholar]
- 55.Maslov K, Zhang HF, Hu S, Wang LV. Optical-resolution photoacoustic microscopy for in vivo imaging of single capillaries. Opt Lett. 2008;33:929–931. doi: 10.1364/OL.33.000929. [DOI] [PubMed] [Google Scholar]
- 56.Wong TTW, Zhang R, Zhang C, Hsu HC, Maslov KI, Wang L, Shi J, Chen R, Shung KK, Zhou Q, Wang LV. Label-free automated three-dimensional imaging of whole organs by microtomy-assisted photoacoustic microscopy. Nat Commun. 2017;8:1386. doi: 10.1038/s41467-017-01649-3. [DOI] [PMC free article] [PubMed] [Google Scholar]
- 57.Herzog E, Taruttis A, Beziere N, Lutich AA, Razansky D, Ntziachristos V. Optical imaging of cancer heterogeneity with multispectral optoacoustic tomography. Radiology. 2012;263:461–468. doi: 10.1148/radiol.11111646. [DOI] [PubMed] [Google Scholar]
- 58.Razansky D, Buehler A, Ntziachristos V. Volumetric real-time multispectral optoacoustic tomography of biomarkers. Nat Protoc. 2011;6:1121–1129. doi: 10.1038/nprot.2011.351. [DOI] [PubMed] [Google Scholar]
- 59.Liao LD, Li ML, Lai HY, Shih YYI, Lo YC, Tsang SN, Chao PCP, Lin CT, Jaw FS, Chen YY. Imaging brain hemodynamic changes during rat forepaw electrical stimulation using functional photoacoustic microscopy. Neuroimage. 2010;52:562–570. doi: 10.1016/j.neuroimage.2010.03.065. [DOI] [PubMed] [Google Scholar]
- 60.Stein EW, Maslov K, Wang LHV. Noninvasive, in vivo imaging of the mouse brain using photoacoustic microscopy. J Appl Phys. 2009;105:102027. doi: 10.1063/1.3116134. [DOI] [PMC free article] [PubMed] [Google Scholar]
- 61.Stein EW, Maslov K, Wang LHV. Noninvasive, in vivo imaging of blood-oxygenation dynamics within the mouse brain using photoacoustic microscopy. J Biomed Opt. 2009;14:020502. doi: 10.1117/1.3095799. [DOI] [PMC free article] [PubMed] [Google Scholar]
- 62.Miles KA, Griffiths MR, Keith CJ. Blood flow-metabolic relationships are dependent on tumour size in non-small cell lung cancer: a study using quantitative contrast-enhanced computer tomography and positron emission tomography. Eur J Nucl Med Mol Imaging. 2006;33:22–28. doi: 10.1007/s00259-005-1932-7. [DOI] [PubMed] [Google Scholar]
- 63.Yao JJ, Maslov K, Hu S, Wang LHV. Evans blue dye-enhanced capillary-resolution photoacoustic microscopy in vivo. J Biomed Opt. 2009;14:054049. doi: 10.1117/1.3251044. [DOI] [PMC free article] [PubMed] [Google Scholar]
- 64.Chen SL, Xie ZX, Carson PL, Wang XD, Guo LJ. In vivo flow speed measurement of capillaries by photoacoustic correlation spectroscopy. Opt Lett. 2011;36:4017–4019. doi: 10.1364/OL.36.004017. [DOI] [PMC free article] [PubMed] [Google Scholar]
- 65.Sheinfeld A, Eyal A. Photoacoustic thermal diffusion flowmetry. Biomed Opt Express. 2012;3:800–813. doi: 10.1364/BOE.3.000800. [DOI] [PMC free article] [PubMed] [Google Scholar]
- 66.Wang LD, Yao JJ, Maslov KI, Xing WX, Wang LHV. Ultrasound-heated photoacoustic flowmetry. J Biomed Opt. 2013;18:117003. doi: 10.1117/1.JBO.18.11.117003. [DOI] [PMC free article] [PubMed] [Google Scholar]
- 67.Zhang RY, Wang LD, Yao JJ, Yeh CH, Wang LHV. In vivo optically encoded photoacoustic flowgraphy. Opt Lett. 2014;39:3814–3817. doi: 10.1364/OL.39.003814. [DOI] [PMC free article] [PubMed] [Google Scholar]
- 68.Brunker J, Beard P. Velocity measurements in whole blood using acoustic resolution photoacoustic Doppler. Biomed Opt Express. 2016;7:2789–2806. doi: 10.1364/BOE.7.002789. [DOI] [PMC free article] [PubMed] [Google Scholar]
- 69.Liu W, Lan B, Hu L, Chen R, Zhou Q, Yao J. Photoacoustic thermal flowmetry with a single light source. J Biomed Opt. 2017;22:1–6. doi: 10.1117/1.JBO.22.9.096001. [DOI] [PubMed] [Google Scholar]
- 70.Weber J, Beard PC, Bohndiek SE. Contrast agents for molecular photoacoustic imaging. Nat Methods. 2016;13:639–650. doi: 10.1038/nmeth.3929. [DOI] [PubMed] [Google Scholar]
- 71.Homan KA, Souza M, Truby R, Luke GP, Green C, Vreeland E, Emelianov S. Silver nanoplate contrast agents for in vivo molecular photoacoustic imaging. ACS Nano. 2012;6:641–650. doi: 10.1021/nn204100n. [DOI] [PMC free article] [PubMed] [Google Scholar]
- 72.Kim C, Cho EC, Chen JY, Song KH, Au L, Favazza C, Zhang QA, Cobley CM, Gao F, Xia YN, Wang LHV. In vivo molecular photoacoustic tomography of melanomas targeted by bioconjugated gold nanocages. ACS Nano. 2010;4:4559–4564. doi: 10.1021/nn100736c. [DOI] [PMC free article] [PubMed] [Google Scholar]
- 73.Li PC, Wang CRC, Shieh DB, Wei CW, Liao CK, Poe C, Jhan S, Ding AA, Wu YN. In vivo photoacoustic molecular imaging with simultaneous multiple selective targeting using antibody-conjugated gold nanorods. Opt Express. 2008;16:18605–18615. doi: 10.1364/OE.16.018605. [DOI] [PubMed] [Google Scholar]
- 74.Nie LM, Wang SJ, Wang XY, Rong PF, Bhirde A, Ma Y, Liu G, Huang P, Lu GM, Chen XY. In vivo volumetric photoacoustic molecular angiography and therapeutic monitoring with targeted plasmonic nanostars. Small. 2014;10:1585–1593. doi: 10.1002/smll.201302924. [DOI] [PubMed] [Google Scholar]
- 75.Pu KY, Shuhendler AJ, Jokerst JV, Mei JG, Gambhir SS, Bao ZN, Rao JH. Semiconducting polymer nanoparticles as photoacoustic molecular imaging probes in living mice. Nat Nanotechnol. 2014;9:233–239. doi: 10.1038/nnano.2013.302. [DOI] [PMC free article] [PubMed] [Google Scholar]
- 76.Brunker J, Yao JJ, Laufer J, Bohndiek SE. Photoacoustic imaging using genetically encoded reporters: a review. J Biomed Opt. 2017;22:070901. doi: 10.1117/1.JBO.22.7.070901. [DOI] [PubMed] [Google Scholar]
- 77.Cai X, Li L, Krumholz A, Guo ZJ, Erpelding TN, Zhang C, Zhang Y, Xi YN, Wang LHV. Multi-scale molecular photoacoustic tomography of gene expression. PLoS ONE. 2012;7:e43999. doi: 10.1371/journal.pone.0043999. [DOI] [PMC free article] [PubMed] [Google Scholar]
- 78.Kim C, Favazza C, Wang LHV. In vivo photoacoustic tomography of chemicals: high-resolution functional and molecular optical imaging at new depths. Chem Rev. 2010;110:2756–2782. doi: 10.1021/cr900266s. [DOI] [PMC free article] [PubMed] [Google Scholar]
- 79.de la Zerda A, Liu ZA, Bodapati S, Teed R, Vaithilingam S, Khuri-Yakub BT, Chen XY, Dai HJ, Gambhir SS. Ultrahigh sensitivity carbon nanotube agents for photoacoustic molecular imaging in living mice. Nano Lett. 2010;10:2168–2172. doi: 10.1021/nl100890d. [DOI] [PMC free article] [PubMed] [Google Scholar]
- 80.Dean-Ben XL, Razansky D. On the link between the speckle free nature of optoacoustics and visibility of structures in limited-view tomography. Photoacoustics. 2016;4:133–140. doi: 10.1016/j.pacs.2016.10.001. [DOI] [PMC free article] [PubMed] [Google Scholar]
- 81.Guo Z, Li L, Wang LV. On the speckle-free nature of photoacoustic tomography. Med Phys. 2009;36:4084–4088. doi: 10.1118/1.3187231. [DOI] [PMC free article] [PubMed] [Google Scholar]
- 82.Liu W, Zhou Y, Wang M, Li L, Vienneau E, Chen R, Luo J, Xu C, Zhou Q, Wang LV, Yao J. Correcting the limited view in optical-resolution photoacoustic microscopy. J Biophotonics. 2018;11:e201700196. doi: 10.1002/jbio.201700196. [DOI] [PubMed] [Google Scholar]
- 83.Rivenson Y, Gorocs Z, Gunaydin H, Zhang YB, Wang HD, Ozcan A. Deep learning microscopy. Optica. 2017;4:1437–1443. doi: 10.1364/OPTICA.4.001437. [DOI] [Google Scholar]
- 84.Zong WJ, Wu RL, Li ML, Hu YH, Li YJ, Li JH, Rong H, Wu HT, Xu YY, Lu Y, Jia HB, Fan M, Zhou Z, Zhang YF, Wang AM, Chen LY, Cheng HP. Fast high-resolution miniature two-photon microscopy for brain imaging in freely behaving mice. Nat Methods. 2017;14:713–719. doi: 10.1038/nmeth.4305. [DOI] [PubMed] [Google Scholar]