

Abstract
The paper proposes a new approach to heart activity diagnosis based on Gram polynomials and probabilistic neural networks (PNN). Heart disease recognition is based on the analysis of phonocardiogram (PCG) digital sequences. The PNN provides a powerful tool for proper classification of the input data set. The novelty of the proposed approach lies in a powerful feature extraction based on Gram polynomials and the Fourier transform. The proposed system presents good performance obtaining overall sensitivity of 93%, specificity of 91% and accuracy of 94%, using a public database of over 3000 heart beat sound recordings, classified as normal and abnormal heart sounds. Thus, it can be concluded that Gram polynomials and PNN prove to be a very efficient technique using the PCG signal for characterizing heart diseases.
Keywords: Heart sounds, Phonocardiogram, Cardiac signal analysis, Gram polynomials, Probabilistic neural network
Introduction
Both phonocardiography (PCG) and electrocardiogram (ECG) are the basic investigative methods used in cardiology. It is well known that the ECG has been the major diagnostic tool for cardiologists providing almost all information about the electrical activity of the heart [1–3]; in particular, the PCG signal, recorded by means of a stethoscope, contains different timings and relative intensities of heart beat sounds [4].
In the future, the introduction of electronic stethoscopes to the market allowing digital recording of heart sounds, together with the development of powerful algorithms for signal analysis [5–7], will enable the development of intelligent monitoring and telemedicine applications in which the patient could independently monitor the occurrence of any heart disease.
The aim of this paper is to focus on the use of Gram polynomials and probabilistic neural networks (PNN) as the PCG classifiers for the recognition of heart diseases [8]. This technique has been successfully applied in the field of cardiac biometry, or for personal identity recognition purposes [9].
Different approaches have been recently presented in the literature showing strong interest in automatic algorithms for heart disease recognition, based on different signal feature extraction such as Discrete Wavelet Transform (DWT) [10, 11], Discrete Sinc Transform (DSNT) [12] and different classification methods such as Support Vector Machine (SVM) [13, 14], Learning Vector Quantization (LVQ) [15, 16], Feed Forward Neural Network (FFN) [17], Convolutional Neural Network (CNN) [18], Generalized Regression Neural Network (GRNN) [19], Back Propagation Neural Network (BPNN) [20] etc. A particular typology of Neural Network, often used in ECG analysis in order to identify and classify various heart diseases is the Probabilistic Neural Network (PNN) [21–23]. In this paper the authors propose a new very robust method for heart disease recognition using a PNN and an innovative feature extraction technique based on Gram polynomials and Fourier Transform.
The paper is organized as follows: in Sect. 2 the basics of heart sound physiology is described; in Sect. 3 a brief description of Gram Polynomials is presented; in Sect. 4 the use of Gram Polynomials and FFT for the feature extraction is explained; in Sect. 5 the proposed RBPNN is described and the performance of the system is analysed. Finally in Sect. 6 relevant conclusions are drawn.
Heart sounds physiology
Heart sounds have an inherent periodicity due to the cardiac activation being periodic in nature. Traditionally heart sounds have been analyzed in one cardiac cycle at a time. Conclusions have been drawn from one beat or from an average of several beats. A cardiac cycle consists of precisely timed electrical and mechanical events that result in rhythmic atrial and ventricular contractions that pump blood into the pulmonary and systemic circulation. The period of ventricular contraction and ejection is called systole, and the period of ventricular relaxation and filling is called diastole (see Fig. 1).
Fig. 1.

The cardiac cycle showing left sided pressures and events. AP aortic pressure, LVP left ventricular pressure, LAP left atrial pressure, LVEDV LV end diastolic volume, LVESV LV end systolic volume
Both the systole and diastole start with periods of isovolumic pressure changes. The systole begins with isovolumic contraction (phase 2) where the ventricles contract against closed valves and hence no blood is ejected and volume is held constant. This increased ventricular wall tension causes the pressure to increase which eventually opens the aortic and pulmonic valve and the ventricular ejection occurs (phase 3). Blood is ejected through the aorta and the pulmonary artery when the ventricles contract. It is the forced closure against the mitral valve and the sudden rush of blood through the aorta that causes the first heart sound (S1). The total volume of blood ejected by each ventricle is called the stroke volume. Systole is complete when the aortic valve closes due to reduced flow and pressure (phase 4). This aortic and pulmonary closure, and the movement of blood column after their closure, cause the second heart sound (S2).
The S2 consists of two components, i.e. the aortic component (A2) and the pulmonic component (P2). Both the S1 and S2 are audible sounds with a bandwidth of 15–90 Hz. During the first part of diastole (phase 5), the ventricles relax and the aortic and pulmonary valves close. The ventricular pressure falls and when it drops below the corresponding atrial pressures the tricuspid and mitral valves open. This is followed by diastolic ventricular filling. The early diastolic filling (phase 6) is passive and in a stiff heart, as in a heart failure, results in the third heart sound (S3). During the late diastole (phase 1), when the atrium contracts against a stiff ventricle, the fourth heart sound is heard (S4). When present in adults, the S3 and S4 are indications of pathologic conditions of the heart. Both these sounds are low frequency sounds with a bandwidth of 5–25 Hz.
Heart sounds have been studied and used for many pathologic conditions of the heart including the deterioration of systolic performance, murmurs and increasing pressure. Historically, the S1 heart sound intensity has been associated with the force of blood ejected from the heart. Time frequency transforms have been thoroughly applied in the context of heart sounds.
Common applications of heart sounds
One of the most widespread applications of heart sounds analysis has been for murmur detection. Stethoscopes have been commonly used to listen murmurs, and several researchers have attempted to automate both murmur detection and classification. Cardiac sounds are by definition non-stationary signals, and are located within the low frequency range, approximately between 10 and 750 Hz. Since cardiac murmurs are high frequency sounds localized in certain parts of the cardiac cycle, time frequency transforms have been used to analyze them.
Time frequency techniques are used to improve heart sound signal quality. Moreover, time frequency transforms have also been used to understand the genesis of heart sounds. Whatever the approach, one of the first phases in the analysis of heart sounds is segmentation.
Heart sound segmentation process divides the PCG signal into four parts: S1 (first heart sound), systole, S2 (second heart sound) and diastole (see Fig. 2a) . First, S1 and S2 are located, then systole is represented by the interval S1 to S2 and diastole by the interval S2 to S1. In general, S3 and S4 are unusual sounds, similar in quality to S1 and S2, but smaller in magnitude. Both sounds are rare, and more often heard in the hearts of children. If S3 is present (Fig. 2b), it occurs between S2 and S1 (in diastole), usually right after S2. If S4 is present (Fig. 2c), it precedes S1 by approximately one hundred milliseconds.
Fig. 2.

Heart sound: a S1 and S2, b S3, c S4
Gram polynomials
Let us consider the finite energy signal space where a, b is a not necessarily limited interval of a real function which corresponds to if we define the scalar product and the rule as follows:
| 1 |
and
| 2 |
It is indicated that the present Euclidean space endowed with the scalar product and the rule outlined in (1) e (2) is an Hilbert space with scalar product.
In particular, it is considered that w is a nonnegative function, thus:
| 3 |
| 4 |
It can be proved that
Theorem 1
The vector space includes the polynomial space of all polynomials of degree n ( )
Least squares approximation
Knowing that and , the least squares problem lies in the estimation of , so that
| 5 |
where is an orthonormal basis of , compared to the above indicated scalar product.
The coefficients reduce the (5) if normal equations are formed:
| 6 |
Let us consider the group of polynomials e –1, 1] (Legendre weight). It can be proved that the above mentioned accounts for a nonorthogonal basis of .
In case of discrete time signals in orthonormal basis can be obtained (compared to the scalar product with Legendre weight) with the following iterative formulae [24] with , where m stands for the length of signal:
| 7 |
| 8 |
with , and .
For a good approximation of f by means of Gram polynomials it is necessary to find out the optimal value of n [25]. In fact, a well-known difficulty arises: when n increases, the approximant may oscillate with large amplitude near the endpoints of [−1, 1]. This phenomenon is called the Gibbs phenomenon [26]. Thus, the optimal value of n is the one reducing (1) and avoiding the Gibbs phenomenon.
The use of Gram polynomials and FFT in the novel proposed feature extraction
For practical applications, the original input variables are typically preprocessed to transform them into some new space of variables where, it is hoped, the pattern recognition problem will be easier to solve. This preprocessing stage is called feature extraction [27].
Preprocessing is performed in order to speed up computation and improve the classifications performances. Instead, the aim is to find useful features that are fast to compute, and that have good properties of discrimination.
A feature set suitable for the classification should possess two important properties:
Should be insensitive to significant translations.
Should be have a very low correlation (both inter-class that intra-class).
The justification for the use of Gram polynomials for the feature extraction is due to the fact that this involves a simple and mild computational burden and also determines a strong reduction of dimensionality while preserving useful discriminatory information.
Looking at the top of Fig. 4 it can see the great power of discrimination of the coefficients of the expansion (7), where is the PCG trace in exam. Infact, it can be notice that there is a marked difference between different patologies.
Fig. 4.
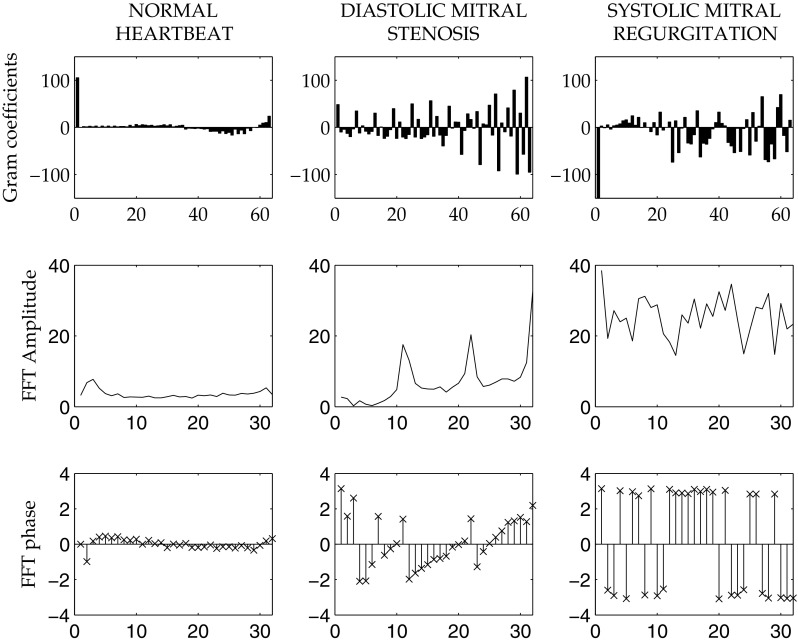
An example of a normal heartbeat in comparison with two pathologies (left to right). From the top to the bottom: the Gram coefficients, the related FFT amplitude spectrum and the FFT phases
On the other hand, such a coefficient set does not have a sufficiently low inter-class correlation as shown in Fig. 3 (for low inter-class correlation the covariance matrix should be diagonally dominant).
Fig. 3.
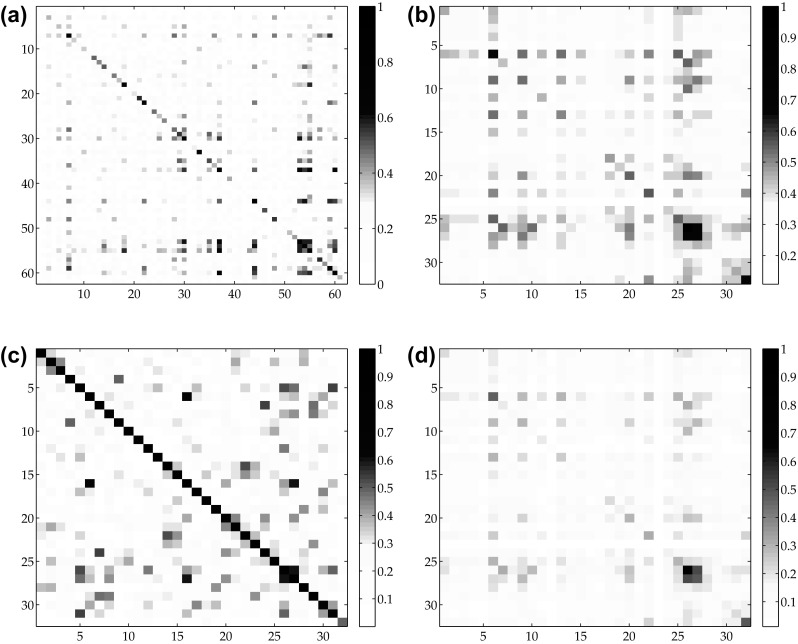
Covariance matrix related to: a the Gram polynomial coefficients, b the FFT amplitudes, c the FFT phases, d the absolute FFT spectrum
In order to provide a better discrimination among different kind of pathologies, we have applied to the Gram coefficients space the Fast Fourier Transform (FFT) so as to obtain the FFT Amplitudes and Phases as separated information. The reasons underlying this decision regard the covariance matrix of the computed coefficients (see Fig. 3b, c): while the amplitudes were able to correctly discriminate among different signals, the phases were suitable in order to make the correct associations among similar kind of pathologies. It is considered that such a behaviour would be lost using the absolute FFT spectrum (see Fig. 3d). Therefore, the input vector for the neural network was composed as a set of 64 features
| 9 |
where is the FFT of the Gram polynomial projection , therefore represents the FFT amplitudes, while represents the FFT phases.
Linear combination of the features will not often suffice to discriminate the classes and then we must use non-linear discriminant functions. For the estimate of discriminant functions, Gaussian neural networks have been found to be powerful scheme, in particular the Radial Basis Probabilistic Neural Networks (RBPNN) has been proved useful for classification and clustering problems.
The selected RBPNN
The proposed RBPNN (Fig. 5) is an implementation of a statistical algorithm called kernel discriminant analysis [28] in which operations are organized into a multilayered feedforward network with four layers:
Input layer
Pattern layer
Summation layer
Output layer
When an input is present, the first layer estimates the distance from the input vector to the training input vectors associated with the input layer, each of which represents a particular class (for the purpose of the present paper, has to distinguish between two classes: the normal and the abnormal heart sounds). The interval of values is standardized by subtracting the median and dividing by the interquartile range. As a result, a vector is produced whose elements indicate how close the input is to single classes in terms of Mahalanobis distance. By using this vector, the second layer applies a probability vector to indicate various possibilities of a match between the input vector and a particular class. Finally, the output layer defines the belonging of an input vector to a particular class by selecting the maximum value of the probability vector to predict the target class [29].
Fig. 5.

RBPNN model: —the number of features, —the number of samples and —the desired number pathology groups
More specifically, the k-th network output has the form
| 10 |
where
| 11 |
and are the function center (mean vector) and covariance matrix of the j-th basis function respectively and is a smoothing parameter controlling the spread of the j-th basis function.
We restricts to two global smoothing parameter and , where is used in those basis functions that have centers coming from the normal heart sounds while for the abnormal heart sounds. The determination of the smoothing parameters is done by calculating the spreads of the training data set belonging to the reference classes for and respectively.
The third layer (summation layer) performs an weighted average of the outputs from the second layer for each class. The fourth layer (output layer) performs a vote, selecting the largest value (the target values are: 0 for the abnormal heart sounds and 1 for the normal heart sounds).
Adding and removing training samples simply involves adding or removing neurons in the pattern layer and a minimal retraining required.
For the training of the neural network simply note that the centers and spreads are predetermined then only the weights is required to find. The calculation can be performed by using the method of least squares.
Experimental setup and results
The PGC database
In order to evaluate the performance of the proposed method we have analyzed the public database provided at Physionet Challenge 2016. The assembled database consists of nine different databases collected independently by seven research teams from different countries with different data quality, patient types and hardware used to record the heart sound [30]. The training set consists of 3126 heart sound recordings, lasting between 5 and 120 seconds and is divided into two categories: normal and abnormal heart sound. No other information on the pathology type is provided. The validation set contains a copy of 300 recordings from the training set and will be used to evaluate the performance of the proposed method. Heart sounds were collected from different locations on the body (e.g. aortic area, pulmonic area, tricuspid area, mitral area, etc.), the involved subjects include both children and adults and each subject may have contributed between one and six recordings. All recordings have been resampled to 2 KHz and have been provided in a .wav format [31].
Performance evaluation
The performance of the proposed methods is evaluated using benchmark metrics such as Accuracy (Acc), Sensitivity (Se) and Specificity (Sp), which are defined as follows:
| 12 |
| 13 |
| 14 |
where TP, FP, TN and FN represents true positive, false positive, true negative and false negative, respectively. Sensitivity, specificity and accuracy are statistical parameters able to evaluate the performance of a binary classifier and are commonly used in medical contexts. The sensitivity parameter measures the ability of the classifier to identify and recognize patients with heart disease; specificity, instead, measures the ability to correctly recognize subjects without heart disease.
Results
The database was divided into three groups: 2000 recordings for the training set, 826 recordings for the validation set and 300 recordings for the test set. The training set is used to find the model parameters in the used RBPNN network. These parameters are the number of neuron for each class (the abnormal heart sounds and the normal heart sounds), the smoothing parameter and , and the the weights value.
To find the optimal number of neurons we proceed as follows:
We use the data points of the training set as the centres of the network’s neurons, so obtaining a network with 2000 neurons split up into two classes (1000 neurons represent the abnormal heart sounds and 1000 represent the normal heart sounds).
We calculate the network’s weights by using the training set.
We eliminate the neuron with a minimum weight and recalculate the network’s weights by using the training set. The procedure ends when the performance, in terms of correct classification on the validation set, falls down of the 2% with respect to the previous step.
The resulting network after the training phase is shown in Fig. 6. It consists of 73 neurons (38 of them represent the abnormal heart sounds and 35 represent the normal heart sounds). Once the optimal parameters are found the trained PNN classifier is applied to classify the data points in the test set into one of the two classes.
Fig. 6.

Architecture of the proposed PNN classifier
A comparison of different classification techniques for heart sound classification based on the same database is summarized in Table 1. The reported results in terms of sensitivity and specificity refer to the public training and validation set provided in [31]; the test set used in Physionet Challenge 2016 is unavailable to the public.
Table 1.
Comparison of different classification approaches on the same database
| Methods | Features | Classifiers | Sensitivity (%) | Specificity (%) |
|---|---|---|---|---|
| Vernekar et al. [32] | Markov | Combination of XGBOOST and ANN | 79.2 | 84.3 |
| Grzegorczyk et al. [33] | Multidomain | Neural network | 83 | 62 |
| Tang et al. [34] | Multidomain | BPNN | 81 | 86 |
| Zabihi et al. [35] | Multidomain | 20 Feed forwarding ANN | 94.23 | 88.76 |
| Goda et al. [36] | S1 width, DFT, DWT | SVM | 82.7 | 91.7 |
| Homsi et al. [37] | Multidomain | CSC, LB, RF | 86 | 94.2 |
| Langley et al. [38] | Wavelet analysis | Wavelet entropy threshold | 95 | 60 |
| Nilanon et al. [39] | Spectrograms, MFCC | Logistic regression (LR) | 71 | 68.8 |
| SVM | 82.6 | 83.2 | ||
| Random forest (RF) | 68.7 | 68.5 | ||
| CNN | 81 | 96 | ||
| Rubin et al. [40] | MFCC | CNN | 75 | 100 |
| Potes et al. [41] | Multidomain | Combination of CNN and AdaBoost | 94.24 | 77.81 |
| Munia et al. [42] | Multidomain | SVM | 76 | 88 |
| The proposed method | Gram polynomials and FFT | RBPNN | 93 | 91 |
BPNN back propagation neural network, DFT discrete Fourier transform, DWT discrete wavelet transform, RF random forest, CSC cost sensitive classifier, LB LogitBost, CNN convolutional neural network, ANN artificial neural network
Table 2 shows the proposed method performance in terms of accuracy, sensitivity and specificity, according to Eqs. (12), (13), (14).
Table 2.
Classification results of the proposed method
| Accuracy (%) | Sensitivity (%) | Specificity (%) |
|---|---|---|
| 94 | 93 | 91 |
The proposed technique of heart activity diagnosis based on Gram polynomials and probabilistic neural networks (PNN) is very robust and can recognize any abnormalities of the cardiac system to identify a specific disease. The diagnosis performance of this study shows the advantage of this system: it is rapid, easy to operate, noninvasive, and inexpensive. These technical and performance features of the proposed automatic classification algorithms point out the possibility of designing advanced assistance diagnosis systems.
Conclusion
In this study, we developed an expert diagnostic system for the interpretation of the PCG signals using Gram polynomials and probabilistic neural networks (PNN). The diagnosis performance of this method was demonstrated on a database of over 3000 heart beat sound recordings.
The stated results show that the proposed method can make an efficient interpretation with an accuracy, sensitivity and specificity of 94, 93 and 91%, respectively. Thus, it can be concluded that Gram polynomials and probabilistic neural networks (PNN) prove to be a very efficient technique using the PCG signal for characterizing heart diseases.
Conflict of interest
The authors declare that there is no conflict of interest.
Ethical standard
This paper does not contain any studies with human participants or animals performed by any of the authors. On this matter we would also like to point out that our experiments, concerning data analysis and classification, has not directly been performed on human beings, but were concerning the off-line analysis of the signals obtained by a public database (see https://physionet.org/challenge/2016/) in order to grant more transparency and to use a safe data source also in terms of ethical approval.
References
- 1.Raj Sandeep, Maurya Kshitij. A knowledge-based real time embedded platform for arrhythmia beat classification. Biomed Eng Lett. 2015;5(4):271280. doi: 10.1007/s13534-015-0196-9. [DOI] [Google Scholar]
- 2.Zhang Zhancheng, Luo Xiaoqing. Heartbeat classification using decision level fusion. Biomed Eng Lett. 2014;4(4):388395. doi: 10.1007/s13534-014-0158-7. [DOI] [Google Scholar]
- 3.Kim Min Soo, Cho Young Chang, Seo Suk-Tae, Son Chang-Sik, Kim Yoon-Nyun. A new method of ECG feature detection based on combined wavelet transform for u-health service. Biomed Eng Lett. 2011;1(2):108115. [Google Scholar]
- 4.Kumar Roy Ajay, Abhishek Misal, Sinha GR. Classification of PCG signals: a survey. NCRAIT. 2014;2:22–26. [Google Scholar]
- 5.Gupta CN, Palaniappan R, Rajan S, Swaminathan S, Krishnan SM. Segmentation and classification of heart sounds. In: Canadian conference on electrical and computer engineering, 2005, p. 1674–1677; 2005
- 6.Abbas Abbas K, Rasha Bassam. Phonocardiography signal processing. San Rafael: Morgan & Claypool; 2009. [Google Scholar]
- 7.Beritelli F, Serrano S. Biometric identification based on frequency analysis of cardiac sounds. IEEE Trans Inf Forensics Secur. 2007;2(3):596–604. doi: 10.1109/TIFS.2007.902922. [DOI] [Google Scholar]
- 8.Mitra Malay, Samanta RK. Cardiac arrhythmia classification using neural networks with selected features. Proc Technol. 2013;10:76–84. doi: 10.1016/j.protcy.2013.12.339. [DOI] [Google Scholar]
- 9.Beritelli F, Capizzi G. A new approach to heart sounds biometric recognition based on gram-PNN. In: ISTET 2013: international symposiumon theoretical electrical engineering, p. III-5-III-6, 24 26 June. Czech Republic: Pilsen; 2013.
- 10.Salam, AK, Srilakshmi G. An algorithm for ECG analysis of arrhythmia detection. In: IEEE international conference on electrical, computer and communication technologies (ICECCT); 2015.
- 11.Debbal SM. Model of differentiation between normal and abnormal heart sounds in using the discrete wavelet transform. J Med Bioeng. 2014;3(1):5–11. [Google Scholar]
- 12.Gad AMM. Feature extraction of electrocardiogram signals using discrete sinc transform. In: 2016 9th Biomedical engineering international conference (BMEiCON); 2016.
- 13.Burges CJC. A tutorial on support vector machines for pattern recognition. Data Min Knowl Discov. 1998;2(2):121–167.
- 14.Vapnik V. The nature of statistical learning theory. Berlin: Springer Science Business Media; 2013. [Google Scholar]
- 15.Palreddy S, Tompkins WJ, Hu YH. Customization of ECG beat classifiers developed using SOM and LVQ. In: IEEE 17th annual conference engineering in medicine and biology society, Vol. 1; 1995.
- 16.Elsayad AlM. Classification of ECG arrhythmia using learning vector quantization neural networks. In: International conference on computer engineering systems, ICCES 2009; 2009.
- 17.Perez RR, Marques A, Mohammadi F. The application of supervised learning through feed-forward neural networks for ECG signal classification. In: 2016 IEEE Canadian conference on electrical and computer engineering (CCECE); 2016.
- 18.Zubair M, Kim J, Yoon C. An automated ECG beat classification system using convolutional neural networks. In: 6th international conference on IT convergence and security (ICITCS); 2016.
- 19.Zebardast Behnam, Ghaffari Ali, Masdari Mohammad. A new generalized regression artificial neural networks approach for diagnosing heart disease. Int J Innov Appl Stud. 2013;4(4):679. [Google Scholar]
- 20.Gautam MK, Giri VK. A neural network approach and wavelet analysis for ECG classification. In: 2016 IEEE international conference on engineering and technology (ICETECH); 2016.
- 21.Dessai Fal Indira. Intelligent heart disease prediction system using probabilistic neural network. Int J Adv Comput Theory Eng. 2013;2(3):2319–2526. [Google Scholar]
- 22.Sadri S, Hashemi R, Abdollapour A, Chalabi K, Salamat MA. A novel probabilistic artificial neural networks approach for diagnosing heart disease. In: International journal in foundations of computer science technology (IJFCST), vol 5, no. 6; 2015.
- 23.Phaudphut C, So-In C, Phusomsai W. A parallel probabilistic neural network ECG recognition architecture over GPU platforms. In: IEEE of 13th international joint conference on computer science and software engineering (JCSSE); 2016.
- 24.Atkinson K, Han W. Theoretical numerical analysis: a functional analysis framework. 3. New York: Springer; 2001. [Google Scholar]
- 25.Barnard RW, Dahlquist G, Pearce K, Reichel L, Richards KC. Gram polynomials and the kummer function. J Approx Theory. 1998;94(1):128–143. doi: 10.1006/jath.1998.3181. [DOI] [Google Scholar]
- 26.Vretblad A. Fourier analysis and its applications. 1. New York: Springer; 2003. [Google Scholar]
- 27.Bishop Christopher M. Pattern Recognition and Machine Learning (Information Science and Statistics) New York, Inc: Springer-Verlag; 2006. [Google Scholar]
- 28.Ripley Brian D. Pattern recognition and neural networks. Cambridge: Cambridge University Press; 2008. [Google Scholar]
- 29.Gupta MM, Jin L, Homma N. Static and dynamic neural networks. New York: Wiley; 2003. [Google Scholar]
- 30.Liu C, Springer D, Li Q, Moody B, Juan RA, Chorro FJ, Castells F, Roig JM, Silva I, Johnson AE, Syed Z, Schmidt SE, Papadaniil CD, Hadjileontiadis L, Naseri H, Moukadem A, Dieterlen A, Brandt C, Tang H, Samieinasab M, Samieinasab MR, Sameni R, Mark RG, Clifford GD. An open access database for the evaluation of heart sound algorithms. Physiol Meas. 2016;37(9):2181. doi: 10.1088/0967-3334/37/12/2181. [DOI] [PMC free article] [PubMed] [Google Scholar]
- 31.https://physionet.org/challenge/2016/
- 32.Vernekar S, Nair S, Vijaysenan D, Ranjan R. A novel approach for classification of normal/abnormal phonocardiogram recordings using temporal signal analysis and machine learning. In: Computing in cardiology conference (CinC); 2016.
- 33.Gregorczyk I, Solinski M, Lepek M, Perka A, Rosinski J, Rymko J. PCG classification using a neural network approach. In: Computing in cardiology conference (CinC); 2016.
- 34.Tang H, Chen H, Li T, Zhong M. Classification of normal/abnormal heart sound recordings based on multi-domain features and back propagation neural network. In: Computing in cardiology conference (CinC); 2016.
- 35.Zabihi M, Rad AB, Kiranyaz S, Gabbouj M, Kastaggelos AK. Heart sound anomaly and quality detection using ensemble of neural networks without segmentation. In: Computing in cardiology conference (CinC); 2016.
- 36.Goda MA, Hajas P. Morphological determination of pathological PCG signals by time and frequency domain analysis. In: Computing in cardiology conference (CinC); 2016.
- 37.Homsi MN, Medina N, Hernandez M, Quintero N, Perpinan G, Quintana A, Warrick P. Automatic heart sound recording classification using a nested set of ensemble algorithms. In: Computing in cardiology conference (CinC); 2016.
- 38.Langley P, Murray A. Abnormal heart sounds detected from short duration unsegmented phonocardiograms by wavelet entropy. In: Computing in cardiology conference (CinC); 2016.
- 39.Nilanon T, Yao J, Hao J, Purushotham S, Liu Y. Normal/abnormal heart sound recordings classification using convolutional neural network. In: Computing in cardiology conference (CinC); 2016.
- 40.Rubin J, Abreu R, Ganguli A, Nelaturi S, Matei I, Sricharan K. Classifying heart sound recordings using deep convolutional neural networks and mel-frequency cepstral coefficients. In: Computing in cardiology conference (CinC); 2016.
- 41.Potes C, Parvaneh S, Rahman A, Conroy B. Ensemble of feature-based and deep learning-based classifiers for detection of abnormal heart sounds. In: Computing in cardiology conference (CinC); 2016.
- 42.Munia T, Tavakolian K, Verma A, Zakeri V. Heart sound classification from wavelet decomposed signal using morphological and statistical features. In: Computing in cardiology conference (CinC); 2016.